Financial Operations
A Founder's Guide to Actuals vs Budget Analysis
Our guide shows how actuals vs budget analysis reveals hidden cash flow opportunities and drives predictable growth for your business.
ByJumpstart Partners, CPA, QuickBooks ProAdvisor
··20 min readKey Takeaway
Actuals vs budget analysis compares your planned financials against actual results to calculate variances—the gap that reveals operational reality. A favorable variance means better-than-budgeted results (higher revenue or lower expenses); unfavorable means worse. For SaaS companies, track CAC and NRR variances; for agencies, monitor billable utilization and project gross margin. Companies with monthly variance reviews and 5-10% materiality thresholds identify problems 90 days earlier than those reviewing quarterly.
Your budget is a plan built on assumptions. Your actuals are the hard numbers. The real work of an actuals vs budget analysis isn't just seeing the difference—it's digging into the gap (the variance) to make smarter, faster decisions.
Why Your Business Runs On Actuals vs Budget Analysis
As a founder or CEO, you face high-stakes questions daily. Should you hire another salesperson? Can you afford that new marketing software? Is now the right time to push into a new market?
Answering these with a gut feeling is a fast track to stalled growth and serious cash flow problems. Confidence comes from systematically comparing what you planned to do with what actually happened.
This is the entire point of an actuals vs budget analysis. It is not a backward-looking accounting chore; it's your primary tool for financial control and strategic foresight. By understanding your variances, you uncover the story behind the numbers.
"A budget is a prediction of the future, and an actual is a record of the past. The magic is in comparing the two to understand what happened and why. That understanding is what allows you to make better predictions and decisions for the future." – Dennis K. Williams, Financial Management Consultant
A well-run analysis turns your financial data from a static report into an active feedback loop. This process is crucial for four key reasons:
- Improve Predictability: The more you analyze variances, the sharper your financial forecasts become. Our guide on cash flow forecasting for small businesses explains how this accuracy creates operational stability.
- Drive Accountability: When department heads own their budget numbers, they become accountable for explaining why performance deviated from the plan. This fosters a culture of financial discipline.
- Uncover Opportunities: A favorable variance isn't just good news; it's a signal. Maybe a specific marketing channel is crushing its goals and deserves more investment.
- Mitigate Risks Early: An unfavorable variance, like a sudden spike in customer acquisition costs, is an early warning. It gives you a chance to take corrective action before it torpedoes your profitability.
To get started, you must understand the unique role each of these components plays.
Budgeting vs Actuals At A Glance
This table breaks down the fundamental differences in purpose, timing, and strategic function between your budget and your actual financial results. Think of it as the plan versus the reality.
| Attribute | Budget (The Plan) | Actuals (The Reality) |
|---|---|---|
| Purpose | To set financial goals, allocate resources, and establish performance targets for a future period. | To record historical financial transactions and measure what actually occurred. |
| Timing | Forward-looking; created before a financial period begins (e.g., annually, quarterly). | Backward-looking; recorded as transactions happen and finalized after a period ends. |
| Data Source | Based on assumptions, historical data, strategic initiatives, and market forecasts. | Sourced directly from your accounting system (e.g., QuickBooks, Xero) and bank statements. |
| Strategic Use | Used for planning, goal-setting, and motivating performance across the organization. | Used for performance evaluation, operational adjustments, and external reporting. |
Ultimately, your budget is the roadmap you draw, while your actuals are the terrain you actually cross. The analysis is how you navigate the difference.
Calculating And Interpreting Financial Variance
Once you have your budget and your actuals side-by-side, the real work begins. The goal isn’t just to see the numbers; it’s to calculate and understand the difference between them—the financial variance. This analysis is the engine of financial control, turning raw data into a clear story about your company's performance.
The process is refreshingly simple: compare what you planned to do with what actually happened. This immediately pinpoints where you over- or under-performed, giving you the hard data needed to make course corrections.
This flow shows how financial control moves from a plan (budget) to reality (actuals) and, finally, to insight (variance analysis).
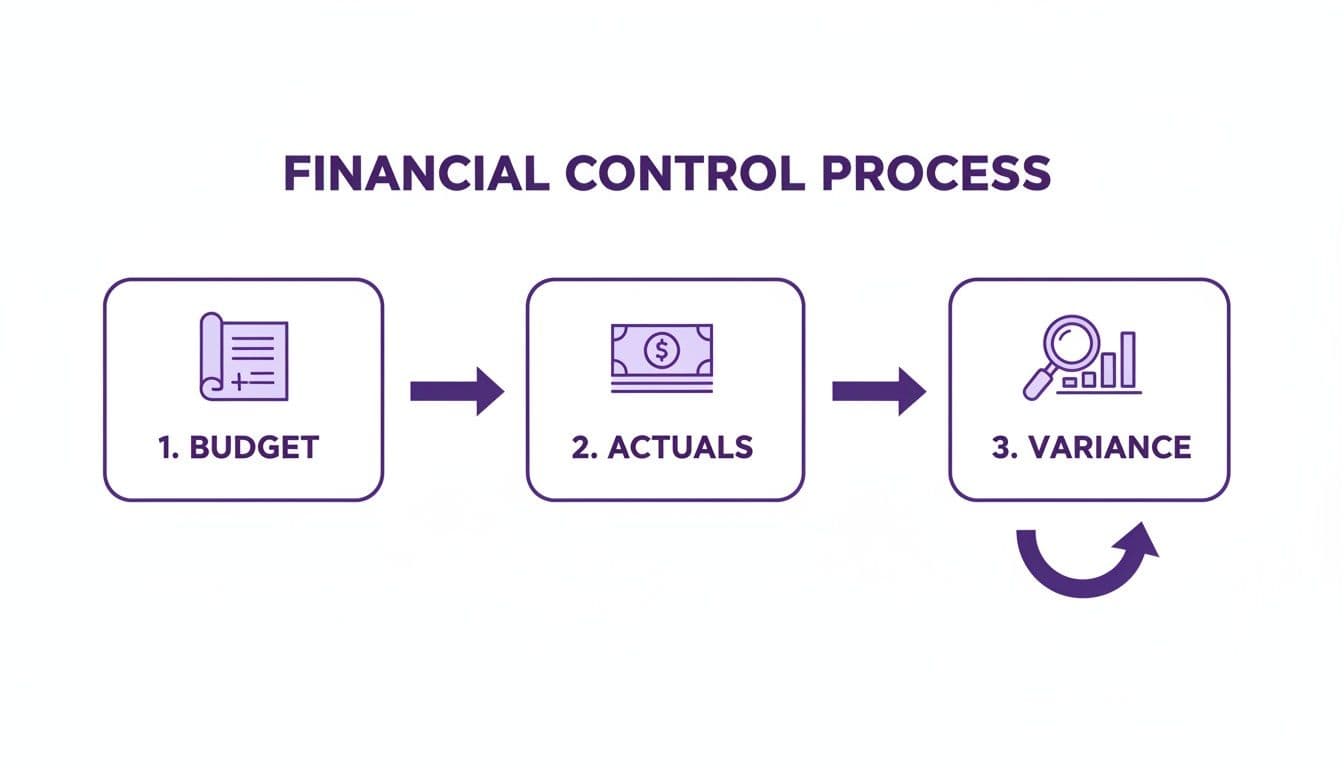
Ultimately, these three steps create a continuous feedback loop. The more you analyze your variances, the smarter and more accurate your financial planning becomes.
The Two Types Of Variance: Favorable vs. Unfavorable
Every variance you find will fall into one of two buckets. But their names can be misleading without context. You have to understand what each one truly signals about the business.
- Favorable Variance: This is when your actual results are better than what you budgeted. for revenue, this means you earned more than planned. for expenses, it means you spent less than you allocated.
- Unfavorable Variance: This happens when actual results are worse than your budget. On the revenue side, you earned less than planned. for expenses, you spent more.
A common misconception is assuming all favorable variances are good and all unfavorable ones are bad. for instance, a huge favorable variance in your marketing budget looks great at first glance. But what if it happened because you pulled the plug on a campaign that was generating high-quality leads? That "savings" could torpedo next quarter's revenue. This is why digging into the "why" is non-negotiable; you have to see the second-order effects. Learn more about how this impacts profitability in our guide on understanding contribution margin.
How To Calculate Variance: A Worked Example
The math for variance analysis is simple, but its power comes from application. To get the full picture, you need to calculate both the dollar variance and the percentage variance. A $10,000 variance means something completely different for a $20,000 budget line item than it does for a $500,000 one.
Let's walk through a practical example for a SaaS company's Monthly Recurring Revenue (MRR).
- Budgeted MRR: $60,000
- Actual MRR: $50,000
First, calculate the dollar variance:
Dollar Variance = Actual Amount - Budgeted Amount
$50,000 - $60,000 = -$10,000
Next, calculate the percentage variance:
Percentage Variance = (Dollar Variance / Budgeted Amount) x 100
(-$10,000 / $60,000) x 100 = -16.7%
This -16.7% unfavorable variance is a significant red flag. It tells you that you missed your top-line revenue goal by a wide margin. This isn't just a finance problem; it's a direct signal to your sales and marketing leaders that something in the customer acquisition engine is either broken or seriously underperforming. According to OpenView's 2024 SaaS Benchmarks, companies in the $1-5M ARR range often see revenue forecast accuracy within +/- 10%, so a 16.7% miss warrants immediate investigation.
Applying Variance Analysis in SaaS and Service Businesses
Generic financial advice is useless for fast-growing SaaS and service companies. Tracking top-line revenue variance is a starting point, but your strategic edge comes from applying actuals vs. budget analysis to the specific Key Performance Indicators (KPIs) that fuel your business model.
for a SaaS founder, an unfavorable revenue variance is a lagging indicator. The real problem is almost always buried in your unit economics. for an agency leader, a healthy overall P&L can easily hide a few deeply unprofitable projects or an underutilized team bleeding you dry. Digging into the right metrics is how you spot these problems before they cripple your cash flow.
SaaS Specific Variance Analysis
In a SaaS business, your budget is a mathematical model of your growth engine. That means your most critical variances will be tied to how you acquire and retain customers.
Two metrics, above all others, demand constant attention:
- Customer Acquisition Cost (CAC): This is the all-in cost to get a new customer. A sudden unfavorable variance here is a massive red flag.
- Customer Lifetime Value (LTV): This predicts the total profit a customer will generate. A dip here signals problems with your pricing, product, or customer satisfaction.
Let’s walk through a real-world calculation. Suppose you budgeted a CAC of $5,000 for Q2. This was based on a planned $100,000 marketing spend to acquire 20 new customers.
- Budgeted CAC: $100,000 / 20 customers = $5,000
- Actual Results: The quarter ends, and you find you spent $120,000 but only signed 15 new customers.
- Actual CAC: $120,000 / 15 customers = $8,000
Dollar Variance = $8,000 - $5,000 = $3,000 (Unfavorable)
Percentage Variance = ($3,000 / $5,000) x 100 = 60% (Unfavorable)
A 60% unfavorable variance in CAC is an emergency brake moment. It tells you your ad spend became inefficient, the sales cycle got longer, or your conversion rates cratered. This KPI variance gives you a specific operational problem to solve long before its full impact hammers your P&L. Understanding these dynamics is central to building a robust financial model, a topic we explore further in our guide on why SaaS cash flow forecasting is different.
Service Business Specific Variance Analysis
for digital agencies, dev shops, and professional services firms, profitability lives and dies by how you manage your people and projects. Your most important variances aren't on the top line; they're tied to resource allocation and delivery efficiency.
You need to focus your analysis on two key areas:
- Billable Utilization Rate: This is the percentage of an employee's paid time that is actually billed to clients. A low rate means you have an expensive, unproductive bench.
- Project Profitability: This measures the gross margin on every single project or client. It’s how you expose which clients are funding your growth and which are a quiet drain on resources.
"Agencies often make the mistake of tracking only the overall company P&L. True financial control comes from knowing your gross margin on every single project. An unfavorable variance there is a direct signal of scope creep, poor project management, or incorrect initial pricing." – Jonathan Healy, Co-Founder, Jumpstart
Imagine you budgeted a billable utilization rate of 80% for your senior development team. But after a month of endless internal meetings and scope creep on a fixed-fee project, the actual rate comes in at 65%. This 15% unfavorable variance directly translates to lost revenue and crushed gross margins. It’s an immediate signal to leadership that project management processes are broken or your sales team is closing unprofitable deals.
KPI Variance Analysis By Industry
The table below highlights critical KPIs to monitor for variance in SaaS and Agency models, and what those variances signal about your business health. These aren't just numbers; they are the vital signs of your company.
| Industry | Key Performance Indicator | What An Unfavorable Variance Signals |
|---|---|---|
| SaaS | Customer Acquisition Cost (CAC) | Inefficient marketing spend, poor channel performance, or a broken sales funnel. |
| SaaS | Net Revenue Retention (NRR) | Customer churn, failed upsells, or product dissatisfaction. |
| Agency / Services | Billable Utilization | Poor resource scheduling, excessive non-billable work, or insufficient project pipeline. |
| Agency / Services | Project Gross Margin | Scope creep, inaccurate project estimates, or inefficient service delivery. |
Watching these specific KPIs helps you move from simply recording financial history to actively shaping your company’s future. An unfavorable variance is not a failure; it is an early warning system telling you exactly where to focus your attention.
Diagnosing Common Causes Of Budget Variances
Spotting a variance is the easy part. The real value is digging in to figure out why it happened. Simply knowing you missed your revenue target by 15% doesn't help you fix anything. Was it a new competitor? A bad sales comp plan? You cannot act until you know the root cause.
Most variances boil down to a handful of common issues that fall into two buckets: internal factors you can control and external factors you have to react to. Getting this diagnosis right prevents you from overcorrecting for the wrong problem—like slashing your marketing budget when the real issue is a broken sales process.
Internal Factors Driving Variances
Internal issues are the most frequent culprits behind budget variances and, thankfully, the ones you have the most power to fix. They almost always trace back to flawed assumptions or operational breakdowns.
- Inaccurate Forecasting: This is the most common cause. Your budget is a forecast built on assumptions about sales cycles, conversion rates, and market demand. If those assumptions were too optimistic or based on stale data, your budget was dead on arrival.
- Operational Inefficiencies: for a professional services firm, this often shows up as scope creep on fixed-fee projects. In SaaS, it might be a clunky customer onboarding process that leads to higher-than-expected churn, creating a nasty unfavorable revenue variance.
- Poor Expense Control: This happens when there's a lack of clear ownership or policy. If sales travel expenses are constantly over budget, the problem isn't the travel itself. The real problem is the absence of a clear policy that defines what’s acceptable and ties that spending back to a measurable ROI.
"A budget variance is an answer to a question you haven’t asked yet. It forces you to investigate operational reality—Did we price the project wrong? Did the client change the scope? Is our team working efficiently? The numbers just point you to the right questions." – Sarah Jennings, Fractional CFO
External Factors You Cannot Control
You cannot control the market, but you can control how quickly you react to it. External factors are notorious for causing sudden, significant shocks to your budget.
A McKinsey report highlighted this during the pandemic, noting that 70% of companies saw revenue variances over 15% due to market volatility. This forced them into frequent rebudgeting as external conditions made their initial plans obsolete. You can see more on navigating these shifts from Alpinemarine's analysis.
Key external factors include:
- Market Shifts: A sudden change in customer demand, new regulations, or a broader economic downturn can make your revenue targets totally unreachable.
- Competitor Actions: A new competitor entering the market or an existing one launching an aggressive pricing strategy can immediately hammer your sales volume and drive up customer acquisition costs.
- Vendor Issues: Unexpected price hikes from a key software vendor or supplier directly create an unfavorable expense variance, eating into your gross margin.
Warning Signs: Red Flags in Your Variance Report
When reviewing your report, certain patterns are immediate red flags that require deeper investigation. Do not ignore them.
| Red Flag | What It Signals |
|---|---|
| Consistently high variances (over 20%) | Your budgeting process is fundamentally broken. Your core assumptions are disconnected from reality. |
| Favorable expense variance with unfavorable revenue | You "saved" money by cutting spending (e.g., marketing) that was essential for growth, hurting your top line. |
| Sales commissions are way over budget, but revenue is not | Your sales compensation plan is misaligned, likely rewarding activity or unprofitable deals instead of true revenue growth. |
| Small, recurring unfavorable variances across many departments | This indicates a widespread lack of financial discipline and expense control, a "death by a thousand cuts" problem. |
By systematically investigating each significant variance, you build a more resilient and predictable business. This process turns your budget from a static document into a dynamic tool for navigating growth.
Implementing An Effective Budget Review Process
Diagnosing budget variances is a crucial skill, but those insights are worthless without a disciplined process to act on them. The best companies do not treat actuals vs. budget analysis as a reactive, once-a-year scramble. They build it into a proactive, monthly operational rhythm. This creates a structured system for accountability and continuous improvement.
A solid review process is what moves you from just spotting problems to actually solving them. It ensures department heads take ownership of their numbers and that the lessons from last month's performance directly shape next month's strategy.

Actionable Next Steps: Your Monthly Review Process
Follow this three-step process every month to turn your analysis into action.
| Step | Action | Why It Matters |
|---|---|---|
| 1. Establish a Monthly Cadence | Conduct a formal budget vs. actuals review every month, immediately after closing the books. Make this meeting non-negotiable. | A quarterly check-in is too slow. By the time you identify an issue, you've already lost a full quarter to correct it. A monthly rhythm enables rapid course corrections. |
| 2. Set Materiality Thresholds | Define which variances warrant discussion. A best practice is a dual trigger: any line item off by more than 5% and over a specific dollar amount (e.g., $10,000). | This filters out noise and forces your leadership team to focus on the numbers that actually move the needle, not a $500 overspend on office supplies. |
| 3. Drive Departmental Accountability | Require every major budget owner (e.g., Head of Sales, Marketing) to explain any material variances in their area and present their plan to address them. | This transforms the review from a finance presentation into a collaborative, problem-solving session. It builds financial literacy and empowers leaders to own their performance. |
This whole process relies on having clean, timely numbers to begin with. Our guide on establishing a monthly close process framework will help you build that solid foundation.
How An Outsourced Controller Delivers Financial Control
You know that actuals vs. budget analysis is critical. But executing it every single month is a massive operational lift, especially for a lean team. When your key people are juggling product, sales, and customers, the financial rhythm is usually the first thing to get pushed aside. This is the point where an outsourced controller stops being a "nice-to-have" and becomes a strategic necessity.
Instead of your team pulling data and wrestling with spreadsheets, a dedicated finance team builds and runs the entire process for you. It is about more than saving a few hours; it’s about installing a system of genuine financial control that gives you the oversight to scale with confidence. This isn’t basic bookkeeping—it's high-level financial management.
Systemizing Financial Oversight
A great outsourced controller plugs directly into your core systems—your QuickBooks, Stripe, and Gusto—to create a seamless and accurate financial picture.
This deep integration is the foundation for a fast, reliable month-end close, a process our team typically completes in just five business days. That kind of speed means your variance analysis is not based on stale, six-week-old data. It is immediate and actionable.
By the time your monthly leadership meeting rolls around, you have investor-ready dashboards that clearly show your most important variances. You can see in an instant if Customer Acquisition Cost is trending up or if a particular service line is underperforming, allowing you to make course corrections in real-time.
From Analysis to Actionable Strategy
An outsourced team’s real value goes way beyond just generating reports. They provide the strategic layer that connects the numbers to what's actually happening in your operations. Wondering what a fractional controller actually does? They interpret the data and help you build a concrete plan.
for example, if we spot a recurring unfavorable variance in your professional services gross margin, we work with you to diagnose the root cause. Is it scope creep? Inaccurate project quoting? Or maybe inefficient team utilization?
The goal is to move from simply identifying problems to proactively solving them. for our clients, this systematic approach has improved cash flow by an average of 40%. It’s about building a predictable financial engine that truly supports your growth ambitions.
If you're ready to gain this level of control without the cost of a full-time finance department, let's talk. We can show you how to turn your financial operations into a true competitive advantage.
Common Questions About Budget vs. Actuals
Even with a clear process, founders and finance leaders run into the same questions when they start digging into their numbers. Here are the most common ones I hear—and my direct answers.
How Often Should I Review My Budget Variances?
You need to run a formal actuals vs. budget review every single month. Do not skip it.
Quarterly reviews are way too slow. By the time you spot a problem, an entire quarter is gone, and you've lost 90 days you could have spent fixing it.
A monthly cadence creates a rhythm. It turns your financial data from a historical report card into a forward-looking tool. This lets you make small, consistent course corrections instead of drastic, reactive changes when things go off the rails. This frequency is one of the biggest drivers of predictability in a growing business.
What Is Considered a Significant Variance?
A variance is significant when it's big enough to actually threaten your financial targets or signal a real operational breakdown. Chasing down every tiny discrepancy is a complete waste of time. The key is to set materiality thresholds.
A solid best practice for businesses in the $500K to $20M revenue range is to investigate any variance that meets both of these criteria:
- It's greater than 5-10% of the budgeted amount, AND
- It exceeds a specific dollar value, like $5,000 or $10,000.
This dual-trigger approach is crucial because it filters out all the noise. It stops your team from wasting an hour analyzing why a $200 software subscription had a 50% variance while forcing them to focus on the numbers that truly move the needle.
My Variances Are Consistently Large. What Am I Doing Wrong?
If your variances are consistently huge—say, over 20% month after month—that’s a major red flag. This isn't just a string of bad luck; it’s a clear signal that there's a fundamental disconnect between your plan and what's actually happening in your business.
The most common culprit is a broken budgeting process. Your initial assumptions about things like sales cycles, customer acquisition costs, or even market demand were likely built on shaky data or overly optimistic "gut feelings." You are not correctly measuring the things that actually drive your business.
Your immediate next step is to go back and stress-test every single core assumption in your financial model. Pull up your historical data. Stop treating the budget like a wish list and start building it as a data-driven operational plan.
Turning financial analysis into a disciplined, strategic advantage is a significant operational lift. The team at Jumpstart Partners builds and manages this entire process for you, delivering a fast 5-day month-end close and the clear variance reports you need to scale with confidence. Schedule a consultation to see how our outsourced controllers can give you total financial control.