Financial Operations
How Well Are Your Assets Working for You? A Founder's Guide to the Asset Turnover Ratio
Learn to calculate and improve your asset turnover ratio. This guide offers actionable strategies for founders to boost efficiency and attract investors.
ByJumpstart Partners, CPA, QuickBooks ProAdvisor
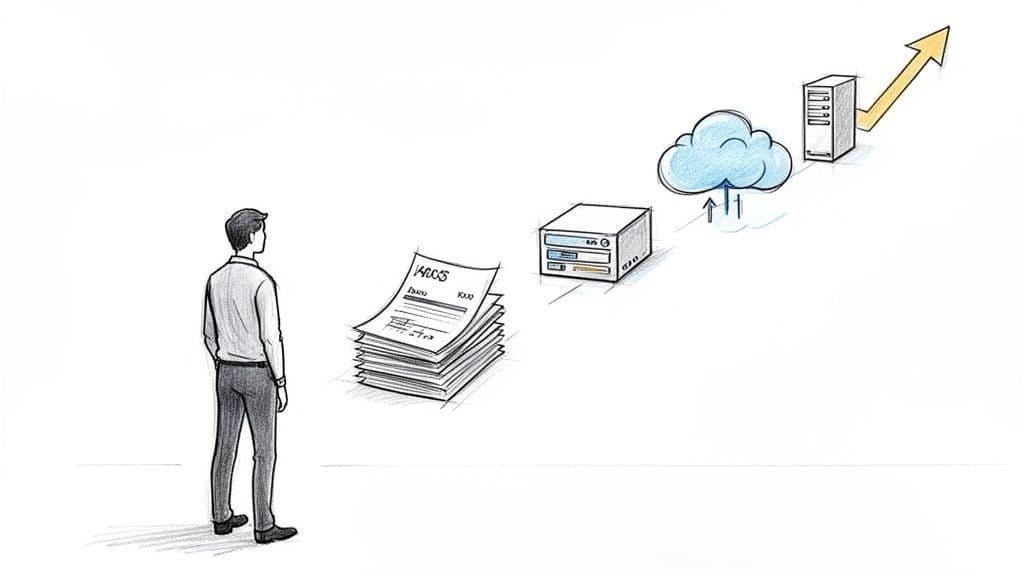
··20 min readEvery dollar tied up in your business—from uncollected invoices to idle software licenses—is either fueling your growth or slowing it down. The asset turnover ratio is the clearest measure of how efficiently you turn those investments into revenue.
for founders of growing SaaS or service businesses, a low ratio means your capital is underperforming. It's a drag on both your scalability and your cash flow, and it’s a problem you need to solve.
Your Assets Should Work Harder Than You Do
This isn't just another metric for your accountant; it's a direct reflection of your operational grip on the business. It tells investors, your board, and your leadership team just how effectively you deploy capital to generate sales.
A strong ratio signals a lean, scalable operation. A weak one is a red flag that demands immediate attention.
Think of your company's assets as a team of employees. Each one—from the cash in your bank account to your accounts receivable—has a job to do. The asset turnover ratio is their performance review. It answers one simple question: how much revenue is each dollar of your assets producing?
Why This Ratio Is Critical for SaaS and Service Businesses
for founders of SaaS companies, digital agencies, and professional services firms, understanding asset efficiency is absolutely critical. While your business model is asset-light compared to manufacturing, your assets are no less important.
They just look a little different:
- Accounts Receivable: Slow-paying clients are tying up cash that you could be reinvesting into growth.
- Software & Technology: Over-investment in tools that don't directly contribute to revenue creates a financial drag.
- Cash Reserves: Idle cash that isn't funding sales, marketing, or product development is an underperforming asset.
A low asset turnover ratio shows that your capital isn't working hard enough. This operational friction slows your growth and makes it harder to scale. In contrast, a high ratio proves you’re running a tight ship, squeezing maximum output from every resource you have.
"By comparing how the three components of ROE [Return on Equity] have changed over time for a given company, an analyst can learn how the company is executing its strategy across the dimensions of margin, efficiency, and leverage." — Suraj Srinivasan, Harvard Business School Professor
That concept of efficiency is exactly what the asset turnover ratio measures. It’s a core component of how well your company is executing its strategy.
The Strategic Impact on Your Business
Mastering this metric gives you a powerful lever for financial control. It moves the conversation beyond just top-line revenue and profitability to the underlying mechanics of your business engine. A company that actively monitors and improves its asset turnover is better positioned to:
- Attract Investment: Investors look for capital-efficient businesses that can scale without needing massive asset accumulation.
- Improve Cash Flow: By converting assets into revenue more quickly, you strengthen your cash position and extend your runway.
- Make Smarter Decisions: The ratio provides clear feedback on capital allocation, helping you decide whether to invest in new tech, hire more staff, or streamline operations.
This guide cuts through the financial jargon to give you a clear framework for calculating, interpreting, and improving this critical metric to accelerate your growth.
How to Calculate Your Asset Turnover Ratio
Before you can improve your asset efficiency, you need a reliable way to measure it. The calculation itself is simple, but the real skill is in pulling the right numbers from your financial statements and knowing what they mean. Think of this less as an accounting chore and more as building a performance barometer for your operations.
The formula for the asset turnover ratio is straightforward:
Asset Turnover Ratio = Net Sales / Average Total Assets
Let's break down where to find these two numbers and why the formula is set up this way.
Step 1: Find Your Net Sales
Your Net Sales figure sits at the top of your Income Statement. It’s your total revenue from core business activities after backing out any returns, allowances, or discounts. You want the pure, uninflated revenue your operations generated.
Using Net Sales ensures you’re measuring the direct output of your business engine. If you need a refresher on navigating your financials, check out our guide on how to read financial statements.
Step 2: Calculate Your Average Total Assets
Next up is Total Assets. You'll find this number on your Balance Sheet, and it represents everything your company owns—cash, accounts receivable, equipment, and even capitalized software.
But here’s a crucial detail: your asset levels can swing wildly throughout the year. A big equipment purchase or a successful collections push can skew the numbers. Using a single point in time will give you a distorted picture. To smooth out these peaks and valleys, you must calculate Average Total Assets.
The formula is just as simple:
Average Total Assets = (Total Assets at Beginning of Period + Total Assets at End of Period) / 2
This gives you a much more stable and accurate baseline to measure efficiency over a full quarter or year.
Worked Calculation Examples
Let's make this tangible with two real-world examples for different types of businesses.
Example 1: A SaaS Company
Imagine your software company has these financials for the year:
- Net Sales (from Income Statement): $3,000,000
- Total Assets (Start of Year): $1,800,000
- Total Assets (End of Year): $2,200,000
First, find the Average Total Assets:
- ($1,800,000 + $2,200,000) / 2 = $2,000,000
Now, plug the numbers into the asset turnover ratio formula:
- $3,000,000 / $2,000,000 = 1.5
This means for every dollar of assets your SaaS company holds, it generates $1.50 in revenue.
Example 2: A Digital Agency
Now let’s look at a professional services firm:
- Net Sales: $5,000,000
- Total Assets (Start of Year): $900,000
- Total Assets (End of Year): $1,100,000
Calculate the Average Total Assets:
- ($900,000 + $1,100,000) / 2 = $1,000,000
And then the ratio:
- $5,000,000 / $1,000,000 = 5.0
The agency generates a whopping $5.00 in revenue for every dollar of assets. This much higher ratio is typical for service businesses, which have a tiny asset base (mostly cash and receivables) compared to the revenue they can produce.
A Key Variation: The Fixed Asset Turnover Ratio
for a more focused look, you can also calculate the Fixed Asset Turnover Ratio. This version zeroes in on the efficiency of your long-term, tangible assets—things like property, vehicles, and heavy equipment. It tells you how well you're sweating the big-ticket items you’ve invested in.
The formula is:
Fixed Asset Turnover = Net Sales / Average Fixed Assets
This is incredibly useful for judging the return on major capital investments and making sure your core operational infrastructure is pulling its weight.
What Is a Good Asset Turnover Ratio?
Asking “What’s a good asset turnover ratio?” is like asking, “What’s a good speed?” The answer is completely different if you’re driving a Formula 1 car versus a cargo ship.
It’s a classic mistake to compare your SaaS company’s ratio to a manufacturer’s. You will end up with flawed conclusions every time. A “good” ratio is entirely relative. What signals incredible efficiency in one industry might reveal a dangerously under-invested business in another. Your goal isn't to chase some universal number, but to consistently outperform your direct competitors and improve your own metrics over time.
Industry Benchmarks Are All That Matter
The heart of the matter is simple: different businesses run on different assets. for an asset-light company like a SaaS firm or a digital agency, your key assets are cash, accounts receivable, and intellectual property.
But for capital-intensive businesses like manufacturing, assets mean factories and machinery. This fundamental difference is why a healthy asset turnover ratio in one sector looks completely different from another. You must benchmark your performance against businesses with a similar operational model.
As you can see, achieving a strong efficiency ratio means your sales must significantly outpace your assets. To see exactly where your business stands, use the table below.
Asset Turnover Ratio Benchmarks by Industry
| Industry | Low Ratio (Warning Sign) | Average Ratio (Healthy) | High Ratio (Excellent) |
|---|---|---|---|
| SaaS & Software | Below 0.75 | 1.0 - 2.0 | Above 2.0 |
| Professional Services | Below 2.0 | 2.5 - 4.5 | Above 5.0 |
| E-commerce & DTC | Below 1.5 | 1.8 - 3.0 | Above 3.5 |
| Manufacturing | Below 0.5 | 0.8 - 1.5 | Above 2.0 |
Source: Benchmarks compiled from industry reports, including OpenView's 2024 SaaS Benchmarks and analysis of public company financials.
As the table shows, a ratio of 1.5 is a fantastic sign of capital efficiency for a SaaS business. But for a digital agency, that same 1.5 is a major red flag, pointing to bloated overhead or poor project management. This metric is a key part of your overall financial story; explore our guide on other crucial financial KPIs for small businesses to see the bigger picture.
Interpreting Your Ratio
A SaaS company with a ratio above 1.0 is showing investors that it can scale revenue without needing a dollar-for-dollar increase in assets. It's a hallmark of a capital-efficient, product-led growth model. for agencies and professional services firms, a ratio north of 5.0 demonstrates incredible operational leverage. It proves you're masters at converting your primary asset—your team’s time and expertise—into substantial revenue.
The contrast with asset-heavy industries is stark. Take Goldman Sachs, which posted an asset turnover ratio of just 0.03 for fiscal year 2023. This is typical for financial institutions with massive asset bases, where they generate just a few cents of revenue for every dollar of assets. It’s worlds away from the 1.0x-2.0x that investors look for in a fund-ready SaaS company. You can dig into more data on asset-heavy company performance on AlphaQuery.com.
Your investors aren't just buying your product; they are investing in your operational model. A strong and improving asset turnover ratio is tangible proof that your model is built to scale efficiently.
Red Flags: When Your Asset Turnover Declines
The absolute number is just one part of the story. The trend over time is far more revealing. A consistently declining ratio is a serious warning sign that demands immediate attention.
Here are the red flags a falling asset turnover ratio is waving:
- Operational Friction: Your sales and marketing engine is hitting a snag, or your service delivery is becoming less efficient.
- Poor Capital Allocation: You’ve invested in assets—like new software, office space, or equipment—that aren't generating a proportional return in revenue.
- Worsening Accounts Receivable: Your clients are taking longer and longer to pay. This causes your AR balance (a major current asset) to swell without a corresponding increase in recognized revenue.
- Market Saturation or Decline: Your ability to generate sales from your existing asset base is weakening due to intense competition or shrinking demand.
A declining ratio over two or more consecutive quarters is a major concern for your board and potential investors. It suggests the business is becoming less efficient as it grows—the exact opposite of what a scalable company should demonstrate.
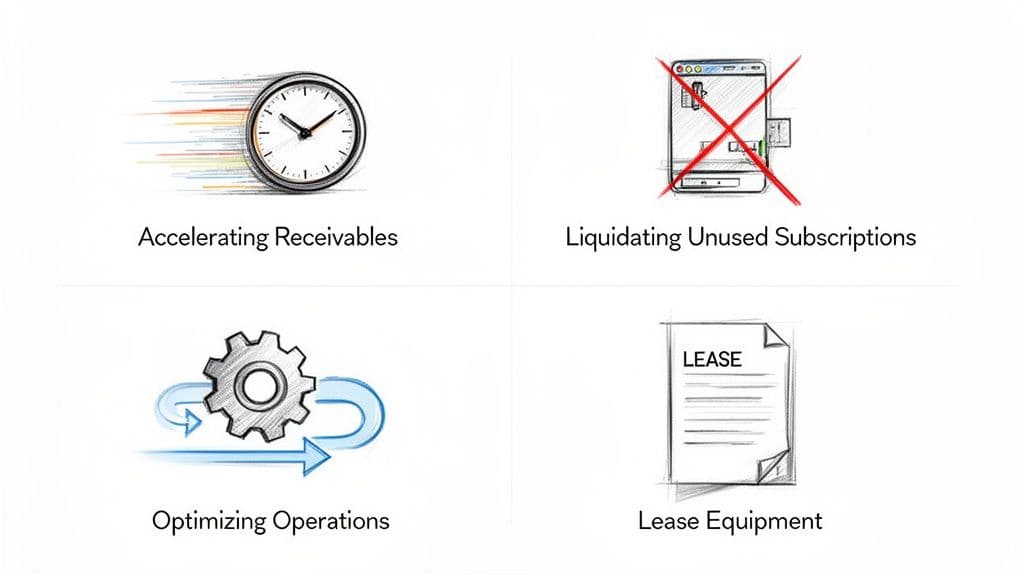
4 Actionable Strategies to Improve Your Asset Turnover
Improving your asset turnover ratio isn't an academic exercise—it's a direct path to healthier cash flow, stronger profits, and a much more compelling story for investors. It proves you’re a disciplined operator who knows how to make every single dollar count.
The good news is you have several powerful levers you can pull to turn things around. Here are four battle-tested strategies you can put into action right away.
1. Accelerate Your Cash Conversion Cycle
Your accounts receivable (AR) balance is one of the biggest current assets on your books. When clients pay slowly, that AR balance swells, bloating your total assets and dragging your turnover ratio down. You’ve earned the revenue, but the cash is still stuck on someone else's balance sheet.
Your Next Steps:
- Shorten Payment Terms: Ditch Net 30 for new clients and move to Net 15. This can dramatically shrink your average AR balance.
- Automate Collections: Set up an automated dunning system that sends polite but firm reminders for overdue invoices. This ensures follow-up never slips through the cracks.
- Incentivize Early Payments: Offer a small discount, like 2%, for invoices paid within 10 days. The cost of that discount is almost always less than the cost of having that capital tied up.
Aggressively managing AR doesn't just boost your asset turnover; it directly injects cash into your business, giving you more fuel for growth.
2. Liquidate Underperforming and Obsolete Assets
Every single asset on your balance sheet needs to justify its existence by helping you generate revenue. Anything that doesn't is just dead weight. for SaaS and service companies, this "asset bloat" often hides in digital or intangible forms.
Your Next Steps:
- Audit Software Subscriptions: Are you paying for 100 user licenses for a tool only 60 people actually use? Cancel the extra seats. That monthly expense is a cash drain.
- Sell Outdated Hardware: Those old laptops or servers sitting in a closet should be sold. Even a small sale trims your fixed asset base and cleans up your books.
- Write Off Zombie Projects: Have you capitalized development costs for a product feature that was abandoned months ago? It's time to write it off. Keeping it on the books artificially inflates your assets.
This isn’t just spring cleaning. It’s a strategic move to trim the fat from your asset base so your remaining, high-performing assets can truly shine.
3. Optimize Your Service Delivery and Resource Utilization
for professional services firms and agencies, your people are your primary revenue-generating assets. Making them more efficient has a direct and immediate impact on your ability to generate more sales from your existing cost structure. Optimizing your team's workflow is critical, which includes better tracking of agency resource utilization to boost profitability.
Your Next Steps:
- Track Billable vs. Non-Billable Hours: Identify where time is leaking and tighten up processes to maximize client-facing work.
- Standardize Workflows: Create templates and playbooks for common projects to reduce setup time and improve consistency.
- Invest in Project Management Tools: Use software that gives you clear visibility into project timelines, resource allocation, and budget burn.
4. Lease Major Assets Instead of Buying
When you need significant equipment—like high-end servers for a SaaS company—the default move is often to buy it. But that purchase adds a large fixed asset to your balance sheet, which can depress your turnover ratio for years. Leasing offers a much more capital-efficient path.
By leasing, you get the full revenue-generating benefit of the asset without carrying its full value on your balance sheet. This keeps your asset base lean and your turnover ratio high, signaling operational agility to investors.
Look at this comparison for a $100,000 server array:
| Metric | Buy Option | Lease Option |
|---|---|---|
| Upfront Cash Outlay | $100,000 | $5,000 (First Month + Deposit) |
| Balance Sheet Impact | +$100,000 in Fixed Assets | $0 (Expense on P&L) |
| Impact on Ratio | Lowers Asset Turnover | No Negative Impact |
The decision to lease versus buy is a strategic one. for assets that depreciate quickly or need frequent upgrades, leasing is almost always the smarter choice for maintaining a high-efficiency financial model.
Avoiding Common Mistakes with This Ratio
The asset turnover ratio is an incredibly insightful metric, but like any single data point, it can lead you down the wrong path if you look at it in a vacuum. Misinterpreting this number can lead to seriously flawed strategic decisions. One of the most dangerous traps is the misconception that a higher ratio is always better.
Misconception: A Sky-High Ratio is Always Good
An extremely high ratio doesn't always signal peak efficiency. In fact, it often means you’re dangerously underinvested in the core assets your business needs to grow over the long haul. You might be squeezing every last drop of revenue from an aging and inadequate asset base.
This can show up in a few painful ways:
- Outdated Technology: You’re running on old servers or clunky software that’s dragging down productivity and is one crash away from disaster.
- Neglected Infrastructure: Your team doesn't have the right equipment to do their best work, leading to frustration, burnout, and operational bottlenecks.
- Inability to Scale: When that big opportunity finally lands, you simply don't have the operational capacity to meet the demand. Growth stalls.
A lean operation is smart. A starved one is brittle. Pushing the ratio sky-high by putting off critical investments sacrifices future growth for the illusion of short-term efficiency.
"A company might achieve high turnover by selling products at break-even prices, or by using aging equipment that will soon require replacement." — Billy Cassano, Applications Engineer at Tractian
This quote gets right to the heart of it—the ratio itself doesn't say anything about profitability or the health of your assets. It’s a measure of volume and speed, not sustainability.
The Context of Other Metrics
To get the full story, you must pair the asset turnover ratio with other financial metrics. Think of it like a system of checks and balances that prevents you from over-indexing on a single number. The most important pairing is with your profitability ratios.
Here’s how you can build a much more robust analysis:
| Metric | What It Measures | Why It Matters |
|---|---|---|
| Asset Turnover Ratio | How efficiently assets generate sales. | Operational Speed |
| Net Profit Margin | How much profit is made per dollar of sales. | Profitability |
| Return on Assets (ROA) | How much profit is made per dollar of assets. | Overall Efficiency |
When you look at these metrics together, the picture becomes crystal clear. A high asset turnover paired with a razor-thin profit margin means you’re running really fast just to stand still—a precarious position.
Your ultimate goal is a healthy Return on Assets (ROA), which is the product of your turnover and your margin. Of course, this holistic view only works if your financials are accurate. If your books are a mess, all of your ratios will be garbage-in, garbage-out. Learn more about getting your data in order with our guide to fixing messy books with a QuickBooks cleanup.
Drive Your Asset Efficiency with an Expert Financial Partner
Fixing your asset turnover ratio isn’t just about knowing the formula. It takes operational discipline, and that discipline runs on precise, timely financial data. That's where an expert financial partner comes in—we build the systems you need to actually make it happen.
We deliver investor-ready financials with a guaranteed 5-day month-end close, giving you a faster feedback loop on your performance. Speed is critical. It lets you see the impact of your changes in near real-time, not three months later when it’s too late to adjust.
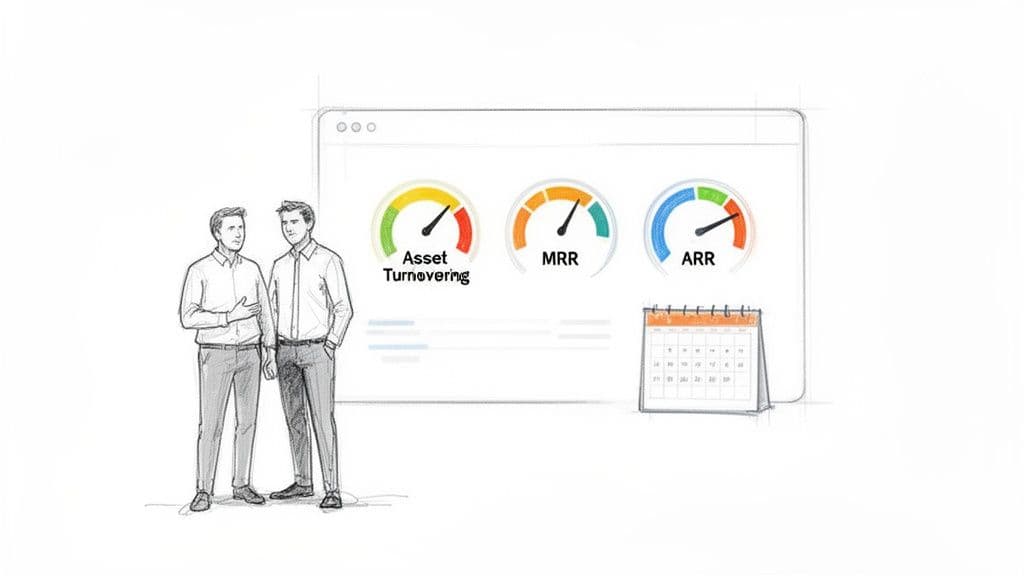
Get Real-Time Control Over Your Metrics
You can't actively manage your asset turnover ratio if you only look at it once a quarter. We build and maintain custom KPI dashboards that put your asset efficiency right next to core metrics like MRR, ARR, and client profitability.
This integrated view lets you connect the dots between your decisions and your financial reality. You can see exactly how tightening up your collections process impacts your cash balance or how a new software license affects your total asset base.
Our streamlined workflows for accounts payable and revenue recognition are designed to unlock cash and directly boost your turnover. We automate invoicing, clean up your AR aging report, and ensure you recognize revenue according to ASC 606 standards—keeping your balance sheet clean and your metrics trustworthy.
Trade Spreadsheets for Strategic Growth
for founders and CEOs, this means getting out of the spreadsheet mines and back to focusing on strategy. You get the confidence that comes from knowing your financials are guaranteed for accuracy, managed by a team that understands the nuances of your business model.
An expert financial partner doesn’t just report the numbers—they build the financial system that lets you actively improve them. This turns financial data from a historical report card into a forward-looking tool for driving efficiency.
Getting this level of financial leadership right is crucial as you scale. Deciding on the best fit can be a challenge, which is why our guide comparing a fractional CFO vs. a full-time CFO can help you map the right expertise to your current stage.
Ready to see how a dedicated finance partner can put your asset efficiency plan into action? Schedule a consultation with Jumpstart Partners today.
Common Questions About the Asset Turnover Ratio
Even after you get the hang of the formula, it’s natural to have questions about how the asset turnover ratio really works in practice. Here are the most common ones we hear from founders and CEOs.
How often should I calculate my asset turnover ratio?
You should calculate your asset turnover ratio at least quarterly. for businesses where things change fast—like a SaaS company scaling quickly or an agency with project-based revenue—monthly is far better. Consistent, frequent tracking is the only way to spot a negative trend before it snowballs. A small dip in efficiency is much easier to correct than a major problem that spooks investors or torches your cash runway. This metric belongs in your standard monthly financial reporting package, no exceptions.
Can a company have a high asset turnover ratio and still be unprofitable?
Absolutely. This is a huge misconception. A high asset turnover ratio only proves one thing: you’re good at generating revenue from your asset base. It says absolutely nothing about your profitability. You could be churning out services at a massive volume, but if your pricing is wrong or your operating costs are out of control, you could be losing money on every single project. This is precisely why you must analyze asset turnover alongside profitability metrics like net profit margin and Return on Assets (ROA).
What is the difference between asset turnover and inventory turnover?
While they sound related, these two ratios answer fundamentally different strategic questions.
- Asset Turnover gives you the big-picture view. It measures how efficiently you use all your company's assets—cash, receivables, equipment, even intellectual property—to generate sales. It is a key indicator of overall capital efficiency.
- Inventory Turnover is a specialist. It’s a specific metric that measures how quickly you sell and replace your physical inventory.
for a SaaS company or a service-based agency, asset turnover is a core metric. Inventory turnover, on the other hand, is almost entirely irrelevant. That metric is critical for businesses that hold physical stock, like e‑commerce brands and retailers.
Ready to transform your asset efficiency from a historical number into a strategic growth lever? Jumpstart Partners provides the expert financial oversight to build the systems, dashboards, and operational discipline you need. Schedule a free consultation today and see how we deliver investor-ready financials with a 5-day close.
Article created using Outrank