Financial Operations
How a 13-Week Cash Flow Forecast Stops You From Flying Blind
13 week cash flow forecast: Learn to predict cash needs, cut surprises, and drive smarter growth for your business.
ByJumpstart Partners, CPA, QuickBooks ProAdvisor
··24 min readA 13-week cash flow forecast is a rolling, week-by-week financial plan that maps out every dollar coming in and going out of your business for the next quarter. It’s the single most important tool for managing your company's liquidity, giving you a real, ground-level view of your future cash position.
Why Your Business Needs a 13-Week Cash Flow Forecast
Trying to run your business from a monthly P&L statement is like driving a car by only looking in the rearview mirror. It tells you where you’ve been—profitability last month—but it’s completely blind to the road ahead.
For a SaaS, digital agency, or professional services firm, that lag is dangerous. The weekly reality of making payroll, chasing invoices, and covering surprise expenses demands a tool that looks forward, not backward. This is where the 13-week cash flow forecast becomes your financial command center. It’s not an accounting exercise; it’s your operational roadmap for the next quarter. It provides the clarity to move from reactive fire-fighting to proactive, strategic leadership.
See Around Corners
The real power of this forecast is its ability to predict the future. The 13-week cash flow model has become the gold standard because it enables you to manage cash before it becomes a problem. Finance teams using this framework spot potential cash shortfalls 8-10 weeks before they become operational crises, giving you precious time to act.
This foresight changes everything about how you lead:
- Hire with confidence. See a strong cash position three months out? You bring on that key engineer or salesperson with conviction instead of anxiety.
- Make strategic bets. Wondering if you can afford that new marketing channel or critical piece of software? The forecast gives you a data-backed answer, not a gut feeling.
- Negotiate from strength. Knowing your exact cash balance in six weeks gives you the leverage to ask for better payment terms with vendors or offer early-pay discounts to clients.
A Real-World Scenario
Imagine your SaaS company is weighing whether to hire a new senior developer—a major investment. Your P&L from last month shows you were profitable, but your bank balance feels a little tight.
A 13-week forecast models the precise weekly impact of that hire. You plug in the new salary and payroll taxes, watching them hit your cash balance each week. At the same time, you project cash coming in from new subscriptions and payments from existing customers.
The forecast reveals a temporary cash dip in week seven that your P&L would completely miss. This insight allows you to delay the hire by a month or push your team to accelerate collections to cover the gap. You can learn more about how to manage these metrics in our complete guide to calculating your burn rate and runway.
This is the granular, week-by-week visibility that separates successful scaling from a sudden, unexpected cash crisis. It's the tool that puts you back in control.
Assembling Your First Cash Flow Forecast
Let’s move from theory to action. Building your first 13 week cash flow forecast isn't an abstract accounting exercise; it’s about pulling real, operational data from the systems you already use—QuickBooks, Xero, Stripe, and your CRM.
The whole point is to create a baseline forecast that shows how your business actually operates, not how you wish it would. That means digging into the nitty-gritty of your cash inflows and outflows with realistic assumptions grounded in what’s actually happened in the past.
This process chart breaks down the fundamental flow: you map expected cash coming in against the cash going out to figure out your weekly cash position.
Visualizing this cycle reinforces that forecasting is a continuous loop. You project, you measure, and then you refine. It’s how you maintain a clear view of your future liquidity.
Projecting Your Cash Inflows
The accuracy of your entire forecast hinges on realistic cash receipt projections. This is where so many leaders make a crucial mistake: they plug in revenue numbers from their P&L instead of modeling actual cash collection patterns. A signed contract is great, but it’s not cash in the bank.
To get this right, pull your accounts receivable (AR) aging report from QuickBooks or Xero. This report is your ground zero for modeling when you’ll actually get paid.
“The number one mistake founders make is equating sales with cash. Your cash flow forecast forces you to confront the reality of payment cycles. A sale in January might not become cash until March, and your forecast must reflect that lag to be useful.” – David Worrell, Principal at Fuse Financial Partners
For example, instead of just assuming all your invoices get paid on Net 30 terms, go back and analyze your past performance. You find a pattern for your digital agency that looks something like this:
- 60% of invoices are paid within 30 days.
- 30% are paid between 31 and 45 days.
- 10% stretch out to 60+ days and require you to actively chase them down.
Applying this logic creates a much more reliable inflow projection. If you have $100,000 in open AR due in the next 30 days, your model projects $60,000 arriving on time, not the full amount. This shift from optimistic to realistic forecasting is everything.
Modeling Your Cash Outflows
Good news: outflows are usually easier to predict than inflows because so many of them are fixed or recurring. The key here is to be exhaustive. You need to capture everything, from the big-ticket items like payroll down to the smaller, easily forgotten costs.
Start by listing out your recurring expenses and when they typically hit your bank account:
- Payroll: This is your largest and least flexible outflow. Don't just budget for net pay. A proper forecast includes gross wages, employer payroll taxes (FICA, FUTA, SUTA), health insurance premiums, and any 401(k) contributions.
- Rent/Mortgage: Usually a fixed payment, typically due on the 1st of the month.
- Software Subscriptions: Compile a list of all your SaaS tools (e.g., Salesforce, Slack, AWS) and their monthly or annual billing dates.
- Loan Payments: Principal and interest payments that are fixed and predictable.
- Vendor Payments: Use your accounts payable (AP) aging report to schedule payments based on due dates and your available cash.
Let’s run a quick calculation for a bi-weekly payroll of $50,000 in gross wages. The cash outflow isn't just $50,000. A more accurate projection looks like this:
- Gross Wages: $50,000
- Employer Payroll Taxes (approx. 8%): $4,000
- Employee Benefits (Health/401k Match): $6,000
- Total Payroll Cash Outflow: $60,000
That $10,000 difference is exactly the kind of detail that separates a wild guess from a reliable financial tool.
Putting It All Together
Once you have your inflows and outflows mapped out week by week, you calculate your net cash flow and ending cash position. The formula is simple: Opening Cash Balance + Total Inflows - Total Outflows = Closing Cash Balance.
The closing balance of Week 1 becomes the opening balance for Week 2, creating your rolling forecast.
Here is a simplified example of how the calculation works week over week for a professional services firm.
Sample 13 Week Cash Flow Forecast Calculation
| Category | Week 1 | Week 2 | Week 3 | ... |
|---|---|---|---|---|
| Opening Cash Balance | $50,000 | $60,000 | $94,000 | ... |
| Cash Inflows | ||||
| AR Collections | $75,000 | $45,000 | $80,000 | ... |
| New Project Deposits | $10,000 | $0 | $15,000 | ... |
| Total Inflows | $85,000 | $45,000 | $95,000 | ... |
| Cash Outflows | ||||
| Payroll & Taxes | $60,000 | $0 | $60,000 | ... |
| Rent | $5,000 | $0 | $0 | ... |
| Software Subscriptions | $1,000 | $1,000 | $1,000 | ... |
| Vendor Payments | $8,000 | $10,000 | $12,000 | ... |
| Marketing Spend | $1,000 | $0 | $2,000 | ... |
| Total Outflows | $75,000 | $11,000 | $75,000 | ... |
| Net Cash Flow | $10,000 | $34,000 | $20,000 | ... |
| Closing Cash Balance | $60,000 | $94,000 | $114,000 | ... |
As you can see, even in a profitable scenario, the timing of large outflows like payroll causes significant swings in the weekly cash balance. This is exactly the kind of insight the forecast is designed to provide.
This discipline pays off. Companies that implement a rolling 13-week cash flow forecast see an average 20% improvement in cash visibility and a 15% reduction in unexpected cash shortages. For a growing business, that level of clarity isn't a nice-to-have; it's a competitive advantage.
You can learn more about the strategic benefits in our guide to cash flow forecasting for small businesses.
Putting Your Forecast to Work as a Strategic Tool
A forecast gathering dust in a folder is worthless. The real magic happens when your 13-week cash flow forecast becomes a living, breathing tool that drives your weekly decisions. This is the leap from just tracking cash to making strategic moves with confidence, turning financial data into a real competitive advantage.
The foundation of this strategic rhythm is a weekly variance analysis. Every Monday morning, your first order of business is reconciling last week’s forecast against your actual bank data. Where did you nail the numbers, and where were you off? This isn’t about pointing fingers; it’s about sharpening your assumptions for the future.
The Power of Variance Analysis
Variance analysis is just a disciplined way of comparing what you thought would happen to what actually happened. The goal is to understand why the numbers differed so you can make your future projections that much sharper.
Let’s say you forecasted $25,000 in customer collections for Week 4, but only $15,000 actually hit the bank. That $10,000 variance isn't just a number; it’s a story. Did a major client’s payment get delayed? Was your initial assumption about their payment speed too optimistic?
Answering those questions lets you adjust the timing for that client's future payments in your model, instantly making the next 12 weeks of your forecast more reliable. Doing this review every single week is the most effective thing you can do to improve forecast accuracy. You can take this a step further by checking out our insights on automating your financial reporting.
Stress-Testing Your Business with Scenario Planning
Once you have a baseline forecast you can trust, you can start asking powerful "what-if" questions. This is scenario planning, and it's how you test your company’s financial resilience before a crisis hits. Your goal here is to model a few distinct possibilities.
“Forecasting isn’t about predicting the future; it's about preparing for it. Scenario planning within a 13-week cash flow model allows you to quantify risks and opportunities, turning anxiety about the unknown into a concrete action plan.” – Anonymous, Fractional CFO
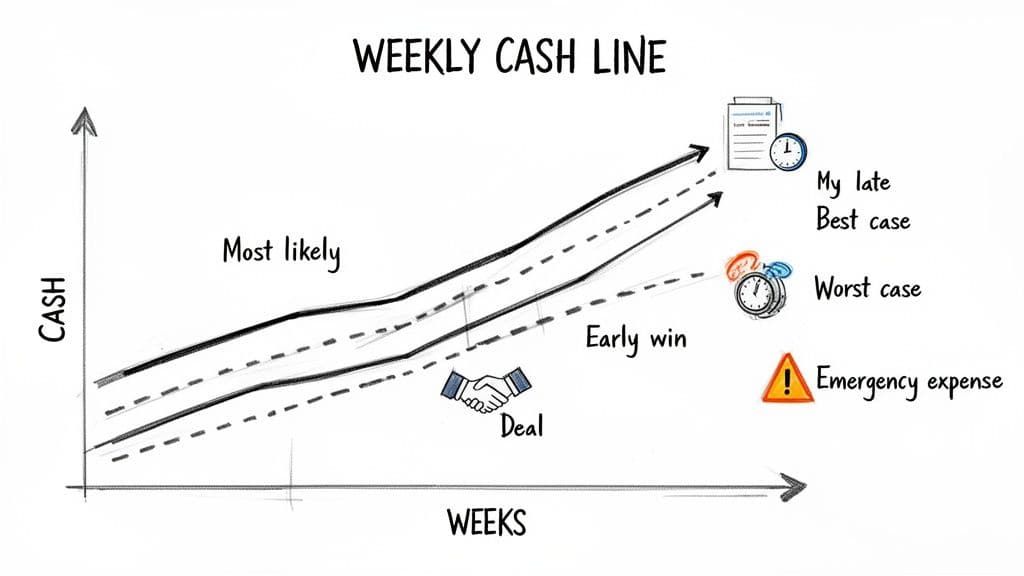
You need to build out at least three versions of your forecast:
- Most Likely Case: This is your baseline, using your most realistic assumptions.
- Best Case: What happens if you close that huge deal two weeks early? Or a new marketing campaign wildly overperforms? Model the cash impact.
- Worst Case: This is the most critical one. What happens if your largest client pays 30 days late? What if you lose a key customer altogether?
Let's walk through a tangible example for a digital agency.
A Worked Scenario Analysis Example
Your agency's 'Most Likely' forecast shows a healthy cash balance for the next quarter. Great. Now, let’s model a 'Worst Case' scenario where your biggest client, who pays $40,000 per month, is 30 days late on their next two payments.
Worst Case Scenario Impact:
| Week | Most Likely Inflow | Worst Case Inflow | Cash Impact |
|---|---|---|---|
| Week 5 | $40,000 | $0 | -$40,000 |
| Week 9 | $40,000 | $0 | -$40,000 |
By simply shifting those two payments, your forecast might suddenly reveal a cash crunch in Week 10 where you dip below the minimum balance required to make payroll. Seeing this today gives you six weeks to react.
Suddenly, you have an action plan:
- Offer a 5% early-pay discount to a few other reliable clients to pull some cash forward.
- Proactively draw $50,000 from your line of credit in Week 9 just to be safe.
- Delay a non-essential $15,000 software purchase until the following month.
This proactive approach is the entire point of a 13-week cash flow forecast. It gives you the time and data to navigate challenges smoothly instead of getting blindsided. This is how you build a resilient, adaptable business that can thrive no matter what gets thrown at it.
Organizations that truly master this discipline see remarkable results. They often achieve accuracy targets between 85-90% for near-term receivables and 80-85% for operational expenses. This statistical edge becomes invaluable when preparing for fundraising, as investors increasingly demand proof of sophisticated cash management. You can discover more insights about forecasting accuracy and its impact on strategic decisions.
Common Forecasting Mistakes and How to Avoid Them
Even the sharpest founders fall into a few classic traps when building their first 13-week cash flow forecast. A solid forecast is an incredible asset for decision-making. But one built on flawed assumptions? It's worse than useless—it's actively misleading. Spotting these pitfalls is the first step to building a model you can actually trust.
Objection 1: "My P&L is profitable, so I don't need this."
The biggest and most dangerous mistake is confusing profit with cash. Your P&L might show a killer month, but profit is an accounting concept, not a reflection of your bank balance. A signed $100,000 contract is great for your revenue goals, but it’s not cash you can spend on payroll until the invoice is actually paid.
Your forecast must be built on the timing of cash hitting your bank account, not on accrual-based revenue. Get this wrong, and you’ll create a dangerously optimistic view of your runway that shatters the moment a big payment comes in late.
Objection 2: "My business is too unpredictable to forecast."
Another classic error is building your cash-in projections on pure hope. You hope that big enterprise deal closes next week. You hope clients start paying on Net 30 terms. Hope is not a cash management strategy.
Your forecast’s assumptions must be grounded in the cold, hard data from your CRM and accounting system.
- Sales Projections: Don't plug in your sales team's rosiest pipeline number. Use a weighted forecast based on historical close rates. If you know you typically close 25% of deals in the final stage, that's the number you model—not the full 100%.
- A/R Collections: Stop assuming every client pays on time. Pull an AR aging report and calculate your actual average days sales outstanding (DSO). If your average DSO is 48 days, that's the number you use, even if your invoices say Net 30.
“Founders are optimists by nature, which is a great trait for building a company but a terrible one for cash forecasting. Your forecast should be your most brutally honest financial advisor. It needs to reflect the world as it is, not as you wish it to be.” – Anonymous, Fractional CFO
Objection 3: "I already have a budget, isn't that enough?"
It’s easy to remember the steady monthly expenses like rent and software subscriptions. The costs that absolutely wreck forecasts are the lumpy, non-obvious outflows that only hit once a quarter or once a year. These are the surprise withdrawals that can suddenly sink you.
Get exhaustive when you map out these less frequent but significant payments:
- Quarterly Tax Payments: Estimated federal and state taxes are a huge cash drain that must be planned for.
- Annual Insurance Premiums: Your general liability, E&O, or health insurance renewal often comes as one giant payment.
- Bonus Payouts: Annual or semi-annual performance bonuses can create a massive payroll outflow.
- Annual Software Renewals: That major SaaS platform you pay for annually is incredibly easy to forget in a weekly model.
Forgetting a $20,000 annual insurance premium due in Week 7 can turn a healthy cash projection into a serious deficit overnight. A great trick here is to review the last 12 months of your bank statements to catch all these irregular payments and get them on the calendar. This kind of detailed review helps you avoid the pain of a negative variance, a process we cover in our guide to budget variance analysis.
Red Flags to Watch for in Your Forecast
Once your forecast is built, you need to know how to spot trouble brewing under the surface. A perfect-looking spreadsheet can easily hide underlying risks. Here are the key warning signs to look for every single week:
| Red Flag | What It Means | Action to Take |
|---|---|---|
| Consistently Declining Cash Balance | Your burn rate is unsustainable, and you're on a direct path to running out of money. | Immediately model cost-cutting scenarios or find ways to accelerate sales and collections. |
| High Dependency on One Client | Your cash flow is dangerously vulnerable to a single late or lost payment. | Focus on diversifying your client base and run a "worst-case" scenario where that client pays late. |
| Runway Shorter than 6 Months | You have very limited time to hit profitability or lock in new funding. | This triggers immediate, serious conversations about fundraising or drastic expense reductions. |
| AR Balance Growing Faster than Revenue | You're making sales, but your collections process is broken, trapping cash in unpaid invoices. | Implement a more aggressive collections process and re-evaluate the credit terms you offer customers. |
Presenting Your Forecast to Investors and Lenders
A rock-solid 13 week cash flow forecast is one of the most powerful tools you have when talking to investors or lenders. It shifts the conversation from high-level revenue dreams to the ground-level reality of your company's financial pulse. This isn't just about showing numbers; it's about proving you have a firm grip on the wheel.
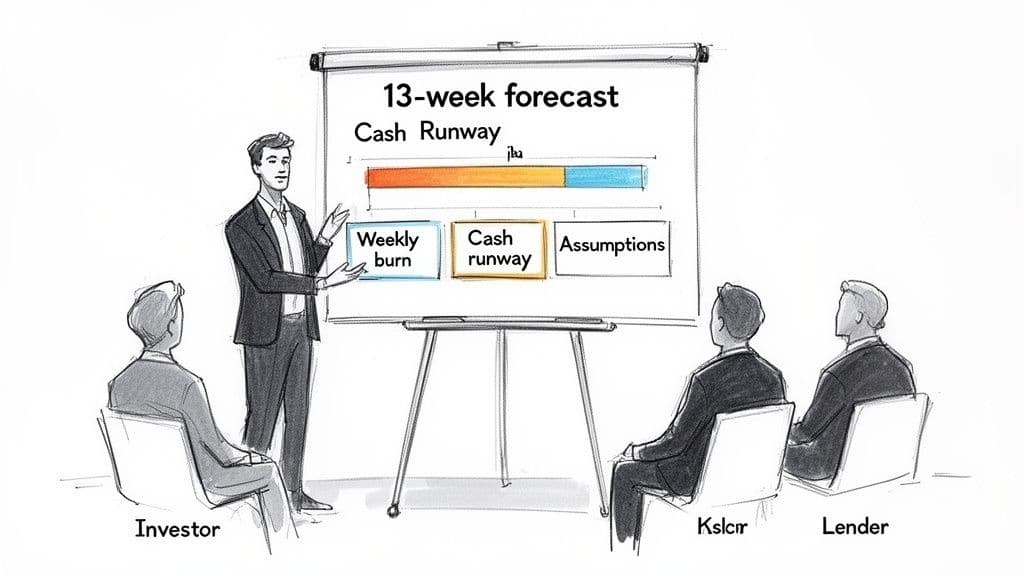
When you present this forecast with authority, you prove you're not just managing the business month-to-month—you're actively steering it week-by-week. It directly answers the questions that keep stakeholders up at night: Do you have enough cash to actually execute your plan? And have you stress-tested your assumptions?
Frame the Narrative Around Key Metrics
When you walk into that boardroom or a meeting with a lender, they don't want a line-by-line tour of your spreadsheet. They need the high-level summary that tells them, in 60 seconds, whether the business is stable. Your job is to focus their attention on the metrics that matter most.
“Sophisticated investors don't just invest in a great idea; they invest in great operators. A detailed 13-week cash flow forecast is the best evidence you can provide that you have a firm grip on the operational realities of your business.” – Anonymous, Venture Capital Partner
Build your entire presentation around a few critical KPIs that your forecast brings to life. These metrics give a clear, immediate snapshot of your company's financial future. For a deeper dive into what investors are looking for, check out our guide on essential investor reporting for startups.
When presenting, distill the dense data of your forecast into a handful of easy-to-digest metrics. Here are the big ones stakeholders will zero in on.
Key Metrics for Stakeholder Reporting
| Metric | What It Tells Stakeholders | Industry Benchmark (SaaS/Services) |
|---|---|---|
| Cash Runway | The number of months you can operate before running out of money, based on your current cash balance and average net burn. | Healthy, venture-backed companies aim for 12-18 months of runway. Less than 6 months is a serious red flag. |
| Weekly Net Burn | The average weekly rate at which you are spending cash (Outflows - Inflows). This shows the raw speed of your cash consumption. | According to OpenView's 2024 benchmarks, a net burn of less than 25% of revenue is considered efficient for growth-stage SaaS. |
| Cash Conversion Cycle | The time it takes to convert your investments in sales and services into cash in the bank. A shorter cycle means greater capital efficiency. | Top-quartile professional services firms often achieve a CCC of under 30 days. |
These KPIs provide the "so what" of your forecast, allowing you to tell a compelling story about your financial health and operational discipline.
Defend Your Assumptions with Data
The numbers themselves are secondary. The most important part of your presentation is the logic behind the numbers. Stakeholders are trained to poke holes in assumptions that feel like they're based on hope rather than history. You have to be ready.
- For Inflows: Don’t just say, "We expect to collect $100K in Week 3." Instead, show your work. "Our collection forecast is based on our historical AR aging, which shows we consistently collect 70% of invoices within 30 days. We've applied that rate to our current AR balance."
- For Outflows: When they ask about a big expense like payroll, get granular. "Our payroll projection includes gross wages, the 7.65% employer FICA burden, and our average monthly healthcare contribution of $12,000."
This level of detail preempts their questions and builds massive confidence. It proves your forecast is a real management tool, not just a document you made for a fundraising pitch.
Lead with Your Scenario Analysis
Finally, never present just your "most likely" case. The mark of a mature, strategic leader is proactively walking stakeholders through your best-case and worst-case scenarios. It shows you aren't operating with blind optimism—you have contingency plans.
Frame it directly. "Here is our base forecast. Now, let me show you what happens if our largest client pays 30 days late."
Then, immediately pivot to your solution. "In that scenario, you can see our cash dips in Week 8. That's why we have a plan to draw $50,000 from our line of credit and delay a $20,000 capital expenditure to ensure we maintain a healthy buffer."
This approach demonstrates you’ve not only identified the risks but have already built a clear action plan to handle them. It’s the ultimate confidence-builder and the key to turning your 13 week cash flow forecast into a winning pitch.
How to Finally Gain Control of Your Cash Flow
You have the complete blueprint. This isn't just financial theory; it's a tactical tool for making smarter, faster decisions about who to hire, where to spend, and when to push for growth. It’s about replacing gut feelings with hard data.
But knowing is one thing, and doing is another. Building this forecast takes discipline. Here is your action plan to get from reading this article to controlling your cash flow.
Your Four-Week Action Plan
| Step | Action Item |
|---|---|
| Week 1: Gather Your Intel. | Pull your Accounts Receivable and Accounts Payable aging reports from your accounting system. Map out every recurring expense, including payroll with all taxes and benefits. |
| Week 2: Build Your First Draft. | Create your initial 13-week model. Ground every assumption in historical data, not optimism. Focus on real-world cash collection patterns. |
| Week 3: Stress-Test Everything. | Run scenarios: best-case, worst-case, and most-likely. What happens if your biggest client pays 30 days late? Or if a key deal slips a month? Identify your biggest risks. |
| Week 4 & Beyond: Find Your Rhythm. | Start the weekly reconciliation process. Compare your forecast to your actual bank data, understand the variances, and use those insights to sharpen your assumptions for the weeks ahead. |
When You Need an Expert on Your Team
Seeing the value in a forecast is easy. Finding the time and in-house expertise to build and maintain one while also running a company? That’s the hard part. Most founders are buried in day-to-day operations and can't dedicate the focused hours this critical financial work demands.
That’s exactly why we created our 13-Week Cash Flow Sprint.
Our US-based, CPA-certified team builds a custom, fully integrated forecast for your business in a single fixed-fee project. We handle the entire setup—from pulling and cleaning data from QuickBooks and Stripe to building out the specific scenarios that matter to your business. We deliver the clarity you need to scale with confidence, without the guesswork.
If you’re ready to get complete control over your cash and make growth a choice, not a gamble, let’s talk.
Schedule a Consultation Today to Get Your Custom Cash Flow Forecast
Got Questions? We've Got Answers
Even with the best template, you're bound to have questions when you start digging in. Here are the most common ones we hear from founders implementing a 13-week cash flow forecast for the first time.
How Is This Different From My P&L or Budget?
Think of it this way: your P&L (Profit and Loss) statement tells you if you were profitable last month, and your budget tells you what you planned to spend for the year. Neither tells you if you’ll have enough cash to make payroll next Tuesday.
A P&L is based on accrual accounting, which ignores the actual timing of when cash hits your bank. A budget is a static, high-level annual plan.
The 13-week cash flow forecast is a tactical, real-time tool. It tracks actual cash moving in and out of your bank account, week by week. It’s the only report that directly answers the most critical question in a growing business: "Do we have enough cash to cover our bills next month?"
How Much Time Will This Take Each Week?
Once you have the initial forecast built, the weekly update isn't a major time-suck. For a business in the $1M-$10M revenue range, you should block out one to two hours a week.
This isn't just mindless data entry. That hour or two is for reconciling last week's actuals, digging into why you were over or under forecast, and fine-tuning your assumptions for the coming weeks. This weekly rhythm is what turns the forecast from a spreadsheet into your most powerful decision-making tool.
What’s the Best Tool for Building This?
For most companies, the best tool is the one you already have: a well-structured spreadsheet like Google Sheets or Microsoft Excel. It’s flexible, free, and forces you to understand the mechanics.
Don't fall for the trap of jumping straight into complex FP&A software. You'll spend more time fighting the tool than managing your cash. Master the process in a spreadsheet first. Once you have a disciplined weekly process and your needs genuinely outgrow its capabilities, then you can look at more specialized tools.
At Jumpstart Partners, we live and breathe this stuff. If you want the strategic clarity of a rolling cash forecast without adding more to your plate, our 13-Week Cash Flow Sprint is your answer. We build and maintain a custom, investor-ready forecast to give you total control over your cash.
Schedule a free consultation to see how we can help.