Financial Operations
A Founder's Guide to Accounting for Manufacturing
Master accounting for manufacturing with our guide on COGS, costing methods, and KPIs. Get actionable steps to improve profitability and cash flow.
ByJumpstart Partners, CPA, QuickBooks ProAdvisor
··22 min readAs a founder of a growing manufacturing company, you're likely making critical decisions based on financial data that's fundamentally broken. A standard P&L statement simply isn't built for the realities of production, forcing you to guess your true costs, misprice products, and risk cash shortages even when sales are strong.
Why Standard Accounting Fails Manufacturers
If you’re running your manufacturing business on the same accounting system as a software company or a digital agency, you are flying blind. Standard financial reports treat your business like a simple "buy and sell" operation. They completely ignore the complex value creation happening on your factory floor, hiding costly inefficiencies and leading to disastrous strategic moves.
The problem? A generic P&L statement mashes all your production costs into a single, useless number. It can’t tell the difference between money tied up in raw materials, the value locked into half-built products, and the cost of inventory sitting in your warehouse, ready to ship.
"Most founders make the mistake of thinking all accounting is the same. For a manufacturer, a standard P&L is like a rearview mirror covered in mud—it tells you where you’ve been, but not clearly, and it offers zero guidance on the road ahead. Manufacturing accounting, done right, is your GPS." — CPA & Fractional CFO Expert
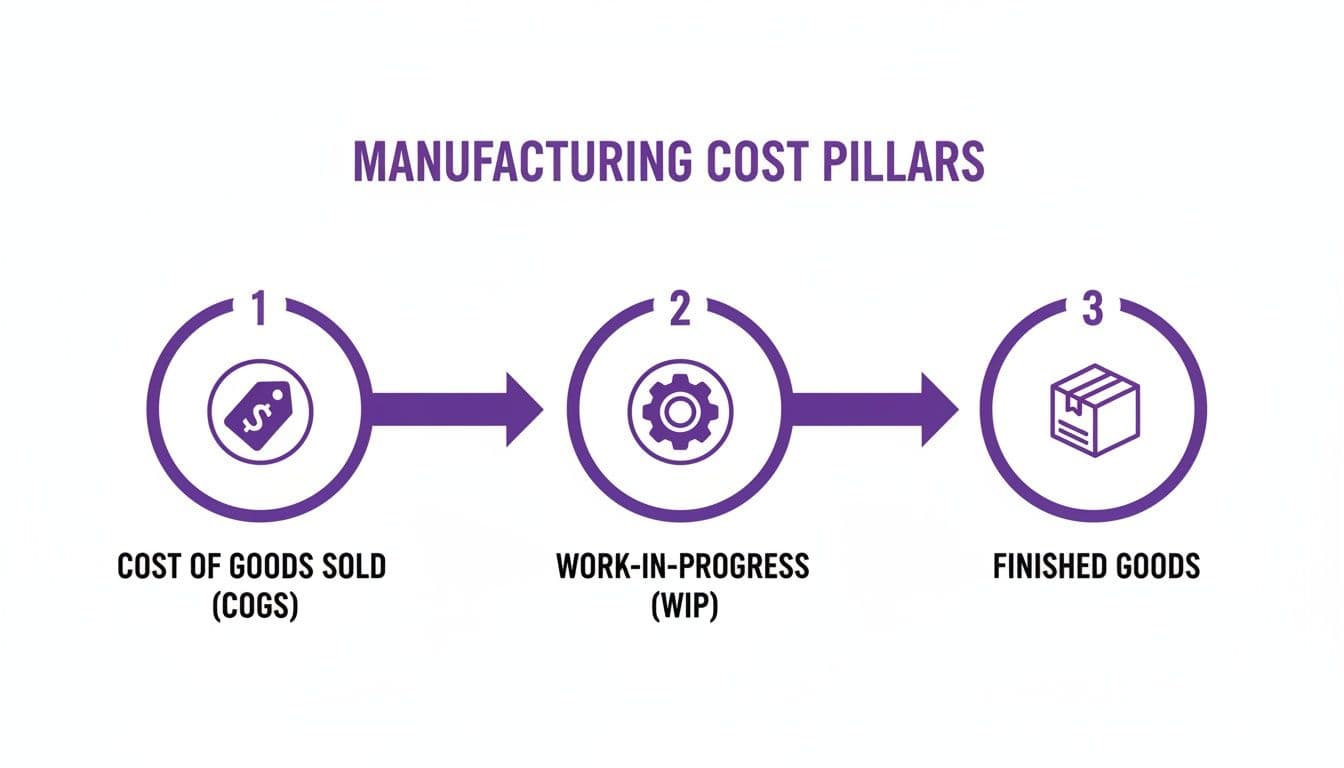
The Three Pillars of Manufacturing Inventory
To get real control, you must look beyond a simple P&L and focus on the three inventory accounts that are the bedrock of manufacturing accounting. These aren't just bookkeeping terms; they are the strategic levers you pull to manage cash flow and profitability.
-
Work-in-Progress (WIP): This is the total cost tied up in partially assembled products currently on your production line. Mismanaging WIP is like having cash trapped in a financial black hole—it looks like an asset on your balance sheet, but it's draining your actual bank account.
-
Finished Goods: This is the full cost of products that are complete and ready for customers but haven't been sold yet. A high finished goods balance is a red flag for overproduction or slowing sales, tying up capital that you should be using for growth.
-
Cost of Goods Sold (COGS): This is the direct cost of producing the specific items you have actually sold in a given period. Calculating COGS accurately is the only way to know your true, product-level profitability and whether your pricing is right.
Understanding how costs flow through these three pillars is the difference between scaling successfully and running out of cash. It moves you from just tracking what you spent to actively managing the financial health of your entire production process. This isn't just "better" accounting—it's your single most powerful tool for maximizing margins and building a resilient business.
The Three Buckets: How Manufacturing Costs Flow Through Your Business
To get a real grip on your manufacturing finances, you have to understand how costs move through the business. It’s not a simple A-to-B transaction. Costs journey through three distinct inventory "buckets" on your balance sheet: Raw Materials, Work-in-Progress (WIP), and Finished Goods.
Think of it like building a custom piece of furniture. The lumber, screws, and varnish you buy are your Raw Materials. The moment your team starts cutting that wood and assembling the piece, the value of those materials—plus the labor cost of the person doing the work—moves into the Work-in-Progress (WIP) bucket. Once the furniture is built, sanded, and ready to be sold, its total cost gets transferred into the Finished Goods bucket.
It’s only when the customer buys that piece of furniture that the cost finally leaves your balance sheet and hits your P&L as Cost of Goods Sold (COGS).
This flow shows how value gets added at each step of production. Tracking it isn't just a bookkeeping chore; it's how you gain visibility into your production efficiency and keep your balance sheet accurate.
Why This Flow Is Everything
Without disciplined tracking, your WIP account becomes a financial black hole. It hides inefficiencies, traps cash, and makes it impossible to know the true cost of what you're building. Every single movement of cost requires a corresponding journal entry to keep the books straight.
This concept isn't just for physical products. Service businesses like creative agencies use similar principles to track the value of unbilled work. You can see how they apply it in our guide to Work-in-Progress accounting.
Inventory Cost Flow: A Worked Example
Let's walk through a simple production run to see how $10,000 in costs moves through your general ledger. Imagine your company is starting with zero inventory.
The table below shows the journal entries that record the journey of costs from raw materials to a final sale.
| Stage | Action | Debit Account | Credit Account | Amount |
|---|---|---|---|---|
| 1. Purchase | Buy $4,000 of raw materials on credit. | Raw Materials Inventory | Accounts Payable | $4,000 |
| 2. Production Starts | Use all $4,000 of materials to begin production. | Work-in-Progress Inventory | Raw Materials Inventory | $4,000 |
| 3. Production Continues | Add $6,000 in direct labor to the job. | Work-in-Progress Inventory | Wages Payable | $6,000 |
| 4. Completion | Finish the goods, now worth $10,000. | Finished Goods Inventory | Work-in-Progress Inventory | $10,000 |
| 5. Sale | Sell the finished goods. | Cost of Goods Sold | Finished Goods Inventory | $10,000 |
This step-by-step process ensures you know exactly where your money is at every stage. This is the foundational discipline of accounting for manufacturing, and it’s what separates businesses that control their cash from those that are constantly surprised by their bank balance.
Job Costing vs. Process Costing: Choosing Your Method
Picking a costing method isn't just an accounting exercise—it's a decision that dictates your pricing strategy, product margins, and ultimately, your company’s profitability. Get it wrong, and you'll get dangerously misleading data. You will underprice your most complex work or overprice simple products, killing your margins from the inside out.
The two main systems in manufacturing are job costing and process costing. The difference comes down to one simple question: are you building unique items or identical ones?
-
Job Costing is for businesses producing unique, custom, or low-volume goods. Think custom machinery, architectural millwork, or high-end bespoke furniture. Each "job" is its own mini-project, and you must track direct materials, direct labor, and overhead for that specific order.
-
Process Costing is for mass production of identical products. Think food and beverage companies, chemical producers, or simple electronics assembly. Instead of costing one item, you average costs over a massive batch of thousands of units.
This choice determines whether your financial data is a powerful tool or a liability.
Job Costing in Action: A Worked Example
Let's say you run a custom furniture business and a client orders a single, handcrafted walnut desk. With job costing, you’re tracking every penny tied to this specific project.
The cost sheet for this one job would look something like this:
| Cost Component | Details | Amount |
|---|---|---|
| Direct Materials | Walnut lumber, drawer slides, finish | $1,200 |
| Direct Labor | 40 hours @ $50/hour | $2,000 |
| Manufacturing Overhead | Allocated based on labor hours (40 hours x $20/hr rate) | $800 |
| Total Job Cost | $4,000 |
The total cost to build this one desk is $4,000. Now you have a precise, defensible number to base your selling price on. If you price it at $6,000, your gross profit on this specific job is $2,000, for a 33.3% gross margin.
This level of detail is essential for any business doing project-based work. In fact, this same logic applies outside of manufacturing—you can see how project accounting helps track profitability in service-based businesses, too.
Process Costing in Action: A Worked Example
Now, imagine you own a factory that produces a popular energy drink. You don't care about the cost of one specific can; you care about the average cost across the entire production run. This is where process costing is a perfect fit.
In May, your bottling department incurs the following costs to produce a batch of 200,000 cans:
- Direct Materials: $60,000
- Direct Labor: $25,000
- Manufacturing Overhead: $15,000
- Total Department Costs: $100,000
To find the cost per unit, you just divide the total cost by the number of units.
Cost Per Unit = Total Department Costs / Total Units Produced
Cost Per Unit = $100,000 / 200,000 cans = $0.50 per can
Each can costs you $0.50 to produce. This averaged cost is more than enough for pricing and inventory valuation because every unit is identical. Trying to track the specific water and sugar that went into can #14,328 would be impossible and completely pointless.
Choosing between job and process costing is one of the most fundamental decisions in accounting for manufacturing. Getting it right gives you the accurate, actionable data you need to price with confidence and protect your bottom line.
How to Accurately Allocate Manufacturing Overhead
Tracking direct costs is the easy part. You know exactly how much steel went into the frame and how many hours your team spent assembling it. But what about the factory rent? The supervisor’s salary? The electricity bill and the wear-and-tear on your machinery?
This is manufacturing overhead, and if you don’t account for it properly, it will silently destroy your profitability.
Without a disciplined way to allocate these costs, you’re just guessing. You’ll end up thinking a complex, resource-hungry product is a cash cow while overpricing a simple one, making you uncompetitive. Mastering overhead allocation is a non-negotiable step in accurate accounting for manufacturing.
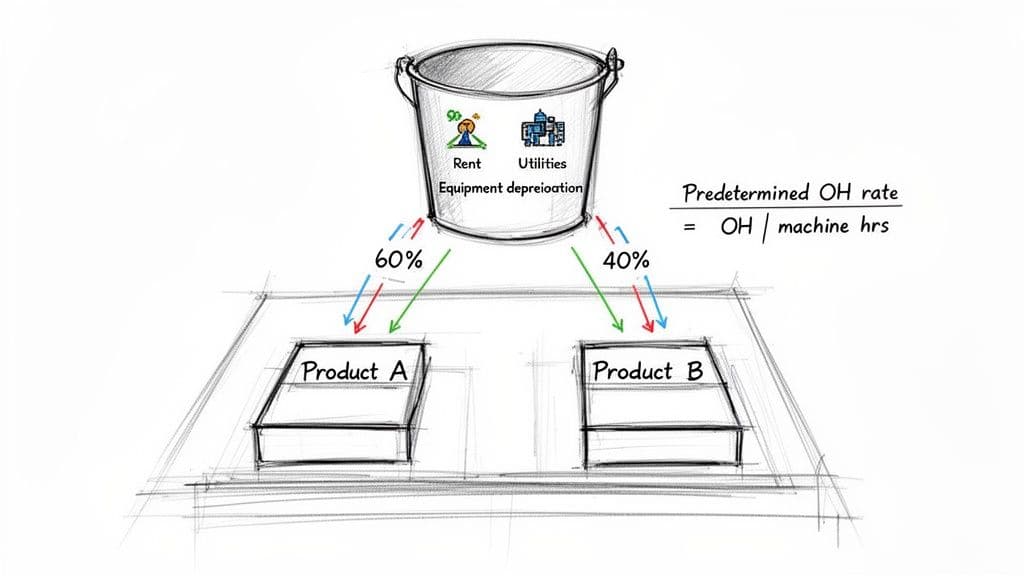
Calculating Your Predetermined Overhead Rate
You can’t wait until the end of the month to figure out your product costs; you need to know them as you produce. The solution is the predetermined overhead rate, a rate you calculate at the beginning of the year to apply overhead costs to jobs consistently.
Here’s the simple two-step process:
- Estimate Your Total Manufacturing Overhead: Add up all the indirect factory costs you expect to incur for the period. This includes everything from indirect labor and factory utilities to rent, insurance, and equipment depreciation. Let's say you forecast $200,000 for the year.
- Choose an Allocation Base: This is the "driver" that causes overhead costs to go up or down. Common bases are direct labor hours, direct labor cost, or machine hours. If your factory is heavy on automation, machine hours are usually the best fit. Let's assume you estimate 10,000 machine hours for the year.
Now, you just divide one by the other.
Predetermined Overhead Rate = Estimated Total Overhead / Estimated Allocation Base
$200,000 / 10,000 Machine Hours = $20 per Machine Hour
This rate—$20 per machine hour—is the tool you’ll use to apply a fair share of factory costs to every single job that runs through your shop. It turns abstract costs like rent into a tangible, per-unit figure.
Applying Overhead to Uncover True Costs
Let's see this rate in action. Imagine you make two products: Product A is simple, and Product B is far more complex.
- Product A requires just 1 machine hour to produce.
- Product B needs a full 4 machine hours to produce.
Using your $20/hour rate, the overhead applied to each product tells a completely different story:
- Product A Overhead: 1 machine hour × $20/hour = $20 per unit
- Product B Overhead: 4 machine hours × $20/hour = $80 per unit
Product B eats up four times the overhead resources. If you had just averaged your costs, you would have dramatically undercosted Product B and thought it was way more profitable than it actually is. This is the kind of insight that drives smarter pricing and production decisions. To see how this impacts your bottom line, check out our guide on understanding contribution margin.
A More Precise Method: Activity-Based Costing (ABC)
For operations with a diverse product mix, a single plant-wide overhead rate can still distort the truth. Some products might need lots of machine setups, while others need extensive quality checks. This is where Activity-Based Costing (ABC) provides a much sharper picture.
Instead of lumping all overhead into one giant pool, ABC creates multiple "activity pools" and assigns their costs using unique drivers that are directly related to that activity.
Overhead Allocation Methods Comparison
Here’s a look at how a simple, traditional allocation method stacks up against the more surgical approach of Activity-Based Costing.
| Aspect | Traditional Allocation (e.g., by Machine Hours) | Activity-Based Costing (ABC) |
|---|---|---|
| Cost Pools | One single, plant-wide pool. | Multiple pools based on activities (e.g., machine setups, quality inspections, material handling). |
| Allocation Base | A volume-based driver like machine hours or direct labor hours. | Multiple drivers specific to each activity (e.g., number of setups, number of inspections). |
| Accuracy | Less accurate. Can overcost high-volume, simple products and undercost complex ones. | Highly accurate. Links costs directly to the activities that actually consume the resources. |
| Complexity | Simple to implement and maintain. | More complex and costly to set up, but provides far superior insights for decision-making. |
For any manufacturer with a mix of simple and complex products, moving to ABC often feels like turning the lights on for the first time. It uncovers the hidden profits and losses that a traditional system completely misses. Find out more about these manufacturing trends on Godlan.com.
Red Flags: Common Accounting Pitfalls That Erode Profit
Even with the right systems, a few common accounting mistakes can quietly drain your profits. Get these wrong, and your financial statements aren't just inaccurate—they’re actively misleading you. This is your field guide to the warning signs that signal a slow, painful erosion of your bottom line.
Many founders think their numbers are solid, only to be blindsided by a sudden cash crunch or a massive year-end inventory write-off. These problems don't just appear out of nowhere. They're the result of seemingly small accounting errors that compound over time, hiding a grim reality until it's too late.
Misconception #1: "Our WIP account balance seems reasonable."
One of the most dangerous pitfalls is getting your Work-in-Progress (WIP) valuation wrong. The Reality: When you don't track WIP meticulously, costs get lost in the shuffle, and the value of this inventory on your balance sheet becomes an inflated fantasy. This makes your company look healthier and more valuable than it actually is, giving you a false sense of security.
The real shock comes during an audit or at the end of the year. A physical count reveals that the WIP on your books either doesn't exist or is grossly overvalued, forcing you into a significant write-down. This isn't just a simple adjustment; it vaporizes a chunk of your company’s net worth in an instant, often triggering a financial crisis you never saw coming.
Misconception #2: "We'll just do a big inventory count at the end of the year."
The Reality: Relying on a single, massive physical inventory count at year-end is a recipe for disaster. All year long, inventory gets damaged, lost, or even stolen—a phenomenon known as shrinkage. Without regular cycle counts, which are small, frequent checks of specific inventory sections, these discrepancies fester unnoticed.
The result? You operate for months on the assumption that you have more raw materials and finished goods than you actually do. This leads to inaccurate COGS and completely flawed production planning. When year-end arrives, the chasm between your books and reality forces a large, painful write-off that hammers your gross profit.
Misconception #3: "Inventory valuation (FIFO/LIFO) is just an accounting detail."
The Reality: During periods of changing costs, your choice between FIFO (First-In, First-Out) and LIFO (Last-In, First-Out) isn't just an accounting detail—it has a major impact on your profitability and how much tax you pay.
- During Inflation (Rising Costs): Using FIFO results in a lower COGS because you expense your older, cheaper goods first. This means higher reported profits and, consequently, a bigger tax bill. LIFO, on the other hand, expenses the newest, most expensive goods first, leading to a higher COGS, lower reported profits, and a smaller tax bill.
- During Deflation (Falling Costs): The effect flips. FIFO leads to lower profits, while LIFO reports higher profits.
Choosing incorrectly doesn't just skew your numbers; it has direct cash flow consequences. You could end up paying tens of thousands more in taxes than necessary simply because your accounting method isn't aligned with the economic reality of your costs.
"Founders often dismiss inventory valuation as 'just an accounting detail,' but in a volatile cost environment, it's a strategic cash flow decision. The wrong choice can easily cost you tens of thousands of dollars in unnecessary tax payments." — Michael Carter, CPA & Fractional CFO
Ignoring other opportunities, like monetizing production byproducts, is another classic mistake. For instance, finding ways to turn plastic waste into profit through industrial plastic recycling is a smart strategy that directly boosts your bottom line by converting what was once a cost center into a new revenue stream.
Essential KPIs to Measure Manufacturing Performance
Your manufacturing accounting system isn’t just for filing taxes—it’s the control panel for your entire operation. While standard reports tell you what happened last month, Key Performance Indicators (KPIs) reveal why it happened and what you can do about it. For founders and CEOs, tracking the right KPIs is the only way to make decisions that directly improve cash flow and profitability.
You have to move beyond just tracking total revenue. The real money is made or lost on the a production floor. The metrics that measure efficiency, quality, and speed aren't just operational numbers; they’re financial indicators that expose hidden costs and unlock opportunities.
Core KPIs for Manufacturing Leaders
Don't try to track everything at once. Start with a handful of high-impact metrics that give you a clear, honest picture of your operational health. For any growing manufacturer, these three are non-negotiable.
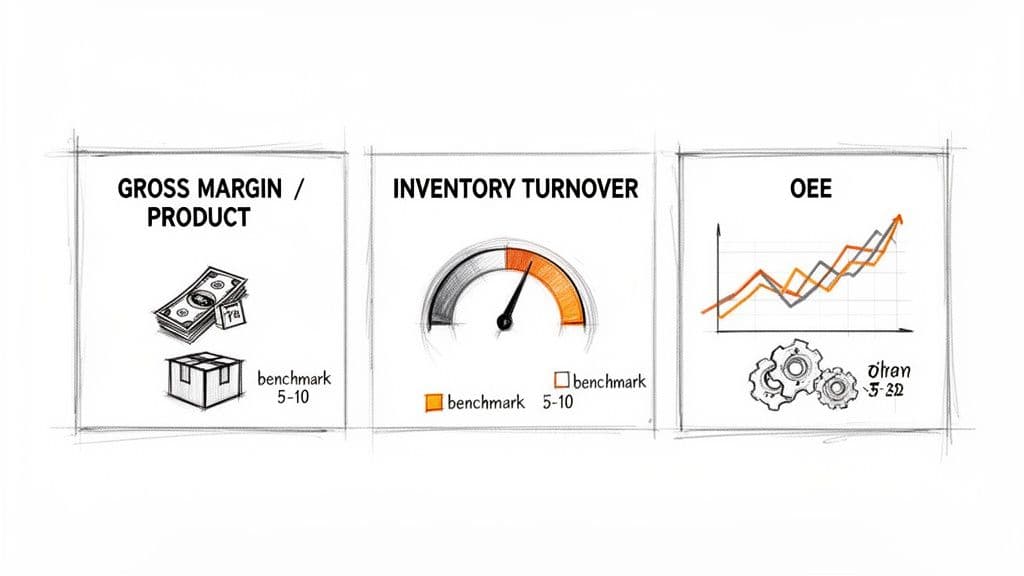
1. Inventory Turnover Ratio
This KPI answers a critical question: how fast are you turning raw materials into cash? A low turnover ratio means your cash is literally sitting on a shelf collecting dust. An exceptionally high ratio might feel good, but it could signal you're constantly at risk of stockouts and disappointing customers.
- How to Calculate It: Inventory Turnover = Cost of Goods Sold / Average Inventory
- Worked Example: Let's say your annual COGS is $2,000,000 and you typically hold $400,000 in inventory. Your turnover ratio is 5. This means you sell through your entire inventory five times per year.
- Industry Benchmark: This varies by industry. Per a 2023 report from Hackett Group, a median consumer goods company has a turnover ratio of 5.8, while top quartile performers reach 9.3 or higher. A ratio below 4 is often a red flag for excess inventory and wasted capital.
2. Overall Equipment Effectiveness (OEE)
OEE is the gold standard for measuring how productive your machinery really is. It’s a single, powerful score that combines how often your equipment is running (Availability), how fast it's running (Performance), and how many good parts it makes (Quality). It shows you how much of your production time is actually creating value.
- How to Calculate It: OEE = Availability x Performance x Quality
- Worked Example: A machine is available 90% of its scheduled time, runs at 95% of its theoretical top speed, and produces defect-free parts 99% of the time. Your OEE is 84.6% (0.90 × 0.95 × 0.99).
- Industry Benchmark: According to OEE.com, a score of 85% is considered world-class for discrete manufacturing. The reality is that many manufacturers hover closer to 60%, which means there's a massive amount of hidden capacity just waiting to be unlocked.
"Many leaders focus only on the top line, but OEE shows you how to grow your bottom line without a single new customer. Improving OEE from 60% to 70% can unlock massive hidden capacity and profitability." — Emma Stevens, Manufacturing Operations Consultant
3. Gross Margin Per Product
You can’t make smart decisions without knowing which products are your profit drivers and which are just keeping your team busy. This KPI goes beyond your company-wide gross margin to give you the line-item visibility you need to optimize your product mix.
- How to Calculate It: Gross Margin % = ((Revenue - COGS) / Revenue) x 100
- Worked Example: Product A sells for $150 with a COGS of $90, giving it a 40% gross margin. Product B has a higher price tag at $200, but its COGS is $150, leaving you with a gross margin of just 25%. Despite the higher price, Product B is significantly less profitable.
- Industry Benchmark: Healthy margins are industry-specific, but they must be high enough to comfortably cover all your operating expenses and still leave a profit. In general industrial manufacturing, gross margins typically range from 20% to 50%. Any product with a gross margin below 20% deserves a serious investigation.
Your Manufacturing Operations Dashboard
Tracking these KPIs in a spreadsheet is a decent first step, but it won't give you the real-time insights you need. The goal is to build a dashboard that connects your production data directly to your financial data, creating a single source of truth.
This is where you turn raw numbers into strategic action. For a deeper look at creating powerful dashboards, check out our guide on building financial dashboards for CEOs that keep you focused on your company’s financial health.
Actionable Next Steps: Building Your Scalable Financial Engine
You’ve got the core principles of manufacturing accounting down. Now for the most important part: turning those concepts into a real-world system that fuels your growth, not just records it. This is about building a financial engine that scales with you and gives you clarity at every single stage.
The right system depends entirely on where you are today. For startups and early-stage shops, something like QuickBooks can get the job done for basic job costing and inventory. But once you start pushing past the $3-$5 million revenue mark, with more product lines and a messier shop floor, you'll feel the growing pains. Its limitations become obvious. That’s the moment you have to start looking at a true ERP like NetSuite to handle complex inventory, multi-stage production, and the advanced reporting you now need.
Is Your Current System Holding You Back?
Use this simple list to see if your finance function is a strategic asset or a bottleneck. If you answer "no" to more than one of these, your system is failing you.
- Timely Reporting: Can you close your books in 5 business days or less?
- Granular Visibility: Do you know your exact gross margin per product, or even per specific job?
- Inventory Accuracy: Do you trust the inventory numbers on your balance sheet without needing a full physical count every time?
- Forward-Looking Data: Can you confidently forecast your cash flow for the next 13 weeks?
A "no" on any of these points is a red flag. It means your financial engine is sputtering. The first step to building a scalable system is documenting clear and consistent Finance Standard Operating Procedures. That discipline is the bedrock of an accurate and auditable finance function. For a deeper look at creating these systems, our guide on the automation of financial reporting offers more practical strategies.
The Smartest Path to Scale
For most growing manufacturers between $500K and $20M in revenue, the best solution isn't hiring a six-figure CFO or wrestling with software you've outgrown. The answer is an outsourced controller service. This model gives you immediate access to specialized manufacturing accounting expertise and enterprise-level systems, all without the hefty fixed cost of a full-time senior hire.
"Founders think they need to choose between DIY accounting and a full-time CFO. The real unlock for scaling manufacturers is the fractional model. It delivers the high-level expertise needed for complex inventory and costing at a fraction of the price, turning finance from a cost center into a strategic weapon." — Michael Carter, CPA & Fractional CFO
This approach perfectly bridges the gap. It provides the financial discipline and sharp insights you need to make critical decisions about pricing, production runs, and cash management. It’s how you make sure your financial engine isn’t just keeping up, but actively leading the way.
At Jumpstart Partners, we implement these precise systems for our manufacturing clients, delivering a 5-day month-end close and investor-ready financials. If you're ready to transform your financials into a strategic asset, schedule a free consultation at https://jumpstartpartners.finance to see how we can help.