Financial Operations
Mastering Profit and Loss Management for Sustainable Growth
A founder's definitive guide to profit and loss management. Learn to decode P&L statements, track key metrics, and implement strategies that drive real growth.
ByJumpstart Partners, CPA, QuickBooks ProAdvisor
··24 min readIs your Profit and Loss (P&L) statement a strategic roadmap or a historical document you glance at once a quarter? If you’re like most founders of businesses in the $500K to $20M revenue range, it’s probably the latter. And that reactive approach is costing you—in missed opportunities, surprise cash crunches, and weakened investor confidence.
Profit and loss management isn't just about accounting. It's the active, strategic process of digging into your P&L statement to boost profitability, streamline your operations, and build a resilient business. This guide shows you exactly how to flip your P&L from a rearview mirror into a forward-looking command center.
Your P&L Is a Growth Tool, Not Just a Report
As a founder, you’re juggling product, sales, and hiring. The P&L statement often feels like a chore—a necessary evil for taxes or the quarterly board meeting. But treating it this way is a critical mistake.
Your P&L is more than a record of the past. Think of it as a diagnostic tool that reveals the true health of your entire operation, from the effectiveness of your sales team to the real cost of delivering your product or service.
for businesses in the $500K to $20M revenue range, a reactive approach to the P&L is dangerously common. A quick glance once a quarter means you're making major decisions based on a reality that’s already three months out of date.
The High Cost of a Reactive Mindset
A passive approach to profit and loss management leads to predictable—and painful—outcomes. You’re essentially flying blind, unable to spot the subtle trends that signal trouble until they’ve escalated into full-blown crises.
This reactive posture creates several distinct disadvantages:
- Sudden Cash Flow Crunches: Profit on paper doesn't mean cash in the bank. A slowly deteriorating gross margin can silently drain your cash reserves, leaving you scrambling to make payroll.
- Missed Growth Opportunities: Without clear visibility into your unit economics, you can't confidently decide where to invest. Should you hire another salesperson or a customer success manager? Your P&L holds the answer.
- Weakened Investor Confidence: Sophisticated investors don't just glance at your P&L; they scrutinize it. If you can't speak intelligently about your key metrics and margin trends, you signal a lack of financial control that can jeopardize your funding round.
Shifting to Proactive Financial Control
Effective P&L management reframes the document from a historical artifact into a strategic command center. It’s about connecting the numbers directly to your business strategy, empowering you to make data-driven decisions that build a more resilient, valuable company.
"Your P&L statement breaks down critical elements that tell your company's financial story. Having real-time access to accurate GL data...enables your team to spot discrepancies early, address issues proactively, and equip leadership with insights that inform strategic decisions before opportunities evaporate." – Numeric.io, "The Controller's Playbook"
By actively managing your P&L, you pinpoint inefficiencies, validate your pricing strategy, and allocate capital with precision. This guide provides the framework you need to turn your P&L into your most powerful tool for navigating growth.
Decoding the Components of Your P&L Statement
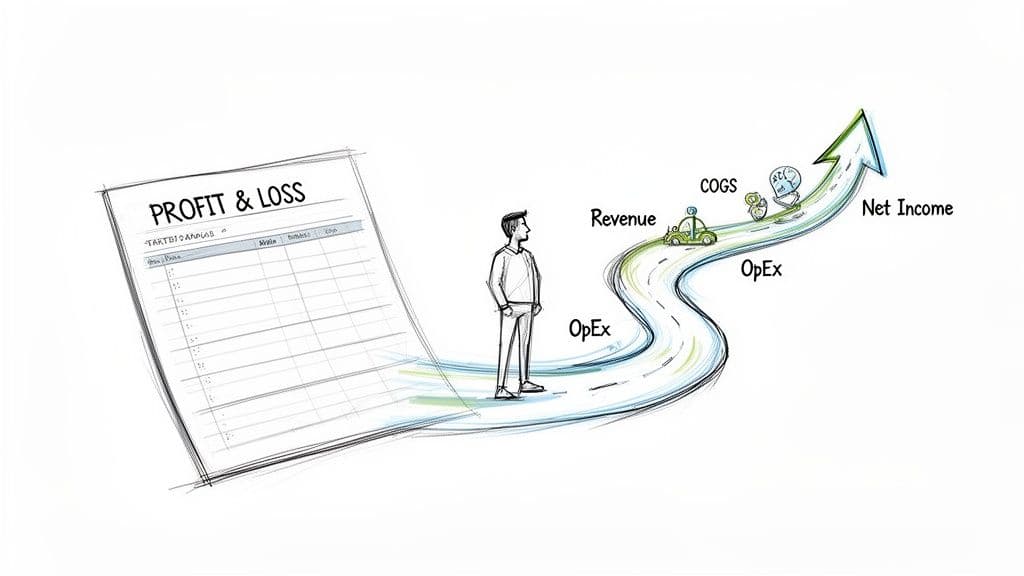
To manage your P&L effectively, you must look beyond the bottom-line number and understand the story each line item tells. Your P&L isn't just an accounting document; it's a map that shows exactly how every dollar of revenue is generated and spent on its journey to becoming profit.
for you as a founder, this is a non-negotiable skill. You need to be able to translate these accounting terms into real-world business intelligence.
Think of your P&L as a waterfall. It starts with your total sales at the very top and cascades down through various costs until you reach your take-home profit. Each stage reveals something critical about your business’s efficiency and health.
Revenue, COGS, and Gross Profit
This first section of your P&L is all about the core profitability of what you sell, long before any overhead costs are factored in.
- Revenue (or Sales): This is the top line—the total amount of money you’ve brought in from selling your products or services during a specific period.
- Cost of Goods Sold (COGS): These are the direct costs required to deliver your product or service. for a SaaS company, this includes server hosting fees on AWS, third-party data subscriptions, and the salaries of your customer support team. for a digital agency, it’s primarily the salaries of your billable, client-facing staff.
- Gross Profit: This is simply Revenue - COGS. It tells you how much profit you make on your core offering before accounting for operating expenses like marketing, R&D, or administrative salaries.
A common and costly misconception is confusing COGS with Operating Expenses. for a service business, a salesperson's salary is an operating expense, but a project manager's salary is COGS. Getting this right is fundamental to accurate margin analysis. for a deeper dive into the nuances of financial statements, check out our guide on how to read financial statements.
Operating Expenses and Net Income
This next section details all the costs required to actually run the business which aren't directly tied to delivering your service to a specific customer.
- Operating Expenses (OpEx): These are the overhead costs of being in business. They typically fall into three buckets: Sales & Marketing, Research & Development (R&D), and General & Administrative (G&A). This is where you'll find costs for software, rent, executive salaries, and legal fees.
- Operating Income (or EBITDA): Calculated as Gross Profit - Operating Expenses, this metric measures the profitability of your core business operations. It’s a clean look at how well the business itself is performing.
- Net Income (The Bottom Line): After you subtract non-operating items like interest and taxes from your Operating Income, you arrive at Net Income. This is your true, take-home profit for the period.
Effective profit management hinges on understanding how these components interact. for instance, the U.S. Information Technology sector showcased powerful profit growth recently, with net income surging 22% year-over-year in Q1 and accelerating to 29% by Q3. This was largely driven by strategic AI investments that ballooned 61% over prior-year levels, showing how targeted spending within OpEx can dramatically bolster profitability. You can discover more insights about how strategic investments are driving U.S. equity returns via RBC Wealth Management.
A Worked Example: The P&L in Action
Let's make this tangible. Here’s a breakdown for a fictional $5M ARR SaaS company to see how the numbers flow from the top line to the bottom line in a single year.
Sample P&L Statement Breakdown for a $5M ARR SaaS Company
| Line Item | Amount | Description & Calculation |
|---|---|---|
| Total Revenue | $5,000,000 | Annual Recurring Revenue from software subscriptions. |
| Cost of Goods Sold (COGS) | ($850,000) | Includes hosting, support staff, and essential third-party software. |
| Gross Profit | $4,150,000 | Calculation: $5,000,000 (Revenue) - $850,000 (COGS) |
| Sales & Marketing | ($1,750,000) | Salaries for sales/marketing teams, ad spend, and commissions. |
| Research & Development | ($1,000,000) | Salaries for engineers and product managers. |
| General & Administrative | ($600,000) | Executive salaries, rent, legal, and other overhead. |
| Total Operating Expenses | ($3,350,000) | Calculation: Sum of all OpEx line items. |
| Operating Income | $800,000 | Calculation: $4,150,000 (Gross Profit) - $3,350,000 (OpEx) |
| Interest & Taxes | ($150,000) | Loan interest payments and corporate income taxes. |
| Net Income | $650,000 | Calculation: $800,000 (Operating Income) - $150,000 |
This P&L tells a clear story: your company starts with $5 million in sales, makes a healthy $4.15 million in gross profit on its software, spends $3.35 million to run and grow the business, and ultimately keeps $650,000 as its net profit. Each line provides a checkpoint to analyze efficiency and make smarter decisions.
Key Financial Metrics and Margin Analysis You Must Track
Your P&L is more than just a list of numbers; it’s a story waiting to be told. Real profit and loss management starts when you stop looking at totals and start analyzing the relationships between those numbers.
This is where you dig into your margins. Margin analysis isn't an academic chore—it's how you diagnose the fundamental health of your business. It answers the gut-check questions every founder asks:
- Is our pricing strategy actually working?
- Are our delivery costs getting out of control?
- Is this business model built to last?
for anyone running a SaaS, agency, or professional services firm, getting a handle on these three metrics isn't optional. It's everything.
Gross Profit Margin
First up is your Gross Profit Margin, the most critical health check of your core business. It tells you how much money is left from each dollar of revenue before you pay for overhead like rent, marketing, or admin salaries.
Think of it as the profitability of your product or service in a vacuum. The calculation is simple:
Gross Profit Margin = (Gross Profit / Total Revenue) x 100
Let's use our fictional $5M ARR SaaS company for a worked example:
- Gross Profit: $4,150,000
- Total Revenue: $5,000,000
The calculation: ($4,150,000 / $5,000,000) x 100 = 83% Gross Margin
An 83% gross margin is fantastic. It means for every dollar in subscription fees, you keep $0.83 after paying for direct costs like hosting and customer support. This is directly tied to how efficiently you can make a sale, a concept we explore more deeply in our guide to understanding contribution margin.
Operating Profit Margin
Next, zoom out to the Operating Profit Margin. This metric measures the profitability of your day-to-day business operations. It shows how well you’re running the entire company—from sales and marketing to R&D and general admin—before non-operational items like interest and taxes come into play.
The formula:
Operating Profit Margin = (Operating Income / Total Revenue) x 100
for our example company:
- Operating Income: $800,000
- Total Revenue: $5,000,000
The calculation: ($800,000 / $5,000,000) x 100 = 16% Operating Margin
A 16% operating margin is solid. It signals that after all core business activities are paid for, the company is generating a healthy profit. A dropping operating margin, even when gross margin holds steady, is a massive red flag that your operating expenses are growing faster than your revenue.
Net Profit Margin
Finally, the Net Profit Margin is your true bottom line. This is what’s left after every single expense has been paid—COGS, operating expenses, interest on debt, and taxes. It's the percentage of revenue you actually get to keep.
The formula:
Net Profit Margin = (Net Income / Total Revenue) x 100
for our SaaS company:
- Net Income: $650,000
- Total Revenue: $5,000,000
The calculation: ($650,000 / $5,000,000) x 100 = 13% Net Margin
A 13% net margin confirms strong overall profitability. This is the ultimate scorecard, showing how effectively your company turns revenue into profit that can be reinvested back into the business.
Keeping a close eye on these margins is especially vital in a tough economic environment. With U.S. growth hovering around 2.0% and the Eurozone at a sluggish 0.5%, businesses everywhere are feeling the squeeze from rising costs. As households cut back on spending, maintaining healthy margins becomes the ultimate test of a company's resilience. You can see more on this in the 2025 global economic outlook on RSM's site.
Industry Benchmarks: What Good Looks Like
Knowing your margins is step one. Step two is knowing how they stack up against your peers. Context is key.
| Metric | SaaS Companies | Digital Agencies / Pro Services |
|---|---|---|
| Gross Profit Margin | 75% - 85%+ | 30% - 50% |
| Operating Profit Margin | 10% - 20%+ | 15% - 25% |
| Net Profit Margin | 5% - 15%+ | 10% - 20% |
According to OpenView's 2024 SaaS Benchmarks, top-performing SaaS companies consistently maintain gross margins above 80%, demonstrating high operational efficiency.
for a SaaS company, high gross margins are the norm because the cost to deliver one more unit of software is close to zero. for an agency, however, the lower gross margin reflects the high direct cost of your primary product: your team's billable time.
If your numbers are falling well below these benchmarks, it's a clear signal. It’s time to take a hard look at your pricing, your cost structure, or your operational efficiency.
Implementing a Disciplined Monthly Financial Close
Accurate profit and loss management is impossible without a disciplined, timely financial close. If your P&L data is unreliable or three weeks late, you’re making critical decisions based on a distorted, outdated reality.
The month-end close is the engine of financial visibility. It’s the process that turns raw transaction data into the strategic insights you need to guide your business.
Many founders in the $500K-$20M range see this process as "too much overhead." This is a dangerously common mistake. A sloppy or delayed close is what hides the cash flow bombs that sink companies and creates the financial discrepancies that kill investor deals.
A disciplined close isn't an expense; it's an investment in control and predictability.
The Core Components of a Fast, Accurate Close
Implementing a repeatable month-end process creates a reliable cadence for your financial operations. It moves you from chaotic, reactive bookkeeping to a proactive state of control. A robust close process always includes these non-negotiable steps.
Here’s a practical, step-by-step checklist you can adapt:
-
Reconcile All Cash and Credit Accounts: First, ensure the money your bank statements show matches the money recorded in your accounting system. Every transaction must be categorized and matched.
-
Record Accrued Expenses: What bills have you incurred but not yet paid? This includes vendor invoices that haven't arrived, upcoming payroll, or commissions you owe. Accruing these expenses gives you a true picture of your liabilities.
-
Recognize Revenue Correctly: for SaaS and service businesses, this is critical. Under the ASC 606 standard, you must recognize revenue as you earn it, not when cash lands in your bank. Booking a $120,000 annual contract as immediate revenue is a massive error.
-
Review and Close Sub-Ledgers: This means finalizing accounts payable (money you owe) and accounts receivable (money owed to you). An accurate picture of your receivables is vital for managing cash flow.
-
Perform a Variance Analysis: Once the books are provisionally closed, compare your actual performance against your budget. Where did you overspend? Where did revenue crush expectations? This analysis is what turns your P&L from a report into a management tool.
for a deeper dive, our complete framework for a monthly close process provides an in-depth guide.
The following process flow shows exactly how margin analysis depends on having accurate financial data from a disciplined close.
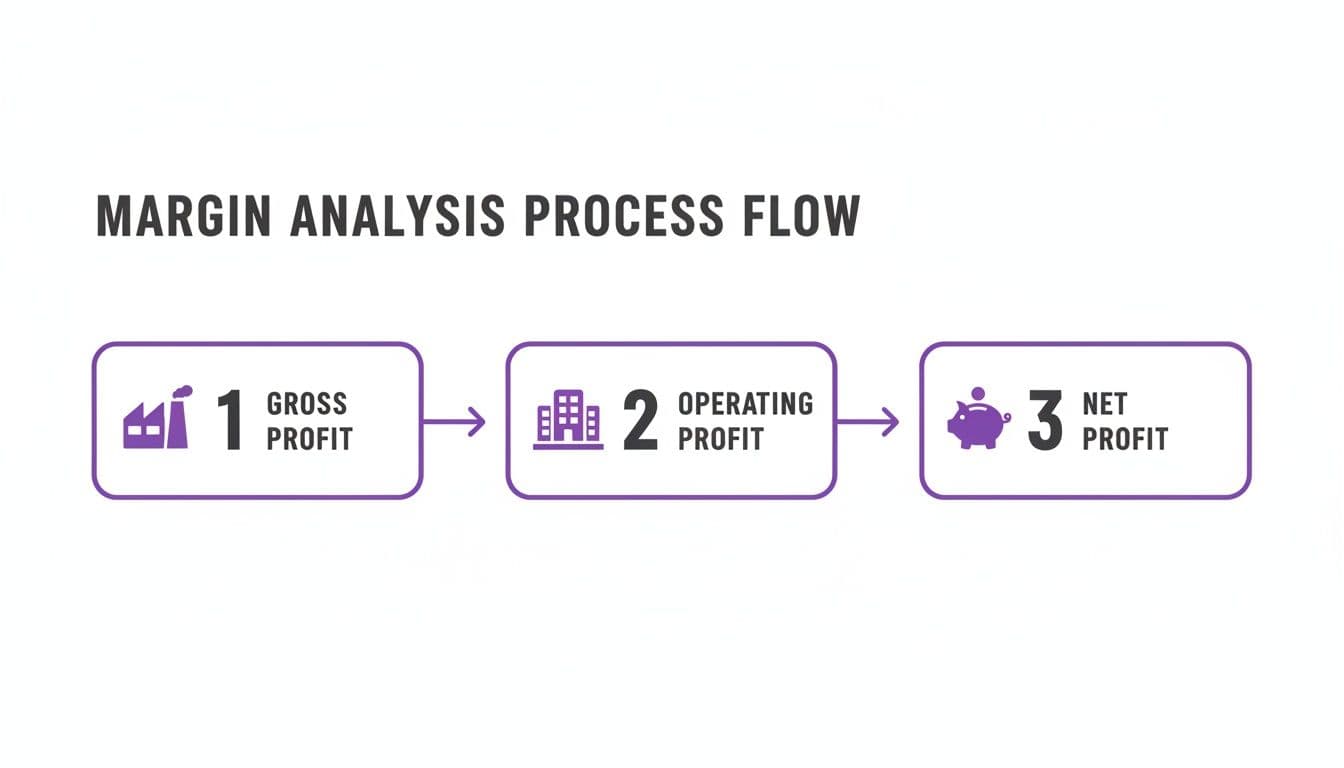
This flow underscores a simple truth: without a reliable close, your Gross, Operating, and Net Profit figures are just guesses.
"Creating a robust close process is the bedrock of building strategic P&L management in your organization. It helps deliver assurance to your business and unlock value and insights for users in the finance department and beyond.” – Adam Heeger, Former Revenue Accountant at Meta
A consistent close cadence gives you the agility to pivot. When you know your numbers are solid by the fifth business day of the month, you can react to market changes, double down on winning strategies, or cut costs before a minor issue spirals into a major crisis.
Red Flags: Warning Signs Your Close Process Is Broken
How do you know if your current process is broken? The warning signs are obvious if you know what to look for. If any of these sound familiar, your financial foundation is unstable.
- It takes more than 10 business days to close the books: A slow close means your data is stale on arrival, rendering it useless for timely decision-making. Top-performing finance teams get it done in five days or less.
- You get frequent "surprises" in your financials: Unexpected expenses or revenue shortfalls that pop up weeks later are a classic sign of poor controls and a lack of proper accrual accounting.
- Your team can't explain major budget variances: If you ask why marketing spend was 25% over budget and the answer is "I don't know," your close process lacks the necessary analytical rigor.
- Your investors or lenders constantly question your numbers: This is a huge sign of eroded trust. It signals that your financials lack the clarity required to secure and maintain capital.
Fixing these issues is fundamental to effective profit and loss management. A clean, fast, and accurate close gives you the reliable data you need to calculate meaningful metrics and build a truly resilient business.
Common P&L Mistakes That Cost Founders Millions

Even the sharpest founders make P&L mistakes that quietly hemorrhage cash and shatter investor confidence. These are not minor typos; they are fundamental errors that create a distorted picture of your company’s financial health.
The myth that "close enough" is good enough for your internal financials is a costly one. Inaccuracies on your P&L trigger a domino effect, leading to flawed strategies, surprise tax bills, and awkward conversations with investors who will spot the errors in a heartbeat.
Misclassifying COGS vs. OpEx
This is easily the most common—and most damaging—error. Mixing up Cost of Goods Sold (COGS) and Operating Expenses (OpEx) completely demolishes your gross margin, the single most important metric for gauging your business’s core profitability.
for a SaaS company, your AWS hosting fees are COGS. Your marketing director’s salary is OpEx. for a creative agency, your billable designer's salary is COGS, but your office manager's salary is OpEx. If you get this wrong, you have no idea if your fundamental business model actually works.
"A reliable P&L isn't just a report; it's a decision-making tool. If your inputs are garbage, your strategic outputs will be too. Accurate classification is the foundation of everything." – Sarah Jennings, Fractional CFO
This isn't just an internal headache. An investor who sees a SaaS company with a 55% gross margin will assume your unit economics are broken and walk away from the deal without a second thought.
Improper Revenue Recognition
This mistake is rampant in SaaS and service-based businesses that bill customers annually. When you close a $120,000 annual contract, you have not earned $120,000 in revenue that day. You've only earned $10,000 for the first month of service.
Booking the entire contract value as immediate revenue is a direct violation of the ASC 606 accounting standard, and it creates a dangerously inflated view of your current performance.
Here’s how it blows up your finances:
- Scenario: You land a $120K annual deal in January and record the entire amount as January revenue.
- The Problem: Your January P&L shows a massive, misleading profit. But your February P&L will show zero revenue from that client, creating wild swings that make your financials look chaotic and unpredictable.
- The Fix: You must recognize $10,000 of that revenue each month for the 12-month term. The remaining $110,000 sits on your balance sheet as deferred revenue until it's earned.
The only way to avoid these kinds of catastrophic reporting errors is by implementing robust financial controls for your growing business from the start.
Failing to Accrue Expenses
An accrual is simply an expense you’ve incurred but haven’t paid yet. Forgetting to record these gives you a false sense of security, making your company appear more profitable than it is—right up until the bills come due.
Imagine it’s the end of March. Your sales team earned $35,000 in commissions that won't be paid out until April 15th. If you don't "accrue" that $35,000 as a March expense, your March P&L is wrong by $35,000. Your profit is artificially high, and April's P&L will be artificially low when the cash goes out. This lack of discipline makes any kind of trend analysis completely useless.
To help you spot these issues early, we've put together a quick-reference table for identifying red flags on your P&L.
Red Flags: Identifying Warning Signs in Your P&L Statement
| Warning Sign (Red Flag) | What It Likely Means | Your Next Action Step |
|---|---|---|
| Gross Margin is below industry benchmarks (e.g., <70% for SaaS) | Your COGS might be misclassified (OpEx included), or your pricing is too low/delivery costs are too high. | Audit your COGS accounts. Ensure only direct costs of service (hosting, support labor) are included. Review OpEx for miscategorized items. |
| Volatile monthly revenue with large swings | You're likely recognizing annual contracts upfront instead of ratably over the service period. | Implement ASC 606 revenue recognition. Recognize 1/12th of annual contracts each month and book the rest to deferred revenue on the balance sheet. |
| Operating Expenses are declining while revenue is growing | You've probably forgotten to accrue expenses like commissions, bonuses, or contractor invoices incurred but not yet paid. | Review all major variable expenses. Create a month-end checklist to accrue for all known costs incurred during the period, regardless of payment date. |
| Net Income is high, but your cash balance is shrinking | Profit isn't cash. This often means you're not collecting from customers (rising A/R) or are making large capital purchases. | Immediately review your Statement of Cash Flows and Accounts Receivable aging report. Ramp up collections on invoices over 30 days old. |
Catching these red flags early is the difference between a minor course correction and a major financial crisis. Treat your P&L not just as a report card, but as an early warning system.
Your Action Plan for Proactive P&L Management
Knowledge without action is just trivia. You've seen how a well-managed P&L can steer strategy, but the real value is in execution. This plan lays out the exact steps to get you from reactive, rearview-mirror accounting to proactive profit and loss management.
If your month-end close is a slow, painful process or you have zero visibility into your most important metrics, your business is carrying unnecessary risk. It's time to fix it.
Step 1: Audit and Clean Your Current Financials
Before you can build anything that looks forward, you have to make sure the foundation is solid. That means popping the hood on your current accounting system—whether it’s QuickBooks or Xero. A thorough clean-up is almost always the first real step.
Your audit checklist should hit these points:
- Chart of Accounts Review: Is your COA structured to give you actual insights? Make sure your COGS and OpEx are clearly—and correctly—separated.
- Bank and Credit Reconciliations: Are all accounts reconciled to the penny for the last 12 months? Every unreconciled transaction is a potential error.
- Balance Sheet Integrity: Scan your balance sheet for old, phantom items clogging up accounts receivable or payable. These "financial ghosts" distort your true financial position.
Step 2: Implement a Disciplined 5-Day Close Process
With clean historicals, your next job is to lock in a fast, reliable month-end close. A chaotic, unpredictable close makes proactive P&L management impossible.
The goal is simple: get accurate, investor-ready financials within five business days of the month's end. No excuses. This discipline ensures you’re always making decisions with fresh, relevant data, not numbers that are six weeks old.
Step 3: Build a Forward-Looking Financial Forecast
Now for the strategic part. Once you trust your historical data, you can build a forward-looking P&L forecast.
Your forecast is a dynamic model of your business. It’s a tool that lets you map out hiring plans, test the impact of pricing changes, and get a real handle on your cash runway.
Start by creating a 12-month forecast that actually lines up with your strategic goals. A crucial part of this is performing a variance analysis each month. Comparing your actual results to your budget is the single best way to understand what's really driving performance. for a deep dive, check out our guide on actuals vs budget analysis.
Knowing When to Escalate from a Bookkeeper
If these steps feel overwhelming, that’s a blaring signal that you’ve outgrown your current bookkeeping solution. A bookkeeper’s job is to record history; a controller or fractional CFO’s job is to build the financial engine for growth.
It's time to upgrade when:
- You are getting ready for a fundraise or an audit.
- Your month-end close drags on for more than 10 business days.
- You have little to no confidence in your P&L and margin analysis.
Don't wait for a crisis to force your hand. The financial health of your business depends on having the right expertise at the right time.
If you're ready to gain full control over your financials with a team that guarantees a 5-day close and investor-ready reporting, Book a free consultation today. Let's build your financial roadmap together.
Common Questions About P&L Management
Even with the best plan, you're going to have questions. Here are the straight-up answers to the ones we hear most from founders, CEOs, and finance leaders trying to get a real handle on their numbers.
What’s the Difference Between a P&L and a Cash Flow Statement?
Your P&L shows if your business model is profitable. The cash flow statement shows if your business can actually pay its bills.
The P&L uses accrual accounting, matching revenue with the expenses you incurred to earn it, giving you a picture of profitability over a period. The cash flow statement is simpler—it just tracks every dollar that came in and every dollar that went out. A profitable P&L doesn't guarantee you have cash in the bank if your clients are paying you slowly. You absolutely need both.
How Often Should I Be Looking at My Company’s P&L?
You need to review a detailed P&L every single month. This isn't a suggestion; it's a non-negotiable part of running your business.
This monthly rhythm lets you catch trends before they become problems, see how you’re performing against your budget, and make smart adjustments. Waiting for quarterly or annual reviews is like driving by looking in the rearview mirror—you won’t see the cliff until you're already over it.
When Is It Time to Hire an Outsourced Controller?
It’s less about a specific revenue number and more about complexity. Most businesses hit this point when they cross the $1M ARR mark, have to deal with complex revenue recognition (a classic SaaS problem), or are getting ready for a fundraise or audit.
The tell-tale signs you've outgrown your bookkeeper are clear:
- Your month-end close consistently drags on for more than 10 business days.
- You have a nagging feeling that your financial data just isn't accurate.
- You can't get clear, actionable answers to your financial performance questions.
Can I Use P&L Projections for Strategic Planning?
You must. A forward-looking P&L, or financial forecast, is one of the most powerful tools you have. It shifts P&L management from a historical report card to a strategic roadmap.
"Creating a robust close process is the bedrock of building strategic P&L management in your organization. It helps deliver assurance to your business and unlock value and insights for users in the finance department and beyond." – Adam Heeger, Former Revenue Accountant at Meta
A solid forecast lets you play out different scenarios. What’s the impact of that new senior hire? What happens if we change our pricing? It helps you make decisions based on data, not just gut feelings.
If you're ready to move from reactive bookkeeping to a proactive financial strategy, Jumpstart Partners can help. Our US-based, CPA-certified team delivers investor-ready financials and a guaranteed 5-day close, giving you the clarity and control to scale with confidence. Book a free consultation today.