Financial Operations
A Founder’s Guide to Year Over Year Growth
Stop guessing your growth trajectory. Learn to calculate, interpret, and leverage year over year growth to attract investors and drive sustainable scale.
ByJumpstart Partners, CPA, QuickBooks ProAdvisor
··16 min readAs a founder, you're constantly judging the health of your business. A sudden revenue spike is exciting, but what does it really tell you about the long-term trajectory of your company?
Relying on monthly fluctuations is a recipe for bad decisions. True business health is revealed in consistent, long-term trends. This is where mastering Year-over-Year (YoY) growth becomes one of your most critical tools. Without it, you’re flying blind.
Is Your Growth a Signal or Just Noise?
Your YoY growth rate is the single best metric for measuring your company's true trajectory. It cuts through seasonal static and one-off wins, giving you, your board, and potential investors a clear, honest picture of your company's health.
Without this vital perspective, you risk making strategic decisions based on misleading data. You might celebrate a big sales month that masks rising customer churn, or worse, fail to spot a slowdown until it’s a full-blown crisis.
This guide moves beyond the simple formula. We'll show you how to calculate, interpret, and use YoY growth to build a more resilient, valuable, and fundable business.

Why YoY Growth Matters More Than Ever
In a market that rewards sustainable progress over short-term spikes, YoY growth demonstrates stability and strategic execution. It answers the fundamental questions that every stakeholder asks:
- Are you consistently growing? It smooths out the volatile month-to-month swings caused by seasonality, large one-time sales, or marketing campaigns.
- Is your strategy working? Comparing annual performance reveals the long-term impact of your product, pricing, and market positioning decisions.
- Are you a sound investment? For investors, consistent YoY growth is a powerful indicator of product-market fit and a predictable revenue engine.
To truly understand your performance, you have to distinguish signals from noise in your data. Focusing on annual trends separates genuine momentum from temporary distractions, allowing for far more accurate forecasting and resource allocation.
A Macro View on SaaS Growth
Context is crucial when you're evaluating your performance. The global SaaS market itself shows remarkable year-over-year growth, projected to surge from $390.5 billion in 2025 to $466.0 billion in 2026—a robust 19.38% increase.
For founders and finance leaders, tracking these macro trends is vital, especially as SaaS is expected to comprise 85% of all business software by the end of 2025. You can dig into more of these pivotal SaaS statistics and what they mean for your business.
How To Calculate YoY Growth For Your Business Model
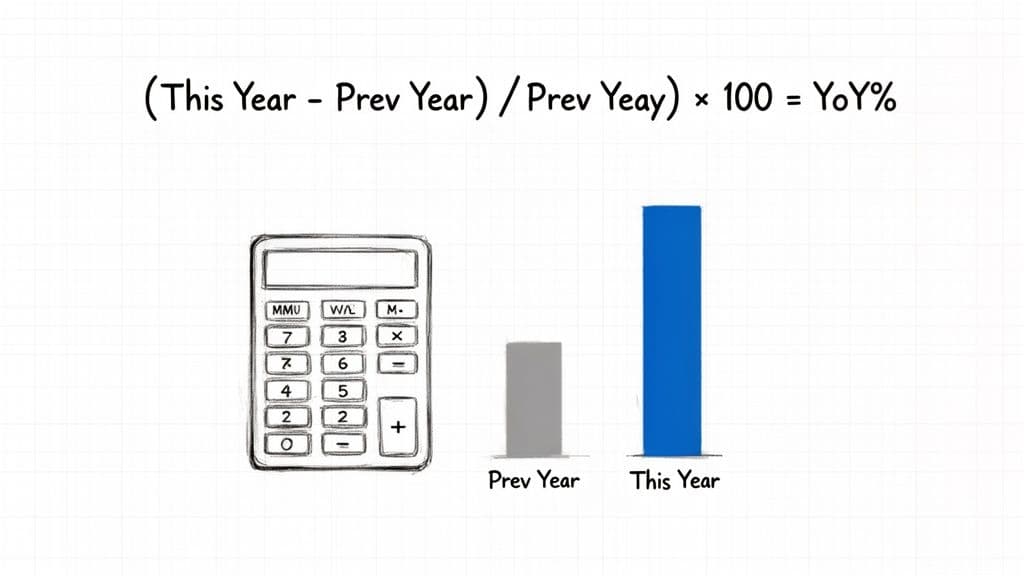
The basic Year-over-Year growth formula is straightforward: ((Current Period Value - Prior Period Value) / Prior Period Value) * 100. The real power comes from applying it to the right metrics—the ones that truly define your business's health.
Generic revenue growth is a starting point, but you have to go deeper. For your SaaS company, top-line revenue can be misleading if it’s padded with one-time setup fees. For your digital agency, project revenue can easily mask a slow decline in retainer clients. The key is to calculate YoY growth for the metrics that drive your specific business model.
YoY Growth Calculation Examples by Business Model
To make this concrete, let's break down how to approach YoY calculations. The table below shows worked examples using real numbers for the core metrics that matter to your business.
| Business Model | Key Metric | 2025 Value | 2026 Value | YoY Growth Calculation | Result |
|---|---|---|---|---|---|
| SaaS | Annual Recurring Revenue (ARR) | $2,500,000 | $3,800,000 | (($3.8M - $2.5M) / $2.5M) * 100 | 52.0% |
| Digital Agency | Annual Retainer Revenue | $800,000 | $1,100,000 | (($1.1M - $800K) / $800K) * 100 | 37.5% |
| Professional Services | Revenue Per Employee | $180,000 | $215,000 | (($215K - $180K) / $180K) * 100 | 19.4% |
As you can see, the math is simple, but the metric you choose completely changes the story.
SaaS Companies Focus On Recurring Revenue
For your subscription business, Annual Recurring Revenue (ARR) is your gold standard. It reflects the predictable, ongoing revenue from customer contracts, which is exactly what investors want to see.
Let's say your ARR at the end of Q1 2025 was $2,500,000. By the end of Q1 2026, you've grown it to $3,800,000.
- Calculation: (($3,800,000 - $2,500,000) / $2,500,000) * 100
- Result: 52% YoY ARR Growth
This 52% tells a powerful story of product-market fit and customer loyalty. It's a far more compelling metric than total revenue, which might be inflated by non-recurring professional services.
Digital Agencies & Professional Services Track Stability
As an agency or services leader, you juggle one-time projects and ongoing retainers. You absolutely must track YoY growth for your retainer base to demonstrate stability.
Imagine your firm's client retainer revenue was $800,000 in 2025 and grew to $1,100,000 in 2026.
- Calculation: (($1,100,000 - $800,000) / $800,000) * 100
- Result: 37.5% YoY Retainer Growth
This specific calculation proves your ability to build long-term partnerships, not just chase temporary projects.
Red Flags: Common Calculation Mistakes To Avoid
A simple math error or inconsistent data can torpedo your credibility with investors. Watch out for these common traps:
- Inconsistent Time Periods: Ensure you are comparing identical periods. Pitting a full Q1 against a Q1 that's missing a week of data will throw off your entire analysis.
- Ignoring One-Time Spikes: A single, massive enterprise deal can create an artificially high YoY growth rate that's impossible to repeat. You must call this out in a footnote and present a "normalized" growth rate that excludes the anomaly.
- Mixing Revenue Types: Do not lump high-margin subscription revenue with low-margin service revenue in your primary YoY calculation. Segment them to show the true health of your core business.
"A common misconception is that all growth is good growth. Founders must dissect their YoY numbers. Growth driven by expanding into a profitable new market is fantastic. Growth driven by deep, unsustainable discounts is a warning sign of a weak product or flawed strategy." - David Scott, Partner at Jumpstart Partners
To accurately measure your progress, understanding the specific sales growth rate formula provides a crucial speedometer for your business's performance. By applying this disciplined approach, you create financial reports that are not just accurate, but defensible.
Translating Your YoY Growth for Investors
You hit a 50% year-over-year growth rate. Is that good? To an investor, that number is meaningless without context. The real answer depends entirely on your industry, your revenue stage, and the current market.
A 50% YoY growth rate for a SaaS company at $2M in Annual Recurring Revenue (ARR) is solid, but that same percentage at $15M ARR is absolutely exceptional. For a professional services firm, 25% YoY growth can signal incredible market leadership. The key is to build a narrative around your growth, using the right benchmarks to prove your performance isn't just good—it's investment-worthy.
What “Good” YoY Growth Actually Looks Like
Investors measure your YoY growth against benchmarks for your specific business type and size. Here’s how to frame your performance correctly. For venture-backed SaaS companies, expectations are sky-high in the early days and temper as you scale.
| Annual Recurring Revenue (ARR) | Weak YoY Growth | Good YoY Growth | Great YoY Growth |
|---|---|---|---|
| Under $2M | < 60% | 60% - 150% | > 150% |
| $2M - $5M | < 40% | 40% - 100% | > 100% |
| $5M - $15M | < 25% | 25% - 60% | > 60% |
| $15M+ | < 20% | 20% - 40% | > 40% |
Source: Adapted from multiple venture capital and industry benchmark reports, including OpenView and ScaleVP.
These are not gospel, but they are a solid starting point for any board conversation. For professional services firms and digital agencies, a consistent 20-30% YoY growth is very healthy, signaling strong client relationships and market demand without sacrificing quality.
Calibrating Expectations in Today's Market
Benchmarks shift with the economic tides. The "growth-at-all-costs" mindset has been replaced by a focus on capital-efficient, sustainable expansion. According to Lighter Capital's 2025 B2B SaaS startup benchmarks, median annual growth dropped from 47% to just 28% in the last year. Even top-quartile performers saw growth rates fall from 88% to 65%.
This market shift means investors are looking past the flashy top-line number. They want the story behind your year-over-year growth.
"Investors dissect YoY figures to understand three things: consistency, capital efficiency, and the narrative. I want to see a predictable growth pattern, not a rollercoaster. More importantly, how much did you spend to achieve that growth? A 50% growth rate achieved by tripling marketing spend is a red flag." - Anonymous, Venture Capitalist
Building Your Growth Narrative
When you walk into a boardroom, your job is to anticipate the tough questions and build a compelling story around your YoY metrics. This is a non-negotiable piece of effective investor reporting for startups.
Your report needs to proactively answer:
- What drove the growth? Was it new customers? Expansion revenue from existing clients? Or did you just raise prices?
- How efficient was that growth? What was your Customer Acquisition Cost (CAC), and how has that trended?
- Is this growth sustainable? How does your Net Revenue Retention (NRR) back up your YoY claims?
By addressing these points head-on, you shift the conversation from, "Is 50% good?" to "Your 50% growth, driven by strong NRR and efficient CAC, shows a healthy, scalable business." That’s the conversation that gets you funded.
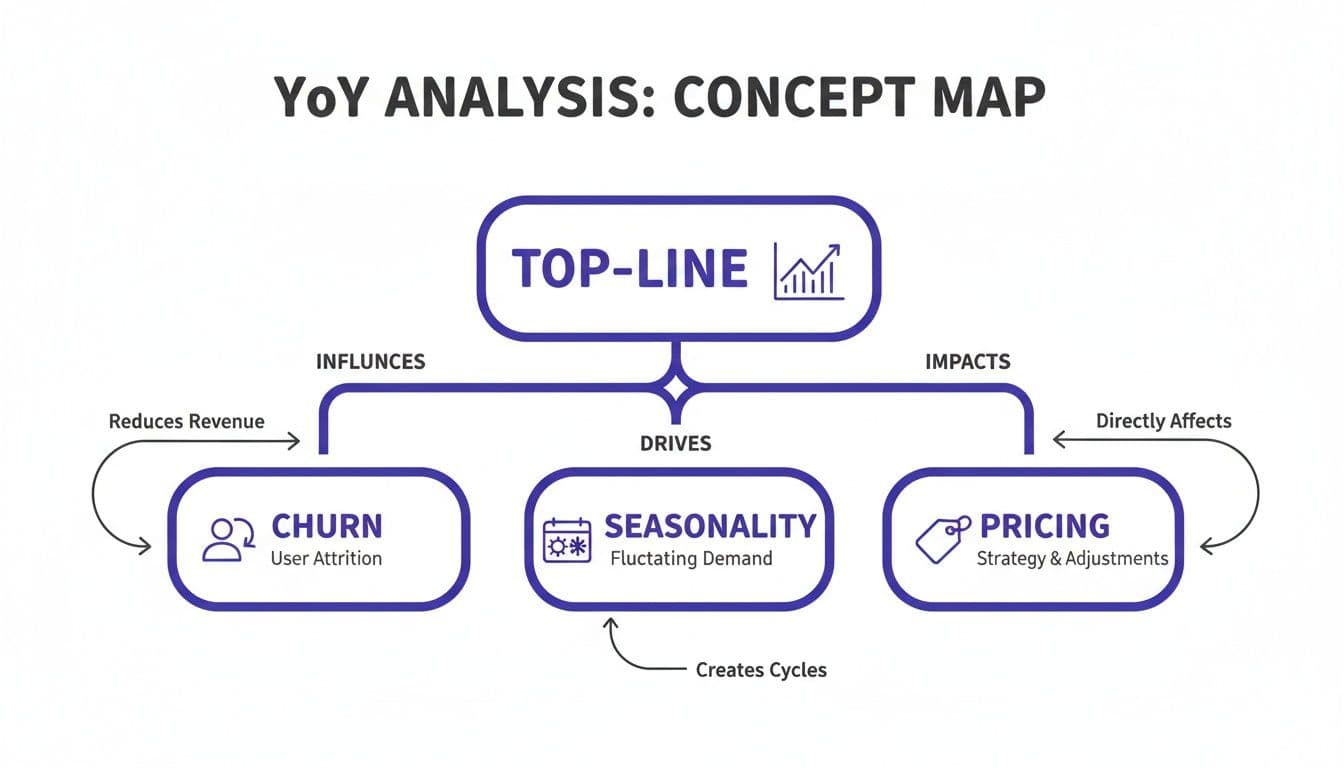
Looking Deeper Than Top-Line YoY Growth
A healthy top-line Year-over-Year growth rate looks great on a slide deck, but on its own, it’s a vanity metric. A strong growth rate can easily hide critical problems like a leaky bucket of churning customers.
To get a real, unvarnished view of your business's health, you have to dig deeper. Making these crucial adjustments to your YoY analysis proves you have an operational command of your business drivers and builds immense credibility with investors.
Dissecting the “Why” Behind Your Growth
Your first question shouldn't be "What was our growth?" but "What kind of growth was it?"
Not all growth is created equal. Was it driven by acquiring a wave of new logos, upselling your existing happy customers, or just by raising your prices? Each answer tells a profoundly different story. For example, some SaaS vendors have pulled in as much as 72% of their forward ARR increases from price hikes alone—not from new customers or feature expansions. With industry-wide price jumps hitting 8-12% annually, it's dangerously easy to mistake a pricing change for genuine market traction. You can read more about the impact of these recent pricing surges.
The Danger of Ignoring Customer Cohorts
A single YoY number lumps all your customers together into one bland average. YoY cohort analysis is your tool for uncovering the truth. It works by grouping customers by their sign-up period (like the "Q1 2025 cohort") and then tracking their behavior over time.
This analysis answers the questions that really matter:
- Are newer customers more valuable? Are they spending more or sticking around longer than the customers you acquired last year?
- Is our product getting stickier? Is our net revenue retention improving with each successive cohort?
- Where are the cracks showing? You might discover that a specific cohort, perhaps one acquired during a promotional blitz, is churning at an alarming rate.
This level of detail is fundamental to understanding your SaaS unit economics and the metrics that truly matter.
Warning Signs Your YoY Growth May Be Unhealthy
A positive YoY growth rate can be misleading. Be vigilant for these red flags, which signal that your growth is unsustainable or built on a weak foundation.
| Red Flag | What It Means | Corrective Action |
|---|---|---|
| High Gross Churn | You're losing customers almost as fast as you're acquiring them, masking the problem with new sales. | Analyze churn reasons by cohort. Focus retention efforts on your most valuable customer segments. |
| Declining Net Revenue Retention (NRR) | Your existing customers are spending less over time, either by downgrading or churning. | Investigate product usage and customer satisfaction. Improve your upsell and cross-sell motions. |
| Growth from Price Hikes Alone | Your growth isn't coming from winning new business but from charging existing customers more. | Balance price increases with clear value additions and maintain a strong focus on new logo acquisition. |
| Ignoring Seasonality | You panic during a predictable Q3 dip or over-celebrate a regular Q4 peak. | Analyze at least three years of data to identify patterns. Build a normalized forecast that accounts for these cycles. |
By segmenting your growth and confronting these potential issues head-on, you develop a deep, defensible understanding of your business’s real performance.
Building a Complete Growth Dashboard
Your Year-over-Year growth rate is the North Star for your long-term trajectory, but you cannot navigate the entire journey with it alone. Relying on YoY exclusively is like steering a ship with only a compass; you see the general direction but miss the immediate currents that could sink you.
You have to look at YoY growth alongside other key indicators. This context separates a flimsy financial narrative from one that stands up to investor scrutiny.
Choosing The Right Growth Metric
Metrics like Month-over-Month (MoM) and Quarter-over-Quarter (QoQ) growth act as your early-warning system, tracking the immediate impact of your operational decisions. On the flip side, Compound Annual Growth Rate (CAGR) smooths out volatile peaks and valleys to present a clean trend line that investors love.
"A common mistake I see is founders using MoM growth to project annual performance. It's misleading. MoM is for tactical feedback; YoY is for strategic validation. Your dashboard must clearly separate the two to demonstrate you understand the difference." – David Scott, Partner at Jumpstart Partners
Here’s a framework for deciding which growth metric to use for which job.
| Metric | Best For | Pros | Cons |
|---|---|---|---|
| YoY (Year-over-Year) | Strategic planning, investor reporting, and analyzing long-term trends. | Smooths out seasonality and reduces noise from short-term fluctuations. | Can be a lagging indicator, slow to reflect recent strategic shifts or market changes. |
| QoQ (Quarter-over-Quarter) | Assessing the impact of strategic initiatives over a 90-day period. | Balances short-term volatility with a solid medium-term view of momentum. | Can still be influenced by seasonal trends (e.g., a strong Q4 for e-commerce). |
| MoM (Month-over-Month) | Tracking tactical results from sales sprints or marketing campaigns. | Provides rapid, real-time feedback on operational changes. | Highly volatile and prone to noise, making it poor for long-term forecasting. |
| CAGR (Compound Annual Growth Rate) | Presenting multi-year growth to investors or for business valuation. | Provides a single, smoothed growth rate over several years, ideal for comparisons. | Obscures volatility and performance swings within the period. |
By building out your reporting with this multi-faceted view, you move beyond simple accounting and start telling a sophisticated financial story. For a deeper dive, explore our guide on creating powerful financial dashboards with the key metrics CEOs need.
Actionable Next Steps: Putting Your YoY Reporting to Work
Understanding year-over-year growth is one thing. Embedding it into your operational rhythm is what separates theory from strategy. This is your playbook for turning YoY analysis from a reactive, once-a-year headache into a proactive, strategic weapon.
Weaving YoY into Your Monthly Close
Your monthly close is the heartbeat of your financial operations. It should not just be about closing the books. It's your single best opportunity to check the pulse on your long-term trajectory.
Here’s how to make YoY analysis a core part of that rhythm:
- Automate Your Data Feeds. Your core metrics—ARR for SaaS, Retainer Revenue for agencies—should flow directly into a reporting template. Manually pulling numbers is a recipe for errors.
- Calculate Key YoY Metrics. Add it to your close checklist. Generate YoY growth rates not just for top-line revenue, but for Net Revenue Retention and Customer Acquisition Cost.
- Write the Narrative Summary. Do not just show a number. Add a one-paragraph summary explaining the story behind the YoY trend. For example: "Q3 ARR grew 48% YoY, driven by the successful launch of our new enterprise tier, which contributed $400K in expansion revenue."
Your Investor-Ready YoY Growth Dashboard
When an investor asks for an update, you need a dashboard that tells a powerful story in seconds. It must be clean, clear, and focused on the metrics that matter most.
| Dashboard Component | What It Includes | Why It Matters |
|---|---|---|
| Top-Line Revenue Growth | A bar or line chart showing YoY revenue growth for the last 8 quarters. | Establishes the primary growth trend and demonstrates consistency over a meaningful period. |
| Key Metric Growth | YoY growth charts for your primary value metric (ARR for SaaS, Retainer Revenue for agencies). | Proves that your core, repeatable business model is scaling effectively. |
| Cohort Performance | A chart showing Net Revenue Retention (NRR) by customer acquisition cohort. | Demonstrates product stickiness and your ability to grow revenue from your existing customer base. |
| Efficiency Metrics | Comparison of YoY revenue growth vs. YoY growth in operating expenses (especially sales & marketing). | Shows capital-efficient growth. If revenue is growing at 50% YoY while S&M spend only grew 20%, you have a scalable model. |
Building this dashboard turns your financial reporting from a historical chore into your most powerful strategic tool.
Get Investor-Ready Financials
Ready to build a financial reporting system that impresses investors and gives you total clarity? Talk to one of our finance experts today. We deliver investor-ready financials with a guaranteed 5-day close so you can lead the conversation with total confidence.