Financial Operations
Master Your Runway: 10 Cash Flow Forecasting Best Practices for CEOs
Unlock runway clarity with cash flow forecasting best practices. Learn 10 proven steps to optimize cash flow for SaaS, agencies, and growth.
ByJumpstart Partners, CPA, QuickBooks ProAdvisor
··30 min readYou're scaling fast and your P&L looks great, but the cash in the bank tells a different story. For founders of SaaS, digital agency, and professional services firms between $500K and $20M in revenue, this gap between profit and cash is the single biggest threat to survival. An unexpected cash crunch forces painful layoffs, halts growth initiatives, and puts you out of business—even when you’re technically profitable.
Your gut feel for cash flow is a liability, not an asset. The solution isn't just "watching the numbers"; it's implementing a disciplined forecasting system that gives you a 13-week tactical view and a 52-week strategic view of your financial runway. Without a robust model, you're flying blind, unable to confidently answer critical questions from your board, investors, or leadership team about hiring plans, marketing spend, and capital needs.
This article moves beyond generic advice to provide 10 specific, actionable cash flow forecasting best practices tailored to your business model. You will learn not just what to do, but how to do it, complete with worked calculations and industry benchmarks. We will cover everything from building rolling forecasts and analyzing your cash conversion cycle to integrating headcount plans and stress-testing your model with scenario analysis.
The goal is to give you a clear, step-by-step playbook to transform financial management from a reactive, anxiety-driven process into a proactive strategic advantage. Let's get started.
1. Rolling Cash Flow Forecasts (13-Week and 52-Week Models)
Static annual forecasts are obsolete for dynamic businesses. They become outdated within weeks, leaving you to manage critical cash decisions with stale data. The superior approach, a core tenet of modern cash flow forecasting best practices, is the rolling forecast. This method creates a living financial model that continuously adapts, providing a perpetual forward-looking view of your cash position.
A rolling forecast maintains a consistent time horizon. As one week or month passes, you drop it from the forecast and add a new period to the end. This ensures your projections are always based on the most current actuals and assumptions. This continuous update cycle is crucial for managing the unique financial rhythms of SaaS, agency, and professional services companies.
The Power Duo: 13-Week and 52-Week Views
The most effective structure combines two distinct horizons:
- The 13-Week Cash Flow Forecast: This is your tactical, granular view. Updated weekly, it tracks every dollar in and out, helping you manage payroll, vendor payments, and client collections with precision. For a SaaS company, this model is essential for monitoring the cash impact of customer churn and CAC payback periods. A digital agency uses it to align project revenue inflows with contractor payment outflows.
- The 52-Week Cash Flow Forecast: This is your strategic, high-level view. Updated monthly, it helps you plan for major capital expenditures, hiring, fundraising, and seasonal trends. It provides the long-term visibility needed to make confident growth decisions.
How to Implement a Rolling Forecast
Getting started is more about process than complex tools. Follow these actionable steps:
- Establish a Cadence: Commit to a weekly update for the 13-week model and a monthly update for the 52-week view. Many teams find Tuesday mornings are ideal for this review, after the previous week’s transactions have cleared.
- Automate Data Inputs: Manually pulling data is a recipe for errors and wasted time. Integrate your accounting software (QuickBooks, Xero), payment processors (Stripe), and payroll systems (Gusto) to automate the flow of actuals into your forecast.
- Document Assumptions: Your forecast is only as good as its assumptions. Explicitly document key drivers like customer churn rates, sales cycle length, and payment terms directly within your model. This transparency is critical for refining your projections over time.
- Compare Forecast to Actuals: At the end of each month, conduct a forecast vs. actual variance analysis. Identify where your assumptions were off and use those insights to improve the accuracy of future projections.
2. Scenario-Based Forecasting (Base, Optimistic, Pessimistic Cases)
Relying on a single forecast creates a false sense of certainty and leaves you unprepared for volatility. A critical component of modern cash flow forecasting best practices is embracing uncertainty through scenario-based forecasting. This probabilistic approach models multiple outcomes to give you a realistic range of potential cash positions.
This method involves creating at least three distinct forecasts: a base case (most likely), an optimistic case (upside), and a pessimistic case (downside). Each scenario adjusts key variables like customer acquisition, churn rates, and payment delays to reflect different business conditions. This provides a robust framework for strategic decision-making, especially in fundraising conversations where investors expect you to demonstrate a clear acknowledgment of risk.

The Strategic Trio: Base, Optimistic, and Pessimistic Views
The power of this approach lies in preparing you for multiple futures:
- The Base Case Forecast: This is your "business as usual" model, built on your most realistic and data-backed assumptions. It reflects your operational plan and is the benchmark against which other scenarios are measured. For a digital agency, this might assume a consistent client retention rate and a predictable sales pipeline conversion.
- The Optimistic and Pessimistic Forecasts: These are your "what if" models. The optimistic case models upside potential, such as closing two large enterprise deals ahead of schedule. The pessimistic case stress-tests your runway by modeling downside risks, like a top client churning or a 20% drop in ad conversion rates. This downside model is crucial for understanding when you might need to make tough decisions, informing your break-even analysis guide and contingency plans.
How to Implement Scenario-Based Forecasting
Integrating scenario analysis into your process requires discipline, not complexity. Follow these actionable steps:
- Isolate Key Drivers: Identify the 3-5 most sensitive variables that impact your cash flow. For a SaaS company, these are typically new MRR, churn rate, and customer acquisition cost (CAC). For a professional services firm, they are billable utilization and new client signings.
- Quantify Your Scenarios: Define specific, quantitative adjustments for each scenario. For example, your pessimistic case isn't just "sales are down"; it's "the sales cycle extends by 30 days and the close rate drops by 15%." Ground these adjustments in historical data, such as your worst-performing quarter.
- Link Scenarios to Actions: Each scenario must have a corresponding action plan. The pessimistic case should trigger discussions about freezing hiring or cutting non-essential expenses. The optimistic case should prompt planning for how to deploy extra capital to accelerate growth.
- Communicate with a Narrative: When presenting to your board or investors, don't just show three sets of numbers. Tell a story for each scenario, explaining the specific events or market shifts that would cause you to move from your base case to an optimistic or pessimistic reality.
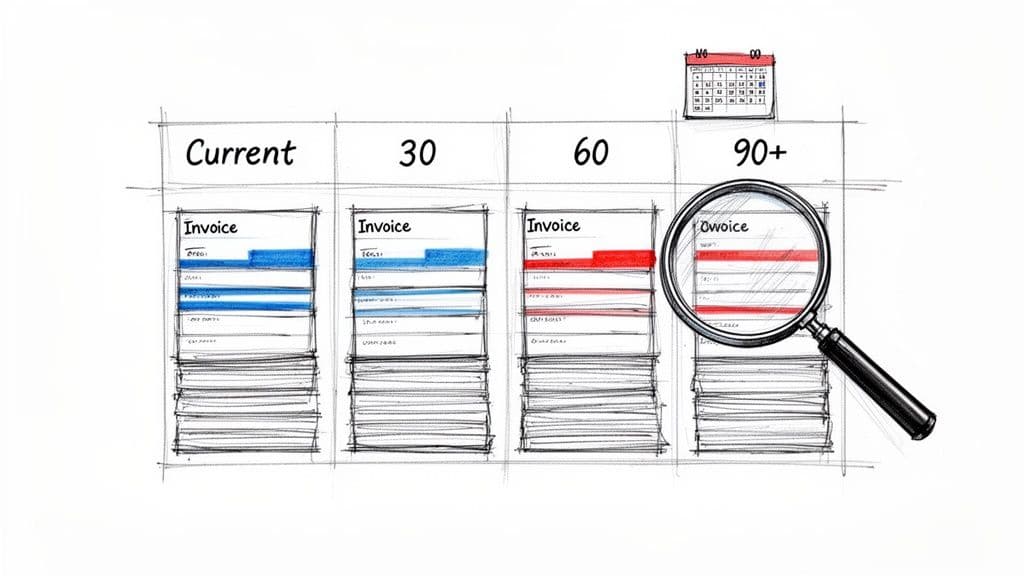
3. Days Sales Outstanding (DSO) and Accounts Receivable Aging Analysis
Simply forecasting revenue is not enough; you only have cash when the money is in the bank. For B2B SaaS, agencies, and professional services firms with invoicing cycles, assuming revenue equals immediate cash is a critical error. The superior method for accurately predicting cash inflows is a forensic analysis of your Accounts Receivable (A/R) using Days Sales Outstanding (DSO) and detailed A/R aging reports.
DSO measures the average number of days it takes you to collect payment after a sale is made. An A/R aging report categorizes your unpaid invoices into time-based buckets (e.g., Current, 1-30 days past due, 31-60 days past due). Together, they provide a precise, data-driven foundation for your cash inflow projections, moving you from hopeful guesses to empirical calculations. This is a non-negotiable component of any robust cash flow forecasting best practices.
Combining DSO and A/R Aging for Precision
This dual approach provides both a high-level metric and a ground-level action plan:
- Days Sales Outstanding (DSO): This is your key performance indicator. If your standard terms are Net 30 but your DSO is 48, you have a systemic 18-day cash gap in your working capital cycle. According to the 2024 SaaS Benchmarks from OpenView, the median DSO for SaaS companies is 45 days. A professional services firm might find its overall DSO is 50 days, but digging deeper reveals its top two enterprise clients average 75 days, immediately highlighting a need for contract renegotiation.
- Accounts Receivable Aging Analysis: This is your tactical enforcement tool. It shows you exactly which invoices are stretching your DSO and pose the greatest collection risk. A digital agency can segment its aging report by client vertical and discover e-commerce clients pay in 30 days while media clients average 60, informing its sales strategy and payment term negotiations for future contracts.
How to Implement A/R-Driven Forecasting
Integrate this analysis directly into your weekly cash flow process. Follow these actionable steps:
- Calculate DSO Weekly: Don't wait for the monthly close. Calculate DSO every week to catch collection issues before they snowball. The formula is:
(Accounts Receivable / Total Credit Sales) x Number of Days. For a quarter with $500,000 in credit sales and an ending A/R balance of $250,000, your DSO is($250,000 / $500,000) * 90 days = 45 days. - Segment Your A/R Aging Report: Go beyond a simple, monolithic list. Segment your aging report by customer size, contract type, or sales representative. This uncovers hidden patterns, such as a single salesperson consistently signing clients who are slow to pay.
- Establish Collection Triggers: Automate your response. Set rules in your process that an invoice aging past 60 days automatically triggers a defined escalation path, involving both the finance team and the customer's account manager.
- Compare DSO to Contract Terms: Your DSO should never be more than 1.25x your standard payment terms. If your terms are Net 30, a DSO over 38 is a red flag that requires immediate investigation. This gap analysis pinpoints process failures, from delayed invoicing to inefficient collections follow-up.
4. Subscription Revenue Recognition & Deferred Revenue Tracking (ASC 606)
For SaaS and subscription businesses, mistaking a signed annual contract for immediate cash is a critical error. Under ASC 606, cash received upfront for a service delivered over time isn't revenue yet; it's a liability called deferred revenue. Properly tracking this is a non-negotiable component of accurate cash flow forecasting best practices, as it provides a true forward-looking view of your committed cash and revenue visibility.
When a customer pays $120,000 upfront for an annual subscription, you don't recognize the full amount in that month. Instead, you book the cash but recognize only $10,000 in revenue each month for the next 12 months. The remaining balance sits on your balance sheet as deferred revenue, gradually converting to recognized revenue as you deliver the service. This principle prevents a false sense of security from large cash infusions and enables a far more predictable and stable forecast.
“Founders often get a false sense of security from a big upfront annual payment, but that cash has to last the entire year of service delivery. Tracking deferred revenue forces you to align your spending with the revenue you are actually earning each month, which is the key to sustainable growth.” - David Worrell, Partner at Fuse Financial Partners
Putting Deferred Revenue Tracking into Action
Integrating this principle moves your forecast from a reactive cash balance check to a proactive strategic tool:
- SaaS Contract Example: A SaaS company closes a $120,000 annual contract and receives payment on January 15th. The cash inflow is recorded in January. However, revenue is recognized at $10,000 per month from January through December. The deferred revenue balance starts at $110,000 in January and decreases by $10,000 each month, providing clear visibility into future recognized revenue.
- Agency Retainer Example: A digital agency signs a 6-month, $60,000 project paid upfront. The $60,000 cash is received in month 1. Revenue is recognized at $10,000/month for 6 months. This prevents the agency from over-hiring based on a one-time cash spike that isn’t recurring.
How to Implement Proper Revenue Recognition
Accurate deferred revenue tracking requires discipline and the right systems. Follow these steps to master it:
- Automate Recognition: Manual journal entries are a direct path to errors and compliance issues. Use the revenue recognition modules in your accounting software (like QuickBooks Online Advanced or Xero) or dedicated platforms like Stripe Billing and Zuora to automate the process.
- Build a Deferred Revenue Bridge: Reconcile your deferred revenue balance monthly against your billing system. Create a "bridge" or "waterfall" that breaks down the opening balance, new billings, recognized revenue, and ending balance. This practice quickly uncovers billing system discrepancies.
- Analyze Your Deferred Runway: Calculate your "deferred revenue runway," which is the total deferred balance divided by your average monthly recognized revenue. This KPI shows how many months of future revenue are already committed on your balance sheet, a powerful leading indicator of financial health.
- Forecast Net Revenue Retention: Don't just track MRR. Separate expansion, contraction, and churn within your forecast. Understanding these components provides a much clearer picture of future revenue streams and helps you more accurately calculate metrics like your Annual Recurring Revenue.
5. Cash Conversion Cycle (CCC) Analysis & Working Capital Optimization
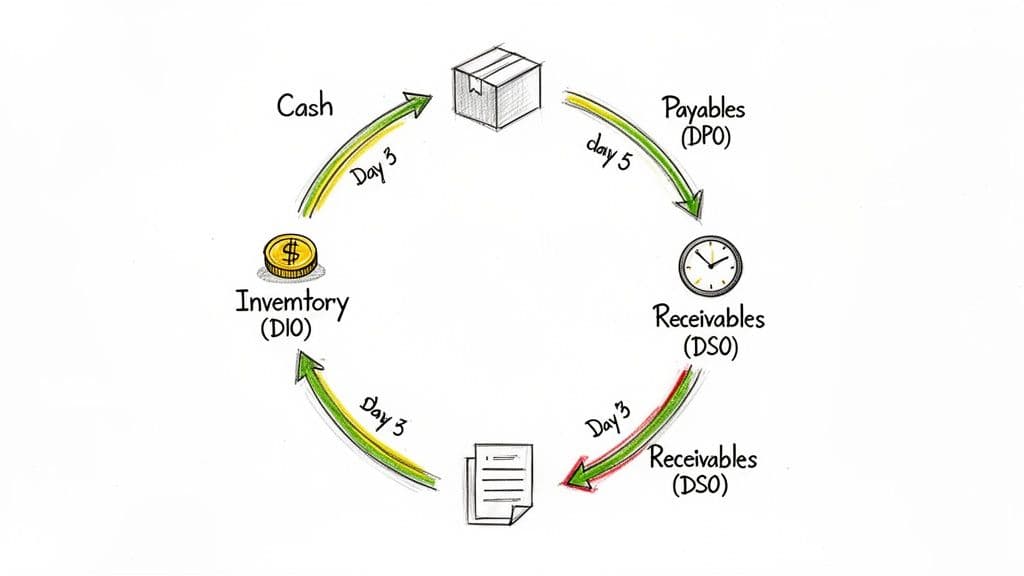
Forecasting future cash is only half the battle; actively shortening the time it takes to convert investments back into cash is where you gain a powerful competitive advantage. Many founders focus solely on revenue growth, overlooking the immense amount of cash trapped within their operations. The Cash Conversion Cycle (CCC) is the diagnostic tool that illuminates this hidden cash, measuring the number of days from when you pay for services or inventory to when you collect the cash from your customer.
The CCC formula is a direct measure of your operational efficiency: CCC = Days Inventory Outstanding (DIO) + Days Sales Outstanding (DSO) – Days Payables Outstanding (DPO). A lower CCC means your business needs less external capital to fund its growth, directly extending your cash runway. For SaaS, agency, and professional services firms, optimizing this cycle is one of the most effective cash flow forecasting best practices because it unlocks cash without raising new capital or taking on debt.
Why CCC is Your Secret Growth Lever
Optimizing each component of the CCC has a direct and significant impact on your cash position:
- Reduce Days Sales Outstanding (DSO): Getting paid faster is the most direct way to improve cash flow. A professional services firm reducing its DSO from 50 to 35 days by requiring deposits and implementing automated invoicing can accelerate thousands in cash inflows.
- Extend Days Payables Outstanding (DPO): Strategically managing your payments to vendors frees up your cash for a longer period. A digital agency extending its DPO from 30 to 45 days through vendor consolidation and contract renegotiations can significantly improve its immediate cash availability.
- For Service Businesses (DIO is Zero): Since you don't have inventory, your CCC is simply DSO - DPO. This puts intense focus on collections (DSO) and payment terms (DPO). A negative CCC, common in well-run subscription businesses, means your customers are financing your operations.
How to Implement CCC Analysis
Integrating CCC into your financial rhythm provides an early warning system for operational strain.
- Calculate and Track Monthly: Make CCC a core KPI in your monthly financial review. A rising CCC is a red flag indicating that your growth is becoming less efficient and consuming more cash than it should.
- Segment Your Analysis: Don't stop at the company-wide number. Analyze CCC by product line, customer segment, or service offering. This will reveal which parts of your business are cash-generative and which are cash-drains, allowing you to focus your optimization efforts.
- Model Working Capital Needs: Use your CCC to forecast the cash required to support future growth. For example, if your CCC is 45 days and you plan to grow revenue by $500,000 next quarter, you can estimate you'll need approximately
($500,000 / 90 days) * 45 days = $250,000in additional working capital to fund that growth. - Automate A/P and A/R: Manual processes create friction and delays. Use A/P automation tools to schedule payments precisely and A/R automation to streamline collections, systematically improving your DPO and DSO without adding headcount.
6. Expense Forecasting by Fixed, Variable, and Discretionary Categories
Lumping all expenses into a single "Operating Expenses" line item is a critical forecasting error. This approach hides your business's true operating leverage and limits your ability to make surgical cost adjustments when cash gets tight. A superior method, and a key component of effective cash flow forecasting best practices, is to segment expenses into fixed, variable, and discretionary categories. This granular view provides the clarity needed to understand your cost structure and control your financial destiny.
This segmentation method forces you to model each cost category with different assumptions. Fixed costs are stable, variable costs scale with revenue, and discretionary costs are decision-based. This reveals how much cash is consumed by fixed costs like salaries versus variable costs like commissions, enabling smarter decisions about when to pull back on discretionary marketing spend.
The Three Pillars of Expense Modeling
Effective expense forecasting requires treating each category differently:
- Fixed Costs: These are your non-negotiable, recurring expenses like rent, base salaries, and insurance. They are predictable and provide the foundation of your cost base. A SaaS company with high fixed costs (e.g., engineering salaries) must maintain a high gross margin to remain viable.
- Variable Costs: These costs scale directly with revenue, including sales commissions, payment processing fees, and hosting costs. For a digital agency, subcontractor fees are a major variable cost that must be forecasted in lockstep with project revenue.
- Discretionary Costs: These are the "growth" expenses you can dial up or down, such as marketing campaigns, travel, and R&D projects. While vital for growth, they are the first levers to pull during a cash crunch.
How to Implement Granular Expense Forecasting
This approach is about financial discipline and strategic planning, not just accounting.
- Recategorize Your Chart of Accounts: Work with your finance team to tag every expense line item in your P&L as "Fixed," "Variable," or "Discretionary." This initial setup is the most crucial step. For a detailed guide, review best practices for profit and loss management.
- Model Each Category Separately: Build your forecast model with separate driver-based assumptions for each category. Variable costs should be a percentage of revenue, fixed costs should be a flat monthly amount, and discretionary costs should be a budget you set.
- Calculate Your Breakeven Point: Use your fixed and variable cost data to calculate your monthly breakeven revenue. If your forecast shows you dipping below this point, you have an immediate trigger to activate a pre-planned cost reduction strategy focused on discretionary spend.
- Assign Ownership to Discretionary Budgets: Empower department heads by assigning them ownership and spending limits for discretionary categories. When cuts are needed, this makes the process collaborative and transparent, not a top-down mandate.
7. Payroll Timing & Headcount Planning Integration
Ignoring the specific timing and drivers of payroll is a critical forecasting error. For most SaaS, agency, and service-based companies, payroll is the single largest cash expense, and treating it as a simple, flat monthly number will derail your projections. The most accurate cash flow forecasting best practices demand a direct integration of your headcount plan and the real-world cadence of payroll cycles.
This specialized approach moves beyond a generic "salaries" line item. It models the precise timing of your bi-weekly or semi-monthly payroll runs, accounts for the variable cash impact of commissions and bonuses, and links future payroll expenses directly to your strategic hiring plan. This transforms your forecast from a rough estimate into a precise operational tool for managing your most significant cash outflow.
The Components of Integrated Payroll Forecasting
A robust model treats payroll as a dynamic system with multiple inputs:
- Headcount Plan Integration: This is your strategic view. It maps out planned hires by role, department, start date, and salary. For a digital agency planning to add three new developers at $90,000/year each in Q3, the model calculates the exact cash outflow beginning on their specific start dates, not just a vague quarterly increase.
- Payroll Cycle Accuracy: This is your tactical view. It maps cash outflows to their actual dates. If your salaried employees are paid on the 15th and 30th, but contractors are paid net-30, your forecast must reflect these distinct payment schedules to avoid a short-term cash crunch.
How to Implement Payroll and Headcount Integration
Accurate payroll forecasting requires connecting your HR and finance data streams. Follow these actionable steps:
- Centralize Your Headcount Plan: Create a simple spreadsheet or use an HR system to list all planned hires. Include columns for Role, Start Date, Base Salary, On-Target Earnings (for sales roles), and estimated benefits/payroll tax burden (a good rule of thumb is 1.25x to 1.40x salary).
- Automate Payroll Data: Integrate your payroll system (Gusto, ADP, Rippling) directly with your forecasting tool. This ensures your baseline forecast is always built on the latest actual payroll data, including salaries, taxes, and benefits.
- Model Variable Compensation Separately: Do not lump commissions and bonuses in with base salaries. Create separate forecast lines driven by revenue assumptions. For a SaaS company, model sales commissions as a percentage of new bookings, paid one month in arrears.
- Conduct Payroll Variance Analysis: At the end of each month, compare your forecasted payroll cash outflow to the actual amount. Investigate any variance over 5%. Was it due to an unplanned hire, a commission overpayment, or an increase in benefit costs? Use this analysis to refine your assumptions.
8. Revenue Cohort Analysis & Customer Lifetime Value (LTV) Modeling
Forecasting total revenue as a single, monolithic number is a common but critical mistake. It masks the underlying health of your customer base and leads to wildly inaccurate cash projections. The superior method, a foundational cash flow forecasting best practice for subscription-based businesses, is to use revenue cohort analysis and LTV modeling. This approach groups customers by their acquisition period (the "cohort") to reveal how their value evolves over time.
This cohort-based view moves beyond simple growth rates to uncover the true drivers of your cash flow: customer retention, expansion revenue, and payback periods. By understanding the distinct behavior of different customer groups, you can forecast future cash inflows with far greater precision. This is essential for SaaS, agency, and other businesses where long-term customer relationships are the engine of profitability.
The Power of Customer Cohorts and LTV
The most effective structure models cash inflows by analyzing customer value over their entire lifecycle:
- Revenue Cohort Analysis: This is your historical diagnostic tool. By tracking monthly recurring revenue (MRR) progression for each cohort, you can pinpoint trends in customer churn and expansion. For example, a SaaS company might discover that customers acquired in Q3 via a new marketing channel have a 10% annual churn rate, compared to the 2% churn of earlier enterprise-focused cohorts. This insight directly informs future revenue and cash projections.
- Customer Lifetime Value (LTV) Modeling: This is your forward-looking strategic metric. LTV calculates the total net profit a typical customer will generate before they churn. An agency can use this to see that clients from referrals have a $25,000 LTV, while those from cold outreach have a $10,000 LTV. This justifies reallocating business development resources to channels that produce more valuable, cash-generative customers.
How to Implement Cohort and LTV Forecasting
Integrating this into your process provides a clear view of your business's unit economics.
- Build a Cohort Table: In your forecasting model, create a table with customer acquisition periods (e.g., Jan-23, Feb-23) as rows and subsequent months as columns. Populate this with the MRR from each cohort over time to visualize revenue retention and decay.
- Calculate Key Unit Economic Ratios: For each significant cohort, calculate the LTV to Customer Acquisition Cost (CAC) ratio. According to OpenView, top-performing SaaS companies target an LTV:CAC ratio of 3.0 or higher. A ratio below 1.5 is a major red flag, signaling you are spending too much to acquire customers who don't generate enough cash to be profitable.
- Model Payback Period: Determine how many months it takes for a cohort's cumulative gross margin to exceed its CAC. A shorter payback period (ideally under 12 months for a venture-backed SaaS company) means faster cash recovery, which allows for more aggressive, self-funded growth.
- Forecast by Segment: Don't stop at just one blended LTV. Build separate models for different customer segments, product lines, or acquisition channels. This reveals which parts of your business are driving long-term cash flow and which are a drain on resources, enabling smarter strategic decisions.
9. Customer Concentration Risk & Dependency Analysis
Relying on a handful of large customers can fuel rapid growth, but it also creates a significant, often hidden, threat to your cash flow stability. A single unexpected client departure can derail your entire financial plan. A crucial cash flow forecasting best practice is to move beyond aggregate revenue projections and actively analyze your customer concentration risk. This involves quantifying your cash flow dependency on specific clients to manage this risk proactively.
This analysis is not just a risk management exercise; it's a strategic forecasting tool. By understanding which customers drive the bulk of your cash inflows, you can model the direct cash impact of a potential loss, plan for contract renewals with greater urgency, and build a more resilient business. This is especially critical for agencies and B2B SaaS companies where the 80/20 rule often applies in its most extreme form.
Uncovering Your Hidden Dependencies
The goal is to translate customer concentration into tangible cash flow scenarios. A digital agency, for example, might discover its top three clients represent 55% of its revenue. If two of those clients are in the volatile real estate sector, a market downturn presents a double threat. This insight immediately elevates diversification from a vague goal to a strategic, cash-driven priority.
- For B2B SaaS: A company might realize a single enterprise customer accounts for $200k in ARR, but their contract expires in 90 days. This finding triggers an immediate, high-priority renewal plan, involving customer success and the executive team to secure that predictable cash flow.
- For Professional Services: A firm tracking that its largest client (25% of revenue) just underwent a leadership change can preemptively increase engagement and reinforce value, mitigating the risk of the new executive re-evaluating vendor relationships.
How to Implement Concentration Analysis
Integrating this analysis into your forecasting process adds a layer of resilience. Follow these actionable steps:
- Calculate Your Concentration Ratio: Monthly, update a simple calculation:
(Revenue from Top 5 Customers) / (Total Revenue). If this ratio exceeds 40%, it's a red flag. If any single customer exceeds 20%, it's a critical risk. - Build a Renewal Calendar: Your forecast should include a calendar tracking the contract renewal dates for your top 10-20% of customers. Assign a risk score (e.g., Green, Yellow, Red) to each, informing your downside cash flow scenarios.
- Model the "Big Client Loss" Scenario: Create a specific scenario in your cash flow model that removes the revenue and related cash inflows from your largest customer. Analyze how this impacts your cash runway and covenants. This stress test reveals your true vulnerability.
- Monitor Customer Health & News: For your top 5-10 customers, set up news alerts and monitor their industry trends. A major negative event for them is a direct cash flow risk for you. Use this external intelligence to adjust your forecast assumptions.
10. Budget vs. Actual Variance Analysis & Monthly Close Reconciliation
A forecast without a feedback loop is just a guess. The solution is a rigorous monthly process of variance analysis, a cornerstone of effective cash flow forecasting best practices. This practice involves comparing your forecasted numbers to your actual results, systematically diagnosing the differences, and using those insights to create a smarter, more reliable forecast.
This recurring monthly reconciliation transforms your forecast from a static document into a dynamic learning tool. By institutionalizing a post-month-end review, you create accountability and ensure your operating assumptions are consistently tested against reality. This is how you move from simply guessing where your cash will be to confidently predicting it.
The Feedback Loop: How Variance Analysis Works
The core of this practice is a structured monthly review that bridges the gap between finance and operations:
- SaaS Company Example: You forecasted $50,000 in expansion revenue but actually recognized $75,000. A variance analysis reveals the entire $25,000 over-performance came from a new upsell feature. This insight directly informs a permanent upward revision to your expansion revenue assumptions.
- Agency Example: Your forecast assumed a gross margin of 60%, but actuals came in at 52%. The investigation reveals that subcontractor costs on a large project were 15% over budget. You then adjust your forward-looking cost model and review your project scoping process.
How to Implement a Variance Analysis Process
Integrating this discipline into your monthly close process is critical for building a reliable forecasting engine.
- Schedule a Monthly Variance Review: Book a recurring meeting for day 5 or 6 of your monthly close, after your books are finalized. Involve all department heads who own a piece of the budget to ensure comprehensive analysis and accountability.
- Set Materiality Thresholds: Don't chase down every small discrepancy. Mandate a documented explanation for any line item variance greater than a set threshold, for example, 5% of the forecasted amount. The owner must explain the reason and the forward-looking impact.
- Categorize Your Variances: To avoid overcorrecting, separate variances into distinct categories. A one-time unexpected expense is different from a systemic increase in your customer acquisition cost. Only adjust your forecast's core assumptions for systemic, recurring changes.
- Track and Report on Accuracy: Create a simple KPI to track your overall forecast accuracy each month. Set a team goal of reducing the month-over-month forecast error to less than 5%, creating a shared objective for continuous improvement. For a more detailed guide on structuring this process, explore these month-end close best practices.
10-Point Comparison: Cash Flow Forecasting Best Practices
| Best Practice | Implementation Complexity | Resource Requirements | Business Impact | Ideal Use Cases | Key Advantage |
|---|---|---|---|---|---|
| Rolling Cash Flow Forecasts | High (Weekly Discipline) | Medium (Integrations, Owner Time) | High (Continuous Runway Visibility) | SaaS & agencies needing weekly runway management | Living forecast; agile decisions; investor-friendly |
| Scenario-Based Forecasting | High (Multiple Model Variants) | High (Modeling, Documentation, Review) | High (Contingency Readiness) | Fundraising, strategic planning, risk assessment | Demonstrates risk awareness; supports investor narratives |
| DSO & A/R Aging Analysis | Low (Formulaic) | Low (Accounting Data) | Medium (Clearer Cash Timing) | B2B invoice-based SaaS and agencies with net terms | Directly links receivables to cash; fast to implement |
| Subscription Revenue Recognition | High (GAAP Rules) | High (Accounting Systems, Contract Data) | High (Predictable MRR/ARR) | SaaS with upfront/annual billing and investors | Accurate deferred revenue, audit-ready financials |
| Cash Conversion Cycle (CCC) | Medium (Cross-system Data) | Medium (A/R, A/P Integrations) | High (Frees Working Capital) | Agencies, Professional Services, Inventory Businesses | Unlocks operational levers to improve cash efficiency |
| Granular Expense Forecasting | Medium (Driver-based Modeling) | Medium (Detailed P&L Coding) | Medium (Rapid Cost Control Options) | Startups managing runway; budget and margin planning | Targets discretionary cuts; clarifies breakeven and leverage |
| Payroll & Headcount Integration | Medium (Payroll Cycles, HR Data) | Medium (HR/Payroll System Integration) | Medium (Accurate Payroll Cash Impact) | Payroll-heavy firms planning hires/raises | Links hiring to runway; automates payroll cash pulls |
| Cohort Analysis & LTV Modeling | High (Longitudinal Tracking) | High (CRM, Billing, Analytics Data) | High (Long-term Cash Predictability) | Growth-stage SaaS and subscription businesses | Reveals profitable cohorts; guides CAC/LTV and GTM |
| Customer Concentration Analysis | Low (Ranking, Renewal Calendar) | Low (Customer Revenue Data) | Medium (Quantifies Exposure) | Agencies/services with few large clients | Identifies concentration risks; informs diversification |
| Budget vs. Actual Variance | Medium (Monthly Close Discipline) | Medium (Accounting Cadence, Owner Reviews) | High (Improves Forecast Accuracy) | Companies needing disciplined FP&A & board reporting | Creates feedback loop; reduces recurring forecast error |
From Forecasting to Action: Your Next Steps to Cash Clarity
Navigating the financial landscape of a growing business without a precise cash flow forecast is like trying to pilot a plane through a storm with a faulty instrument panel. You lack the critical, real-time data needed to make proactive decisions, avoid unseen obstacles, and capitalize on emerging opportunities. Throughout this guide, we've dismantled the complex machinery of financial forecasting, transforming abstract concepts into a concrete, actionable playbook.
We moved beyond surface-level advice, detailing the tactical implementation of a 13-week rolling forecast to manage near-term liquidity and a 52-week model to align with strategic goals. You now have a framework for scenario-based forecasting, enabling you to stress-test your business against optimistic, pessimistic, and base-case outcomes. Mastering these cash flow forecasting best practices is the definitive step from reactive problem-solving to strategic, forward-looking leadership.
Your Immediate Action Plan
Information without implementation is merely trivia. To translate these concepts into tangible results, focus on these three critical takeaways immediately:
- Establish a Rhythmic Cadence: Your most urgent task is to implement a weekly 13-week cash flow forecast review. This is non-negotiable. This single discipline forces you to reconcile accounts, scrutinize upcoming expenses, and track receivables with relentless consistency. It turns forecasting from an annual chore into a weekly strategic pulse check.
- Integrate Operational Drivers: Your cash flow forecast cannot be an isolated finance document. It must be directly linked to the operational heart of your business. This means integrating your CRM data to project new sales, connecting your HR plans to model payroll expenses accurately, and analyzing your accounts receivable aging report to predict cash inflows.
- Communicate with Stakeholders: Begin sharing a simplified version of your forecast with your leadership team. When your head of sales understands the direct impact of closing deals on a specific timeline, or your marketing lead sees how their budget allocation affects the company's cash runway, you create a culture of financial accountability. Cash flow becomes a shared responsibility, not just a finance problem.
Ultimately, the power of a world-class cash flow forecast lies in the confidence it gives you. It's the confidence to invest in a new marketing channel, knowing you have the runway. It’s the confidence to hire a key executive, knowing you can cover the payroll. And it's the confidence to tell your board and investors a clear, data-backed story about where the business is headed. You've now seen what best-in-class looks like. The next step is to build it.
Implementing these cash flow forecasting best practices requires dedicated expertise and unwavering discipline—a major bottleneck for busy founders. At Jumpstart Partners, our US-based, CPA-certified team acts as your outsourced controller to build and manage this entire financial engine for you. We provide the systems, reporting, and strategic guidance you need to achieve complete cash clarity and control.