Financial Operations
GRR vs NRR: The Two Retention Metrics That Define Your Company's Value
Understand grr vs nrr with practical calculations, benchmarks, and strategies to boost SaaS profitability.
ByJumpstart Partners, CPA, QuickBooks ProAdvisor
··19 min readAs a founder or CEO, you’re constantly asked to prove your company is both healthy and scalable. The GRR vs. NRR debate sits at the heart of that proof. If your revenue is a bucket, Gross Revenue Retention (GRR) tells you how leaky that bucket is, while Net Revenue Retention (NRR) tells you if you can refill it—and even overflow it—using only the customers you already have.
Getting this wrong isn't just an accounting error; it's a strategic blind spot that can kill investor confidence and cripple your valuation. Misunderstanding the story these two metrics tell is a common, and costly, mistake for leaders in the $500K to $20M revenue range. Let’s make sure you don't make it.
Why GRR vs. NRR Is the Core Valuation Debate
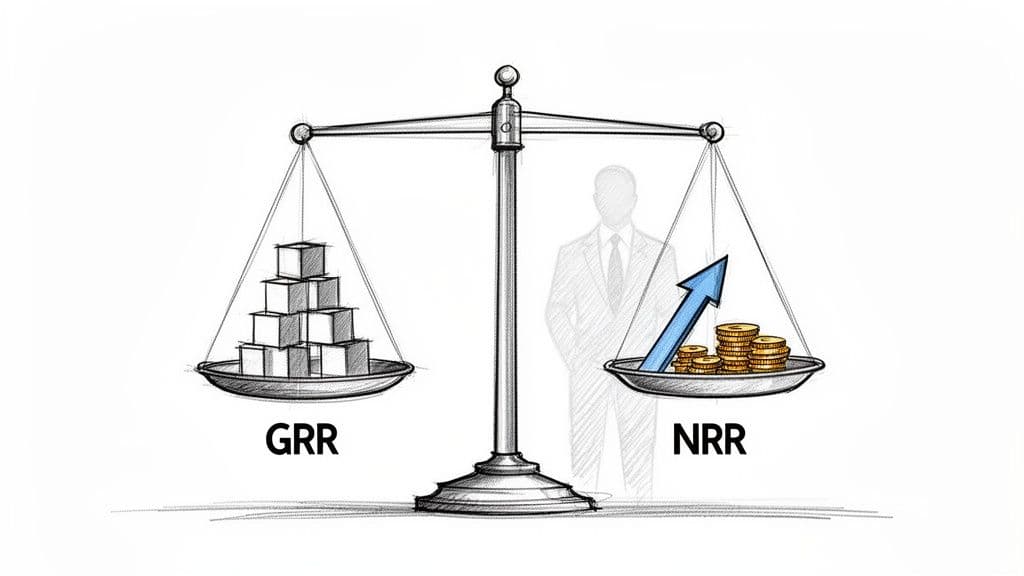
When you're talking to investors, your GRR and NRR are not just data points; they are the narrative of your company's future. While related, these two metrics paint very different pictures.
Gross Revenue Retention (GRR) is your stability metric. It’s the raw, unfiltered measure of your product's stickiness and your ability to prevent revenue loss from churn and downgrades. Think of GRR as the concrete foundation of your revenue. A high GRR proves your core service is valuable and that you’ve mastered how to define customer retention in SaaS.
Net Revenue Retention (NRR), on the other hand, is your growth engine metric. It takes everything from GRR and adds back any expansion revenue from upsells, cross-sells, or price increases. An NRR over 100% is a powerful signal to investors because it shows your business can grow revenue without acquiring a single new customer.
Key Differences at a Glance
For leaders running companies between $500K and $20M ARR, this isn't an academic exercise. It directly impacts your cash flow, investor confidence, and ultimately, your company’s valuation.
| Aspect | Gross Revenue Retention (GRR) | Net Revenue Retention (NRR) |
|---|---|---|
| Primary Question | How well do you keep existing revenue? | How well do you grow existing revenue? |
| Key Components | Starting Revenue - Churn - Downgrades | Starting Revenue - Churn - Downgrades + Expansion |
| Maximum Value | Capped at 100% | Can exceed 100% |
| Strategic Focus | Customer Satisfaction, Product Stability | Upsell/Cross-sell, Value Expansion |
When you're preparing for an audit or a board meeting, NRR almost always steals the spotlight. Why? Because it tells the full story: retention plus growth. But don't be fooled. Savvy investors look at GRR first to see if the foundation is solid. You absolutely need both. GRR proves you have a product customers don't want to leave. NRR proves you have a strategy to make those happy customers even more valuable over time.
Calculating Gross Revenue Retention: Your Stability Metric
Gross Revenue Retention (GRR) is the bedrock metric for your business. It offers a pure, unfiltered look at your ability to hold onto the revenue you’ve already earned from your existing customers. Think of it as your company’s stability score—it tells you how sticky your product is, completely ignoring any new sales or expansion revenue.
This metric is intentionally harsh. It doesn’t let you hide churn or downgrade problems behind impressive upsell numbers. GRR answers one critical question: what percentage of your recurring revenue did you successfully keep from the start of a period to the end?
The GRR Formula and What It Excludes
The calculation for GRR is straightforward. You start with your recurring revenue at the beginning of the period and then subtract any revenue you lost from customers who canceled (churn) or reduced their subscription level (downgrades).
The formula is: GRR = (Starting MRR - Churn MRR - Downgrade MRR) / Starting MRR
It’s crucial to understand what this formula deliberately leaves out:
- New Customers: Revenue from newly acquired customers is completely ignored.
- Expansion Revenue: Any upsells, cross-sells, or add-ons from existing customers are not included.
This exclusion is the entire point. GRR isolates your retention capability, making it a powerful indicator of your core product-market fit and customer satisfaction. A high GRR tells your board and investors that the foundation of your business is solid.
A Worked Calculation Example
Let’s put this into practice with a realistic example for a SaaS company. Imagine your business starts the month with $100,000 in Monthly Recurring Revenue (MRR).
Over the course of the month:
- You lose one client who was paying $5,000/month (Churn MRR).
- Another client reduces their service package, dropping their monthly payment from $4,000 to $2,000, resulting in a $2,000 loss (Downgrade MRR).
Here’s the step-by-step breakdown.
GRR Calculation Example (Monthly)
| Metric | Value | Notes |
|---|---|---|
| Starting MRR | $100,000 | The recurring revenue at the beginning of the month. |
| Churn MRR | -$5,000 | Revenue lost from a customer who canceled completely. |
| Downgrade MRR | -$2,000 | Revenue lost from an existing customer reducing their spend. |
| Retained MRR | $93,000 | $100,000 - $5,000 - $2,000 |
| GRR Calculation | 93% | $93,000 / $100,000 |
Your Gross Revenue Retention for the month is 93%. This means you successfully retained 93 cents of every dollar of recurring revenue you started with. This number is a direct reflection of your ability to prevent revenue leakage, which should be a key focus for any effective SaaS churn analysis. This unvarnished view of retention health can't be masked by growth, which is why resources from providers like Stripe emphasize its importance for a clean financial picture.
Calculating Net Revenue Retention: Your Growth Engine Metric
If Gross Revenue Retention (GRR) is about defense—holding onto the revenue you already have—then Net Revenue Retention (NRR) is all about offense. It’s the metric that measures your internal growth engine. NRR tracks the total revenue change from your existing customer base, factoring in every churn, downgrade, and, most importantly, every expansion.
NRR answers the question every investor and board member wants to know: once you land a customer, can you actually grow their value over time? A strong NRR is definitive proof that your business model isn't just sticky; it's financially efficient and capable of growing even if you don't sign a single new customer.
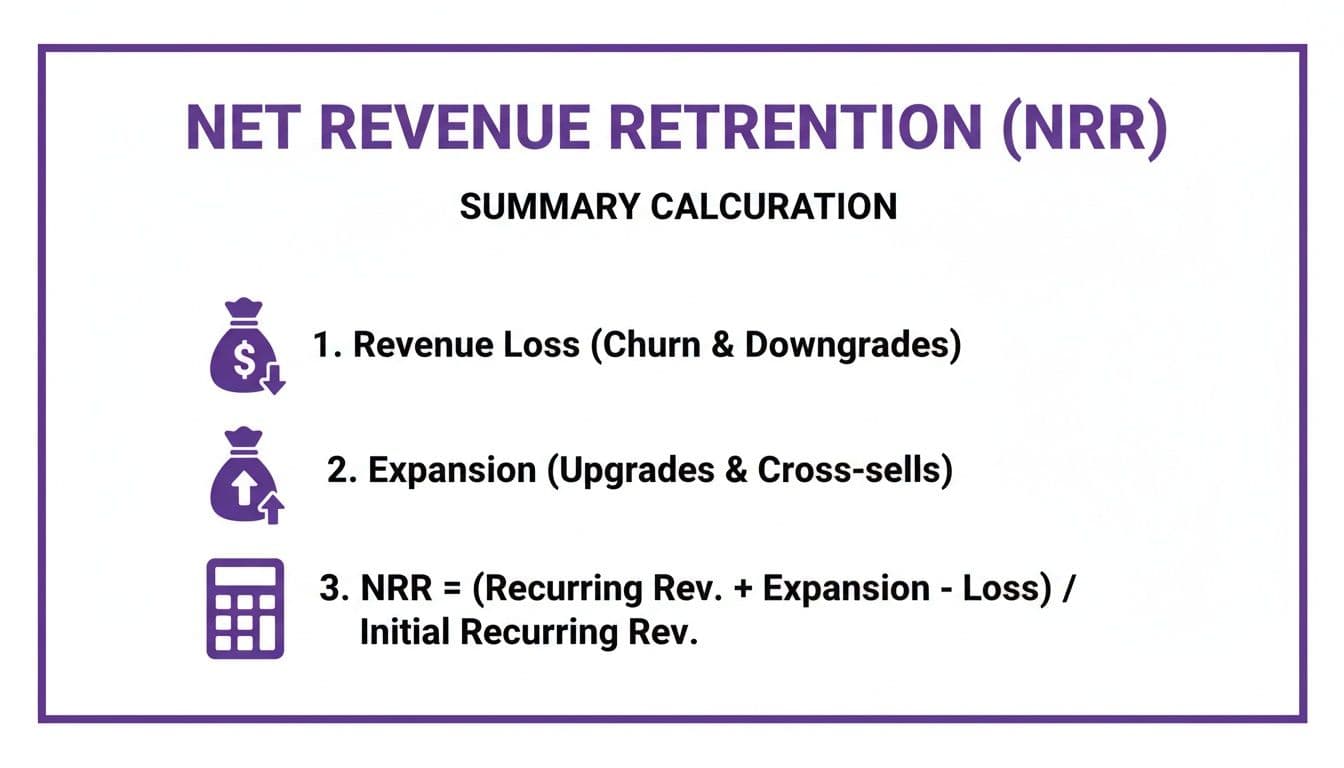
The NRR Formula and Its Components
The formula for NRR builds directly on GRR but introduces a powerful positive force: expansion revenue. This is all the new revenue you generate from existing customers through upsells, cross-sells, new user seats, or pricing increases.
The formula looks like this:
NRR = (Starting MRR - Churn MRR - Downgrade MRR + Expansion MRR) / Starting MRR
An NRR over 100% is the SaaS gold standard. It signals that expansion revenue from happy customers is outstripping any revenue loss from churn and downgrades.
A Worked Calculation Example
Let's pick up where our GRR calculation left off. You start the month with $100,000 in Monthly Recurring Revenue (MRR).
You experienced the same revenue hits:
- $5,000 in Churn MRR from a customer who canceled.
- $2,000 in Downgrade MRR from a client who reduced their plan.
But this month, your customer success and sales teams were on fire. They also generated $15,000 in Expansion MRR from existing customers who upgraded their plans or bought new add-on services.
"NRR is the one metric that shows the health of your customer base and the growth potential of your company in one number." — David Skok, General Partner at Matrix Partners
Here’s how the NRR math plays out with these new numbers.
NRR Calculation Example (Monthly)
| Metric | Value | Notes |
|---|---|---|
| Starting MRR | $100,000 | Revenue at the start of the month. |
| Churn MRR | -$5,000 | Revenue lost from a customer who canceled. |
| Downgrade MRR | -$2,000 | Revenue lost from a customer reducing their spend. |
| Expansion MRR | +$15,000 | New revenue from existing customers upgrading. |
| Ending Retained MRR | $108,000 | $100,000 - $5,000 - $2,000 + $15,000 |
| NRR Calculation | 108% | $108,000 / $100,000 |
Your NRR for the month is 108%. This tells a powerful story. Despite losing $7,000 from churn and downgrades, you more than made up for it with $15,000 in expansion. The result? Your existing customer base actually grew by 8%.
This is a successful "land and expand" strategy in action, a concept worth digging into by reading about Mastering Net Revenue Retention for Sustainable Growth. This metric is directly tied to your Annual Recurring Revenue growth, acting as a massive tailwind for your top-line numbers. For investors, an NRR above 100% is the ultimate proof that your product is essential and that you've built a scalable, capital-efficient growth machine.
The Strategic Difference Between GRR And NRR
Calculating Gross Revenue Retention (GRR) and Net Revenue Retention (NRR) is just the first step. The real strategic insight comes from comparing them side-by-side. The spread between your GRR and NRR is a powerful diagnostic tool—it reveals exactly where your product is winning and where your go-to-market strategy is falling short.
Think of GRR as your "defense" and NRR as your "offense." GRR measures how well you defend your existing revenue from churn and downgrades. NRR shows how effectively you go on offense to expand that revenue base through upsells and cross-sells. The relationship between these two numbers is one of the most important narratives in your business.
GRR vs NRR: A Strategic Comparison
The interplay between GRR and NRR paints a clear picture of your operational reality. Each combination points to a different business scenario, demanding a specific response from your product, sales, and customer success teams. Understanding the pattern your business fits is the key to taking targeted, effective action.
| Aspect | Gross Revenue Retention (GRR) | Net Revenue Retention (NRR) |
|---|---|---|
| What It Measures | Your ability to retain existing customer revenue, ignoring all expansion. A pure measure of product stickiness and customer satisfaction. | Your ability to retain and grow revenue from existing customers, including all expansion. A measure of growth momentum and customer value creation. |
| The Story It Tells | "Is our core product valuable enough that customers stick around, even without any new features or upsells?" | "Are we creating so much value that customers are willing to spend more with us over time?" |
| Primary Ownership | Product and Customer Success. A high GRR is the result of a sticky product, great onboarding, and proactive support. | Sales and Customer Success. A high NRR reflects an effective land-and-expand model and a success team that identifies and closes expansion opportunities. |
| Investor View | An investor sees this as the floor—the fundamental health of your revenue. A high GRR signals a durable business with low churn risk. | An investor sees this as the ceiling—the potential for capital-efficient growth. High NRR proves your model can scale without relying solely on new customer acquisition. |
From Metrics To Action: Decoding The Scenarios
Let's walk through two common—and often misunderstood—scenarios to see how this plays out in the real world.
Scenario 1: High NRR, Low GRR (The "Leaky Bucket")
This is a classic problem, often masked by a heroic sales and success team.
- The Numbers: Imagine a GRR of 80% and an NRR of 115%.
- The Story: That low GRR means you're losing a staggering 20% of your revenue to churn and downgrades. But your teams are so good at upselling the customers who do stay that you still grow the cohort's revenue by 15%.
- The Red Flag: This model is not sustainable. You're covering up a fundamental product or customer-fit problem with aggressive expansion sales. Constantly refilling a bucket that’s leaking 20% of its contents is exhausting and expensive. Investors see this as a house of cards.
- Your Action Plan: Forget about expansion for a minute. Your top priority is to diagnose the churn driving down your GRR. Your product and customer success leaders need to dig in immediately. Are you selling to the wrong customers? Is your onboarding process failing? Is a competitor solving the core problem better?
Scenario 2: High GRR, Stagnant NRR (The "Trapped Value")
Here, you have the opposite problem. You've built a product that customers love and won't leave.
- The Numbers: Think of a business with a GRR of 98% and an NRR of 101%.
- The Story: Your product is incredibly sticky—you only lose 2% of your revenue to churn. That’s best-in-class. But your NRR shows you’re only generating 3% in expansion to offset that loss.
- The Red Flag: You have a loyal, captive audience but no clear path to grow their spend. You are leaving a massive amount of money on the table. To an investor, this signals that your growth potential is capped and entirely dependent on costly new customer acquisition.
- Your Action Plan: It's time to build an expansion engine. This means developing a real strategy around pricing and packaging. Introduce tiered pricing, build valuable add-on features, and train your customer success team to move from a reactive support role to a proactive, value-selling function. Digging into other SaaS financial metrics that matter can provide a broader framework for this.
As you can see, NRR is all about balance. It shows the net effect on your revenue base after the negative force of churn is countered by the positive force of expansion.
What Are Good GRR And NRR Benchmarks
So you’ve calculated your Gross Revenue Retention (GRR) and Net Revenue Retention (NRR). Now for the real question: are those numbers any good? Without benchmarks, your retention metrics are just numbers on a spreadsheet. You're flying blind, unable to set realistic targets or tell a compelling story to your board and investors about your performance.
The first thing to understand is that "good" is entirely dependent on who you sell to. Companies serving small-to-midsize businesses (SMBs) will always have a tougher time with retention than those selling to large enterprises. It's a fundamental market reality, and your goals need to reflect it.
SaaS Benchmarks By Customer Segment
For SaaS companies, the gap in retention between SMB and Enterprise customers is massive. Enterprise clients are just stickier. Their switching costs are higher, their budgets are bigger, and they have more room to expand. This reality shows up clearly in the data. According to the 2024 SaaS Benchmarks report from OpenView, a venture capital firm deep in B2B software, what's considered "elite" performance changes dramatically based on your target customer.
"Your GRR shows your ability to retain the customers you have, but your NRR shows your ability to grow with them. Investors want to see both, but NRR over 100% proves your business has a built-in growth engine that’s highly capital efficient." — Jason Berwanger, Finance Executive and Entrepreneur
Here’s a breakdown of what "Good" (median) and "Elite" look like.
| Customer Segment | Median GRR | Elite GRR | Median NRR | Elite NRR |
|---|---|---|---|---|
| SMB Focus | 80% | >90% | 100% | >110% |
| Enterprise Focus | 90% | >95% | 110% | >125% |
Look closely at that table. An enterprise-focused SaaS company with 90% GRR is just average. But an SMB-focused company hitting that same 90% GRR is performing at an elite level. Context is everything.
Benchmarks for Service-Based Businesses
If you run a digital agency or a professional services firm, the benchmarking data isn't as standardized as it is in SaaS. But the core principles are identical. Keeping clients is paramount, and your ability to grow existing accounts is a powerful sign of a healthy business. Service contracts are often project-based or have scopes that fluctuate, so you can expect GRR and NRR to be a bit more volatile.
- Good Performance: A solid services firm should be aiming for a client renewal rate that keeps GRR above 85%. Your NRR needs to hit at least 100%, which proves you can consistently find enough follow-on work to make up for any client churn.
- Elite Performance: The best agencies and consultancies push their GRR over 90% and their NRR above 115%. They achieve this by making themselves indispensable, systematically uncovering new projects, and expanding their footprint within their best accounts.
Understanding these benchmarks is a crucial part of mastering your company's financial narrative. To dig deeper into the numbers that drive value, check out our complete guide on the SaaS unit economics metrics that actually matter.
Critical Pitfalls And Red Flags In Retention Metrics
Getting the math right on GRR and NRR is only half the battle. If you’re making common reporting mistakes, your metrics are worse than useless—they actively destroy your credibility with investors and can kill a deal.
The single most dangerous error is including new customer revenue in a retention cohort. By definition, GRR and NRR measure your performance with an existing customer base. The moment you pollute a cohort with revenue from customers acquired after the period’s start date, your numbers become meaningless. Another critical mistake is misclassifying revenue. Confusing one-time service fees with recurring revenue or failing to properly track usage-based billing overages will dramatically distort your numbers. This is especially true for companies navigating ASC 606 revenue recognition standards, which demand a disciplined approach to when you recognize revenue.
Warning Signs Your Board And Investors Will Spot
Your retention metrics are a diagnostic tool for your company's health. When specific patterns emerge, they send clear signals—or red flags—to anyone reading your financials. You need to see these patterns long before your investors do.
"The gap between GRR and NRR is the most telling number on a SaaS P&L. A wide gap tells me you have product problems and a sales-driven culture. A narrow gap tells me you have a great product but might be missing expansion opportunities. I look for a high GRR first, then a higher NRR." — Jason Berwanger, Finance Executive and Entrepreneur
Here are the red flags to watch for in your own reporting:
- A Widening NRR vs GRR Gap: If your NRR is a healthy 110% but your GRR drops from 90% to 80%, you have a serious churn problem. Your sales team is successfully masking a leaky bucket by aggressively upselling your remaining customers. This is an unsustainable growth model that signals a core product or customer satisfaction issue.
- Consistently Declining GRR: A one-month dip can be a fluke. A steady, quarter-over-quarter decline in GRR is a five-alarm fire. It shows your ability to hold onto revenue is eroding, pointing directly to increasing competition, product irrelevance, or a failing customer success function.
- Volatile or Inconsistent Calculations: If your retention numbers swing wildly from month to month without a clear business reason, it screams that your calculation methodology is flawed. Investors will assume you're either incompetent or, worse, trying to hide something. A stable, consistently calculated metric is a sign of operational discipline and builds trust.
Avoiding these pitfalls isn't just about financial hygiene; it's about survival during due diligence. An inaccurate or misleading GRR vs NRR calculation can derail a funding round or an audit, forcing you to restate your financials and severely damaging your reputation. The stakes are far too high to get this wrong.
Your Action Plan to Improve GRR and NRR
Knowing the difference between GRR and NRR is a good start. But metrics are just numbers on a dashboard until you use them to make decisions. It's time to move from diagnosis to action.
First, you can't improve what you don't measure. Make sure your financial system can calculate GRR and NRR cleanly and consistently. This isn't negotiable. It means having a reliable process for separating churn, downgrades, and expansion revenue.
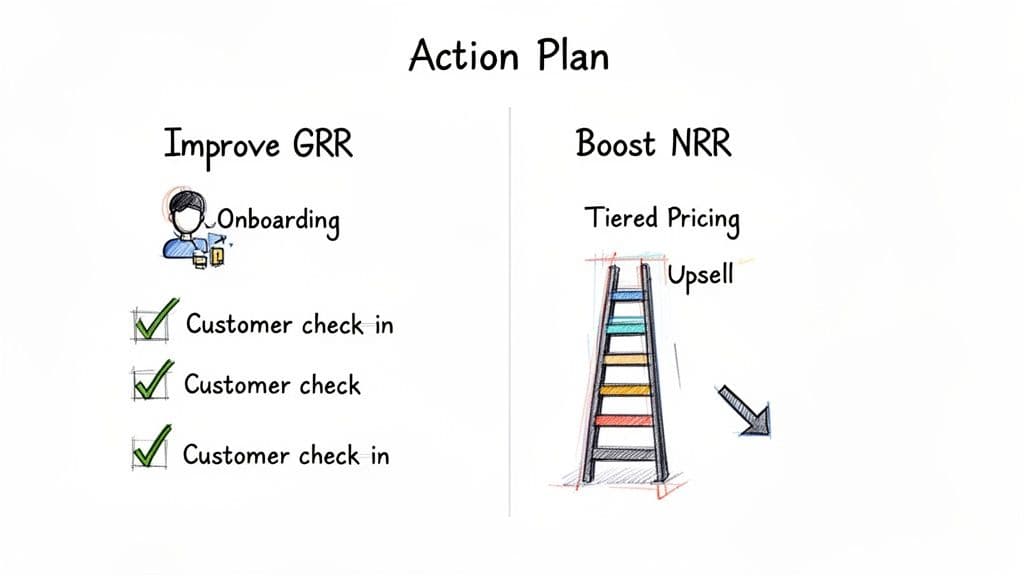
Strategies to Boost Gross Revenue Retention (GRR)
Improving GRR is all about defense. Think of it as plugging the holes in your revenue bucket. The objective is to make your product so essential that customers have no reason to downgrade or leave. Get this right first. A high GRR is the bedrock of a healthy business.
| Strategy | Actionable Next Step |
|---|---|
| Overhaul Your Customer Onboarding | Map the first 90-day customer journey. Identify where clients get stuck and ensure they achieve their first "win" as quickly as possible. |
| Implement Proactive Health Checks | Use product usage data to trigger check-ins with accounts showing low engagement. Shift your Customer Success team from reactive support to proactive partnership. |
| Analyze Churn Feedback | Conduct detailed exit interviews with every lost customer. Look for patterns to find the systemic issue that will prevent you from losing the next ten. |
Tactics to Increase Net Revenue Retention (NRR)
With your GRR stabilized, it’s time to go on offense. Improving NRR is about creating and capturing expansion revenue from the customers you’ve already earned. An NRR over 100% is definitive proof that your business has a powerful, capital-efficient growth engine.
| Tactic | Actionable Next Step |
|---|---|
| Introduce Strategic Pricing Tiers | Design a pricing model with clear value-based tiers that gives customers a natural upgrade path as their needs grow. Move away from a single, flat price. |
| Identify and Act on Upsell Triggers | Pinpoint the specific behaviors or usage milestones (e.g., hitting a user limit) that signal a customer is ready for an upgrade or add-on. Build automated plays around these triggers. |
| Train Your Team on Value-Based Expansion | Train your Customer Success Managers to spot expansion opportunities and lead value-based conversations that feel like strategic advice, not a sales pitch. |
Building a robust financial engine to track GRR, NRR, and other critical metrics is what we do at Jumpstart Partners. Our outsourced accounting services give you the cash flow visibility and pristine financials needed to execute these strategies with confidence. If you’re ready to stop flying blind and start making data-driven decisions that increase your company’s value, schedule a consultation with us today. Learn more at jumpstartpartners.finance.