Financial Operations
What is Operating Cash Flow? A Founder's Guide to the Most Important Metric You're Ignoring
Discover what is operating cash flow, learn how to calculate it, and why it matters for your 2026 business health.
ByJumpstart Partners, CPA, QuickBooks ProAdvisor
··18 min readForget net income for a moment—it doesn't pay salaries or fund your next growth sprint. You're judged on revenue growth, but you live and die by cash. So, what is operating cash flow? It's the actual cash your core business generates, and it’s the real measure of your company's ability to survive and scale.
While your P&L shows profit on paper, Operating Cash Flow (OCF) reveals the unvarnished truth about your company's financial health. For a founder, CEO, or finance leader in a SaaS, agency, or service business, this metric is your true north. It answers one critical question: can your day-to-day operations actually generate enough cash to pay the bills and fuel the future?
Why Operating Cash Flow Is Your Business’s Real Scoreboard
The profit figure on your income statement can be dangerously misleading. It’s often inflated by non-cash accounting entries like depreciation or deferred revenue that don’t reflect the money in your bank account. Operating cash flow cuts straight through that noise.
A positive and growing OCF is the ultimate proof that your business model is sustainable. It's a powerful signal to investors, lenders, and your leadership team that the engine is running smoothly. It shows you have the financial muscle to:
- Fund Growth Initiatives: Invest in new technology or marketing campaigns without running back to investors for more capital.
- Weather Economic Downturns: Maintain operations and keep your team intact when credit markets tighten or sales cycles stretch.
- Make Confident Decisions: Hire that key executive or expand into a new market knowing the cash is there to back the play.
"Profit is an opinion, but cash is a fact. We always start with the Statement of Cash Flows because it tells us the real story of what’s happening inside a business. Positive and growing OCF is the number one sign of a healthy, well-run company." – David Ferguson, Managing Partner at CAPTIV
Understanding this metric is the first step toward gaining total control over your company’s financial destiny. It's the bedrock for building the clear financial dashboards every CEO needs to steer the ship with confidence. By tracking OCF, you move from reacting to financial surprises to proactively building a resilient and scalable company.
How to Calculate Operating Cash Flow Correctly
Knowing how to calculate OCF is where the rubber meets the road. There are two ways to do it: the indirect method and the direct method. Both get you to the same final number, but there's a reason over 98% of public companies use the indirect method—it tells a story, connecting your "on-paper" profit to your actual bank balance.
This is the key relationship you need to understand. While revenue shows market demand and profit signals efficiency, OCF is the real-world output—the cash that actually fuels the business.
Think of it this way: OCF is the financial heartbeat that sustains everything else.
The Indirect Method: A SaaS Company Example
The indirect method is the approach you'll see most often. It starts with the bottom line of your income statement—net income—and works backward to reconcile it to cash. You're essentially translating your "paper profit" into "cash in the bank."
Let's walk through a worked example for "SaaSCo," a fictional company with $3 million in Annual Recurring Revenue (ARR).
Step 1: Start with Net Income This is the bottom line of your P&L statement, your starting point before any cash adjustments.
- SaaSCo's Net Income: $150,000
Step 2: Add Back Non-Cash Expenses Next, you add back any expenses that reduced your net income but didn't actually involve cash leaving your account. The most common examples are depreciation and amortization.
- Depreciation (on servers, office equipment): +$75,000
- Amortization (of capitalized software development costs): +$125,000
Step 3: Adjust for Changes in Working Capital This is the most important—and often misunderstood—step, especially for SaaS businesses. Here, you account for the timing differences between recognizing revenue and expenses versus when cash actually changes hands.
- Increase in Accounts Receivable (-$100,000): You billed clients for $100,000 more than you collected this period. That's profit you've recorded, but the cash isn't in your bank account yet. So, you subtract it.
- Increase in Deferred Revenue (+$350,000): You collected $350,000 in cash from customers for annual subscriptions, but you haven't "earned" that revenue yet. It's cash in the bank, so you add it back.
- Increase in Accounts Payable (+$50,000): You received bills from vendors for $50,000 that you haven't paid yet. This is cash you've effectively held onto, so you add it back to your cash position.
Here's how SaaSCo's OCF calculation comes together:
| Line Item | Amount | Calculation Step |
|---|---|---|
| Net Income | $150,000 | Starting Point |
| Depreciation & Amortization | +$200,000 | Add back non-cash expenses |
| Increase in Accounts Receivable | -$100,000 | Subtract cash not yet collected |
| Increase in Deferred Revenue | +$350,000 | Add cash collected but not earned |
| Increase in Accounts Payable | +$50,000 | Add cash not yet paid to vendors |
| Operating Cash Flow | $650,000 | Final OCF |
Notice the huge difference: SaaSCo's OCF of $650,000 is over four times its net income of $150,000. This is a classic illustration of how the SaaS model, particularly with annual billing, can make a company far more cash-generative than its P&L alone suggests.
The Direct Method: A Digital Agency Example
The direct method is much more like looking at a bank statement. It's conceptually simpler—just add up all the cash that came in and subtract all the cash that went out from your core operations. However, it requires perfect, transaction-level bookkeeping to execute.
To get this right, you have to be able to trace every dollar. Looking at a complete bank statement example can help you visualize exactly where this data comes from.
Let's run the numbers for "AgencyPro," a digital marketing agency with $1.5M in annual revenue.
| Line Item | Amount | Description |
|---|---|---|
| Cash Inflows | ||
| Cash Collected from Clients | +$1,200,000 | Total payments received for services. |
| Cash Outflows | ||
| Cash Paid to Employees | -$700,000 | Salaries, benefits, and payroll taxes. |
| Cash Paid to Suppliers & Vendors | -$250,000 | Ad spend, software tools, contractors. |
| Cash Paid for Rent & Utilities | -$80,000 | Office lease and other overhead. |
| Operating Cash Flow | $170,000 | Final OCF |
This method gives you an unfiltered view of cash movement. While it's less common for formal financial reports, it’s an incredibly useful internal tool for keeping a close eye on your day-to-day liquidity.
If you want a more hands-on approach, our guide to building a cash flow statement template in Excel gives you a practical framework you can start using immediately.
How to Interpret Your OCF and Benchmark Performance
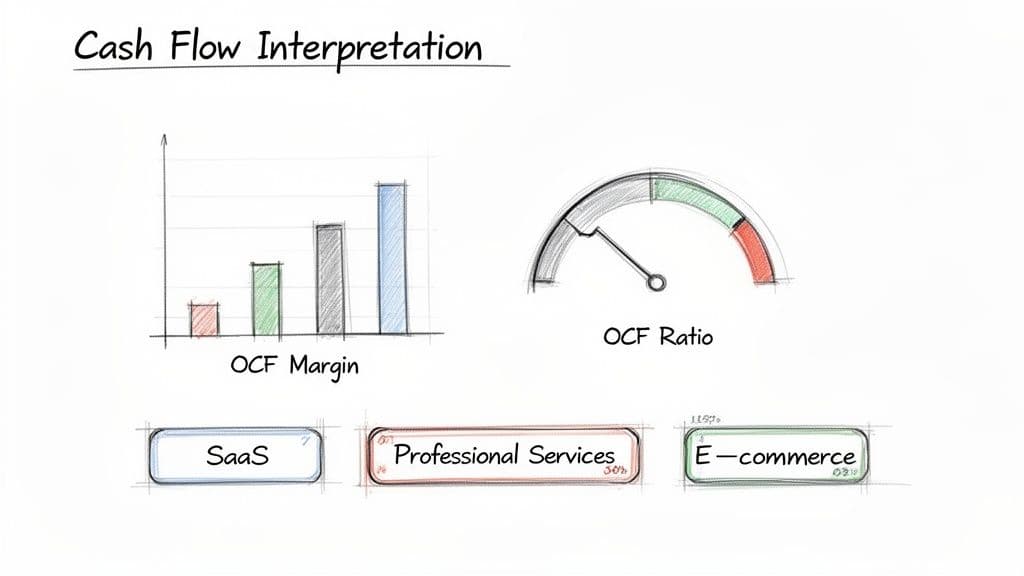
Calculating your operating cash flow is a huge step, but the number itself is just a starting point. To make it truly useful, you need to turn it into ratios that reveal your company's true financial health and operational efficiency.
This is where you move from just reporting the numbers to leading with them. By tracking a couple of key OCF metrics, you can answer the questions that really matter: How much cash does each dollar of revenue actually generate? And can your day-to-day business comfortably cover its immediate bills?
Operating Cash Flow Margin
The Operating Cash Flow Margin is the single best measure of how efficiently your business turns sales into cash. It shows you exactly what percentage of every revenue dollar lands in your bank account from core operations.
Here's the formula: OCF Margin = (Operating Cash Flow / Total Revenue) x 100
Let’s go back to our SaaS company. It generated $650,000 in OCF from $3,000,000 in revenue. That gives it an OCF Margin of 21.7%. For every dollar that came in the door, the business created nearly 22 cents in operating cash. This is a far better indicator of health than profit margin alone.
Operating Cash Flow Ratio
If OCF Margin measures efficiency, the Operating Cash Flow Ratio is a stress test for your company's short-term survival. It answers one simple question: Can you pay your bills due in the next year using only the cash your operations generate?
Here's how you calculate it: OCF Ratio = Operating Cash Flow / Current Liabilities
A ratio above 1.0 is a fantastic sign. It means your core business is throwing off more than enough cash to handle all its short-term debts—like accounts payable, credit card bills, and short-term loans—without having to touch your savings or borrow more money. Anything below 1.0 is a serious warning sign.
Lenders and investors love this ratio because it’s a brutally honest look at your financial stability. Tracking your performance against these essential financial KPIs for small businesses is fundamental to steering your company toward sustainable growth.
Operating Cash Flow Margin Benchmarks for SaaS Companies
What does a "good" OCF margin look like? It depends entirely on your business model. For SaaS companies, cash flow profiles change dramatically based on maturity, billing cycles, and retention.
According to OpenView's 2024 SaaS Benchmarks, cash flow efficiency has become a top priority for investors. Here's how to see where you stack up.
| Company Stage | Needs Improvement (<0%) | Healthy (10-20%) | Excellent (>25%) |
|---|---|---|---|
| Growth Stage (<$20M ARR) | High-burn startups focused on growth at all costs. | Businesses balancing growth with efficiency, often with a mix of monthly/annual plans. | Top-tier performers with strong annual contract penetration and disciplined spending. |
| Scale-Up Stage (>$20M ARR) | Inefficient operations or high churn rates dragging down cash. | Mature companies with strong net retention and optimized cost structures. | Market leaders with dominant pricing power and exceptional operational leverage. |
Source: Adapted from OpenView 2024 SaaS Benchmarks insights on capital efficiency.
Don't just look at the numbers—look at the story they tell. A low margin isn't just a number; it's a symptom of a problem like high customer churn, inefficient operations, or poor collection habits. A high margin shows you've built a well-oiled machine that turns revenue into cash, giving you the fuel to grow.
Common OCF Traps That Sink Growing Companies
Knowing the numbers is just the start. Sidestepping the common cash flow pitfalls is what keeps your business alive. I've seen countless founders get blindsided by predictable cash issues, even when their P&L looked picture-perfect.
The 'Profitable but Broke' Misconception
The most dangerous trap is the "Profitable but Broke" syndrome. Your income statement shows healthy net income, but your bank account is running on fumes. How does this happen? Your cash gets tied up in the business before you can actually use it.
Imagine your digital agency closes a massive $200,000 project. You book the revenue, and the project shows a $40,000 net profit. On paper, you’re crushing it.
But your client has net-90 payment terms. While you wait three months for that cash, you still have to make payroll, pay for software licenses, and cover rent. This timing mismatch between earning profit and receiving cash can drain your reserves fast. This is why getting a handle on your collections process is so critical. You can learn how to tighten up your accounts receivable management practices and speed up cash collection.
OCF vs. Free Cash Flow: What’s the Difference?
Another point of confusion is the distinction between Operating Cash Flow (OCF) and Free Cash Flow (FCF). The difference is simple but absolutely critical.
OCF shows the cash your core business generates. Free Cash Flow shows the cash left over after you've paid for big-ticket investments to maintain or grow your asset base.
FCF is calculated by taking your OCF and subtracting Capital Expenditures (CapEx).
Free Cash Flow = Operating Cash Flow - Capital Expenditures (CapEx)
CapEx includes major purchases that provide long-term value, like new servers, an office renovation, or major software development. Think of it this way: OCF is the cash your engine produces. FCF is the cash you have left in the tank after taking the car to the shop for necessary upgrades.
Red Flags: A Quick Diagnostic Guide
You don’t need to be a CPA to spot cash flow vulnerabilities. Watch for these warning signs in your monthly financials. If you see them, it's time to dig deeper—immediately.
| Red Flag | What It Means | Why It’s Dangerous |
|---|---|---|
| Consistently Negative OCF | Your core operations are burning more cash than they generate. | This is completely unsustainable. You're funding daily business with savings or debt, a path that ends in crisis. |
| OCF Dramatically Trails Net Income | Your profits exist on paper, but the cash isn't hitting your bank account. | This often points to a massive pile of unpaid customer invoices (accounts receivable) or a failure to bill upfront. |
| OCF Ratio Below 1.0 | Your operations aren't generating enough cash to cover your short-term bills. | You're at risk of missing payroll or stiffing suppliers—a direct threat to your company’s survival. |
These warning signs are your business's early-alert system. Ignoring them is a risk no founder can afford to take.
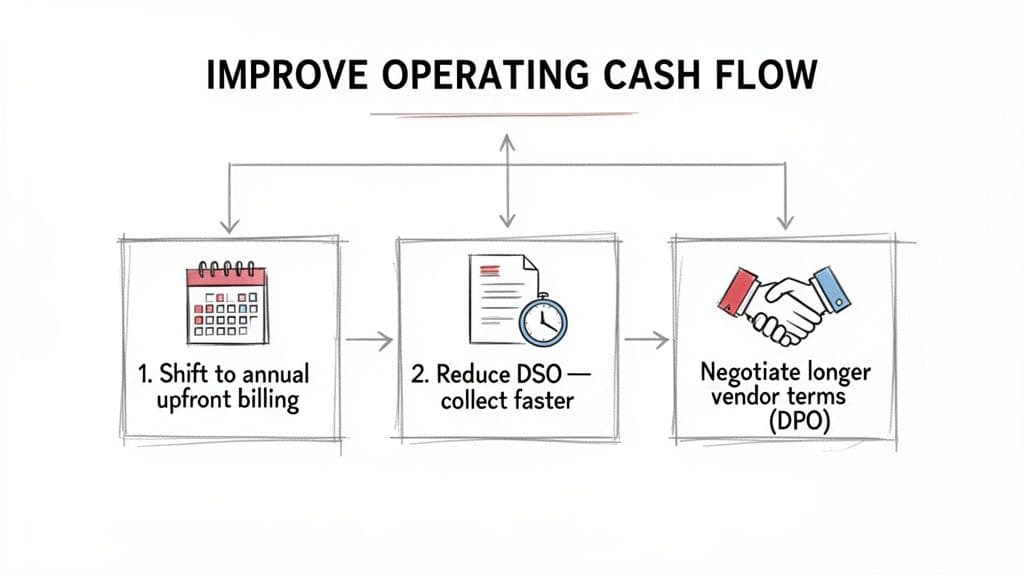
Actionable Strategies to Improve Operating Cash Flow
Knowing your OCF is one thing. Actually improving it is where you take control of your company’s fate. This isn’t about theory—it’s about pulling the right levers to build a more resilient, cash-generating business.
The goal is to actively manage the timing of cash coming in and cash going out. Small, disciplined changes can have a massive impact on your bank balance. For an even deeper look, this CFOs Guide: How to Improve Cash Flow offers more tactical advice.
1. Shift to Annual Upfront Billing
For any SaaS or service business, the single most powerful way to boost OCF is to get paid faster. Shifting clients from monthly to annual upfront billing is the gold standard.
- Action Step: Offer a 5-10% discount for annual prepayment. It's a powerful incentive for customers to give you 12 months of cash today.
- The Impact: This move immediately juices your cash reserves, strengthens OCF, and gives you capital for growth without debt or dilution. Every customer who makes the switch directly improves your cash position.
2. Aggressively Manage Accounts Receivable
Every dollar sitting in accounts receivable is a dollar you've earned but can't use. Reducing your Days Sales Outstanding (DSO)—the average time it takes to get paid—is non-negotiable.
"If operating cash flow consistently exceeds net income, it signals strong earnings quality and disciplined working capital management. A major driver of this is how effectively a company collects what it's owed. Cash tied up in receivables is a direct drag on your OCF." — Upflow.io, "Cash Flow Analysis: Steps, Ratios & Real Examples"
- Action Step: Implement a clear, automated process for invoice follow-ups. Set reminders for 3, 7, and 14 days past due. Make it incredibly easy for clients to pay you online. If you need to dig deeper, our guide on how to improve working capital provides a detailed framework.
3. Negotiate Better Vendor Payment Terms
Just as you want to collect cash faster, you need to slow down how quickly you pay it out. Extending your Days Payable Outstanding (DPO) means you hold onto your cash longer, giving you more operational flexibility.
- Action Step: Review your largest vendor contracts. Request an extension from Net 30 to Net 45 or even Net 60 terms. Frame it as a reasonable request from a reliable, long-term partner. If they hesitate, offer a longer-term commitment in exchange for more favorable payment timing.
By mastering these three strategies, you build a powerful cash-generating engine for your business.
When to Get an Expert to Measure and Improve Your Cash Flow
As your business scales past the first million in revenue, the DIY accounting that got you here becomes your biggest liability. Messy data and incorrect revenue recognition turn your financial reports into fiction, forcing you to make high-stakes decisions with garbage information. This is where an outsourced finance team stops being a cost and becomes a necessity for survival and growth.
Instead of wrestling with spreadsheets, imagine having a dedicated team of US-based, CPA-certified experts who live and breathe this stuff. At Jumpstart Partners, we don't just close your books; we install a financial engine that delivers total clarity.
We provide:
- A Fast, 5-Day Month-End Close: Get accurate, investor-ready financials by the fifth business day of every month. No more waiting weeks for outdated reports.
- Deep Cash Flow Insights: We don't just report the numbers; we interpret them. You'll understand the "why" behind your OCF and get actionable advice to improve it.
- Investor and Audit-Ready Financials: With a SOC 2 Type II-certified process and a 99.8% accuracy guarantee, your books are always prepared for due diligence.
Stop Guessing and Start Leading
As a founder or CEO, your time is best spent on strategy, sales, and building your team—not chasing down receipts or second-guessing your cash balance. An outsourced finance team frees you up to do what you do best, armed with the confidence that comes from knowing your numbers are rock-solid.
"The difference between a growing business and a scalable one is the quality of its financial systems. When you have a professional team managing your books, closing them quickly, and providing real insights, you unlock the ability to make faster, smarter decisions." – Finance Director, Jumpstart Partners
It’s time to stop guessing and gain full control over your company’s financial destiny. Ready to see what true financial visibility looks like? Schedule a free consultation with Jumpstart Partners today and let us show you how we can transform your financial operations in 30 days.
Frequently Asked Questions About Operating Cash Flow
Once founders grasp the basics of OCF, a few key questions always pop up. We hear them all the time from CEOs trying to connect the dots between their P&L and their bank balance. Let's tackle them head-on.
What Is the Main Difference Between Operating Cash Flow and EBITDA?
Founders love to talk about EBITDA, but your investors and your bank care far more about your operating cash flow. They measure two completely different things: EBITDA is a proxy for profitability on paper, while OCF measures the actual cash your operations generate.
EBITDA ignores all the real-world cash movements in a business. It doesn’t see the cash tied up in unpaid customer invoices (Accounts Receivable) or the cash you’ve collected from annual subscriptions but haven’t "earned" yet. OCF accounts for all of it, giving you a brutally honest look at your ability to generate cash. That makes it a far better indicator of your true financial health.
How Often Should I Review My Operating Cash Flow?
You need to review your Statement of Cash Flows, including OCF, every single month. This isn't optional—it's a core part of a proper month-end financial close. If your current accounting process doesn't deliver this, it's broken.
For any business that’s growing fast, navigating a turnaround, or running lean, a monthly review isn't enough. You should be looking at a rolling cash flow forecast weekly. This is how you spot a potential shortfall months before it becomes a crisis, giving you time to act instead of react.
Can My Business Have a Positive OCF but a Net Loss?
Yes, and it’s incredibly common, especially for SaaS companies. This scenario happens when you have large non-cash expenses or billing models that bring in cash faster than you recognize revenue.
Here’s a classic SaaS example: your P&L might show a net loss because you’re amortizing $50,000 a month in capitalized software development costs. But if you bill all your customers for annual contracts upfront, your bank account is flush with cash. That influx of cash from collections will drive a healthy, positive operating cash flow, even while your income statement is technically in the red. This is exactly why OCF provides a truer picture of your company's health than net income alone.
Navigating the nuances of cash flow is a full-time job. With Jumpstart Partners, you get an expert team dedicated to delivering the financial clarity you need to lead effectively. Schedule a consultation today and gain full control of your financial destiny.