Financial Operations
Investor-Ready Financial Forecasting for Startups
Master financial forecasting for startups with our guide on revenue modeling, cash flow, and KPIs. Build an investor-ready plan that drives growth.
ByJumpstart Partners, CPA, QuickBooks ProAdvisor
··23 min readFinancial forecasting is not about gazing into a crystal ball. It is about building a credible, data-driven roadmap that turns your vision into a believable story—one that guides your strategy and wins over investors. You should think of it as your startup's GPS for growth, the tool that shifts you from reactive guesswork to proactive leadership.
Why Accurate Forecasting Is Your Startup's GPS
Trying to scale your business by only looking in the rearview mirror is a recipe for disaster. For any founder running a company between $500K and $20M, relying on past performance alone leads directly to cash crunches, bad hires, and missed opportunities.
A weak forecast is not a theoretical problem. It has real-world consequences, from losing an investor's confidence to making a critical hiring decision based on phantom revenue.
A robust financial forecast is far more than a fundraising checkbox; it is your strategic command center. It is the tool that lets you confidently answer the toughest questions from your board and navigate unexpected market shifts with a clear plan. This is not just about spreadsheets; it is about taking control of your company's destiny.
From Guesswork to Strategic Leadership
A great forecast gives you the power to manage your burn rate, justify new spending, and allocate capital with precision. It is the difference between saying, "we hope to grow" and showing exactly how you will get there.
For instance, a detailed model directly connects your marketing budget to projected ARR, proving the ROI of your growth initiatives before you spend the first dollar.
This proactive approach is essential. According to OpenView's 2024 SaaS Benchmarks, top-quartile companies re-forecast monthly or even weekly. Why? Because it transforms planning from a static annual exercise into a dynamic strategic weapon. That optimism must be grounded in reality. Your solid forecast is the bridge that turns positive sentiment into a fundable, executable plan.
The Foundation of Investor Trust
When you are out raising capital, your financial model is one of the first documents a serious investor will tear apart. A comprehensive guide to fundraising for startups makes it clear: an accurate, defensible forecast is the bedrock of securing funding. It proves you understand the mechanics of your business and have a realistic plan to scale it.
A sloppy model filled with unsupported "hockey stick" projections is a massive red flag. It signals to investors that you have not done the hard work. This is a common misconception—that a wildly optimistic forecast is impressive. It is not. Investors see it as a sign of inexperience.
On the other hand, a well-structured forecast backed by solid assumptions builds immediate credibility. It proves you are a leader who can manage resources effectively and are ready to move from founder to CEO. It also establishes the discipline for strong financial reporting best practices that will serve you for the entire life of your company.
Building Your Forecast From the Ground Up
A powerful forecast is not an academic exercise; it is a strategic weapon built on a solid, data-driven foundation. For you, this means moving past high-level guesses and building a model from the ground up, rooted in your three core financial statements: the Profit & Loss (P&L), Balance Sheet, and Statement of Cash Flows.
The entire process hinges on one non-negotiable element: reliable historical data. Your forecast's credibility is zero without it. This is why deep integrations with your accounting and payment platforms—think QuickBooks, Xero, and Stripe—are absolutely essential. You cannot build a believable future without an accurate picture of your past.
This process is not just about crunching numbers. It is about linking your high-level business goals to the day-to-day strategic decisions you make to achieve them, with the forecast serving as the critical map.
Construct a Driver-Based Revenue Model
Your revenue forecast is the engine of the entire financial model. It is the first thing investors will tear apart, so it has to be defensible. For any SaaS company, digital agency, or professional services firm, this means ditching flimsy, top-down "market share" projections and building a bottom-up, driver-based model.
This approach forces you to connect revenue directly to the operational activities you actually control. You are not just pulling a number from thin air; you are creating a formula based on your real-world sales and marketing funnel.
For example, a SaaS company forecasts new Annual Recurring Revenue (ARR) with a simple but powerful calculation:
| Step | Calculation | Result |
|---|---|---|
| 1. Generate Leads | 1,000 Marketing Qualified Leads (MQLs) | |
| 2. Qualify & Close | 1,000 MQLs x 2% close rate | 20 new customers |
| 3. Calculate New ARR | 20 new customers x $5,000 Average Contract Value (ACV) | $100,000 in new ARR |
This equation grounds your projections in operational reality. Want to double revenue? The model forces you to decide how: Do you need to double your leads, improve your sales team's close rate, or increase your average deal size?
“The fastest way to lose my trust as an investor is to show me a forecast where the numbers are completely detached from the operational reality of how you acquire and serve customers.” — Managing Partner, Growth Equity Firm
The table below gives you a practical look at how these drivers cascade to build a complete revenue picture. It is a clear, logical path from marketing activity to dollars in the bank.
Example SaaS Revenue Build Calculation (Bottom-Up)
| Driver | Metric/Value | Calculation Step | Result |
|---|---|---|---|
| Marketing Qualified Leads (MQLs) | 5,000 / Quarter | Top of funnel input | - |
| MQL-to-SQL Conversion Rate | 20% | 5,000 MQLs * 20% | 1,000 SQLs |
| SQL-to-Close Conversion Rate | 15% | 1,000 SQLs * 15% | 150 New Customers |
| Average Contract Value (ACV) | $10,000 | Average revenue per new customer | - |
| New ARR Forecast | - | 150 New Customers * $10,000 ACV | $1,500,000 |
This bottom-up method transforms your forecast from a wish list into a strategic roadmap. It becomes a powerful tool for aligning your sales, marketing, and finance teams around a single, unified goal. You can see more examples of this in our guide to building a three-year forecast for your small business.
Model Your Costs With Precision
With a defensible revenue model in place, the next step is to forecast your expenses with the same level of rigor. This means breaking down your costs into two primary categories: Cost of Goods Sold (COGS) and Operating Expenses (Opex).
Cost of Goods Sold (COGS)
These are the direct costs required to deliver your product or service. A common and dangerous mistake is underestimating COGS, which artificially inflates your gross margin and presents a misleading picture of your core profitability.
For a SaaS company, COGS typically includes:
- Hosting Costs: Expenses for your servers and infrastructure (e.g., AWS, Azure).
- Customer Support Salaries: The portion of your support and success teams' compensation dedicated to serving existing customers.
- Third-Party Software: Fees for any software embedded directly into your product (e.g., a mapping API or data enrichment service).
Operating Expenses (Opex)
These are all the other costs required to run the business, but they are not directly tied to product delivery. You must categorize them by department to see where the money is really going.
- Sales & Marketing (S&M): This bucket includes salaries for your sales team, commissions, ad spend on platforms like Google or Shopify, and marketing software subscriptions. These are largely variable costs that should scale up or down with your revenue growth.
- Research & Development (R&D): This is primarily the salaries for your engineering and product teams—the people building and improving the product itself.
- General & Administrative (G&A): This covers executive salaries, rent, legal fees, accounting services, and other general overhead. These are mostly fixed costs.
Forecasting these costs accurately means separating your variable costs (like sales commissions, which rise with new deals) from your fixed costs (like rent, which stays constant month-to-month). That distinction is critical for understanding your company's operating leverage and your path to breaking even.
For any startup, profit is a great goal, but cash is what keeps you alive. I have seen countless promising companies with impressive P&L statements go under because they were not paying attention to the one thing that truly matters: the cash in their bank account. A surprise cash crunch is a game-ender, period.
That's why this section is all about mastering the single most critical element of startup survival—cash flow. Your big annual forecast sets the grand strategy, but it is your weekly cash forecast that keeps the lights on.
The 13-Week Cash Flow Model: The Gold Standard
While a 12-month model is great for high-level strategy, it is useless for managing day-to-day liquidity. You need a much shorter-term, tactical view. This is where the 13-week cash flow (TWCF) model comes in. It is the undisputed gold standard for operational cash management.
Why 13 weeks? It gives you a rolling, quarter-long view of every single dollar projected to come in and go out. This is the mechanism that shifts you from reactively checking your bank balance to proactively managing your cash position weeks in advance.
The entire process hinges on one simple truth: your forecast is useless without an accurate, reconciled opening cash balance.
This is not just a best practice; it is a survival imperative. Startups that do not ground their forecasts in reconciled data face a 3x higher failure rate within 18 months due to completely avoidable cash crunches. A recent Numeric study revealed that 80% of FP&A teams make better decisions with real-time reconciled data—it is the foundation of a trustworthy forecast.
Adopting a weekly discipline of updating this model provides the visibility you need to navigate the early stages. You can explore the mechanics in our complete guide to the 13-week cash flow model.
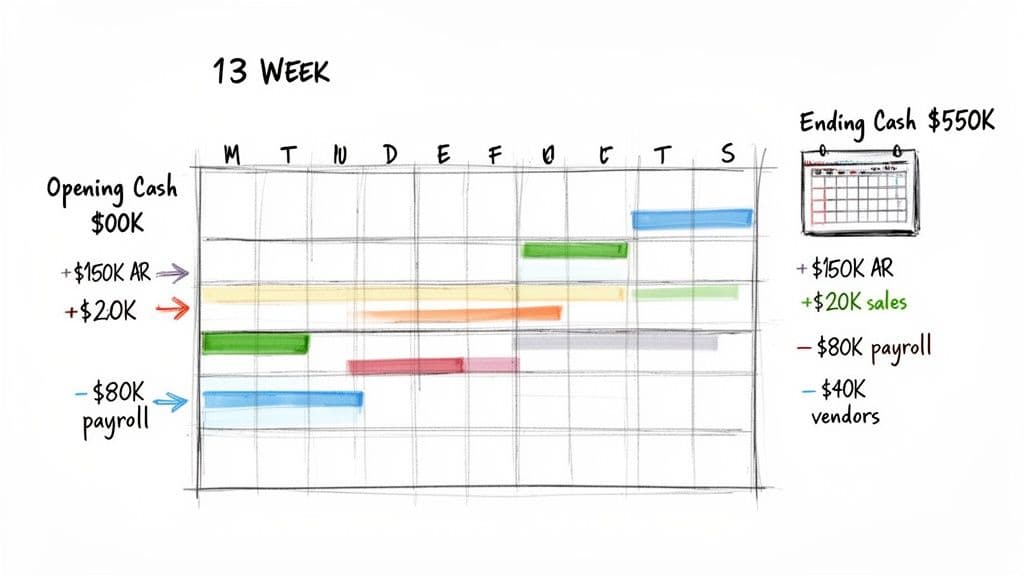
A Practical Cash Flow Calculation
Let's make this real. This is not a theoretical exercise; it is the exact calculation you should be running every single week.
Imagine you start the week with $500,000 in the bank. You project the following cash movements:
-
Cash Inflows:
- Accounts Receivable (AR) Collections: $150,000
- New Cash Sales (credit cards, Stripe payments): $20,000
- Total Cash In: $170,000
-
Cash Outflows:
- Payroll & Benefits: $80,000
- Vendor & Software Payments: $40,000
- Total Cash Out: $120,000
Here’s how the math plays out in your forecast:
| Description | Amount |
|---|---|
| Opening Cash Balance | $500,000 |
| Plus Total Cash Inflows | $170,000 |
| Less Total Cash Outflows | ($120,000) |
| Net Cash Flow for the Week | $50,000 |
| Ending Cash Balance | $550,000 |
This simple weekly rhythm acts as your early warning system. It will flag a potential shortfall weeks or even months out, giving you time to act—whether that means accelerating a collection, delaying a non-critical payment, or drawing on a line of credit.
“I’ve seen more companies die from a surprise cash crisis than from competitive pressure. A weekly cash forecast isn’t micromanagement; it's basic corporate hygiene.” — Veteran Venture Capitalist
Calculating Runway The Right Way
One of the most common—and dangerous—mistakes founders make is calculating runway with a simplistic formula like Cash Balance / Average Monthly Burn. This approach is deeply flawed because it ignores timing, seasonality, and variability.
Your burn rate is not a static number. It fluctuates with hiring, one-off expenses, marketing campaigns, and sales cycles.
The only accurate way to calculate runway is to use your forward-looking cash flow forecast. Project your cash balance month by month until it hits zero (or whatever you have set as your minimum required cash balance). The number of months it takes to hit that floor is your true runway.
Warning Signs: Common Cash Flow Pitfalls
A cash forecast can create a false sense of security if you are not careful. Be on high alert for these common mistakes that I have seen derail even the most promising startups:
-
Forgetting Payroll Taxes: You pay your employees, but you also owe payroll taxes to the government. Forgetting to factor in these payments creates a sudden, significant cash drain that can catch you completely off guard.
-
Ignoring Annual Renewals: That big annual software contract or insurance premium can feel like a bombshell if it is not in your forecast. Track every major renewal and build it into your plan so there are no surprises.
-
Lumpy AR Collections: Do not just assume all your invoices will be paid on time. A more realistic model for a B2B business might be to forecast collections based on probability (e.g., expect to collect 95% of current invoices, 70% of invoices that are 30-60 days past due, and so on).
-
Confusing Cash with Revenue: This is a classic, especially for SaaS companies. A signed annual contract is great, but it is revenue recognized over 12 months. The cash might all arrive on day one, or it might be paid quarterly. Your cash forecast must reflect the actual timing of cash movements, not the accounting treatment of revenue.
A single forecast is a single point of failure. In a world where the only constant is volatility, betting your entire company on one set of assumptions is a massive strategic risk.
For any serious founder, financial forecasting is not about predicting the future with perfect accuracy. It is about preparing for multiple possible futures so you are never caught flat-footed.
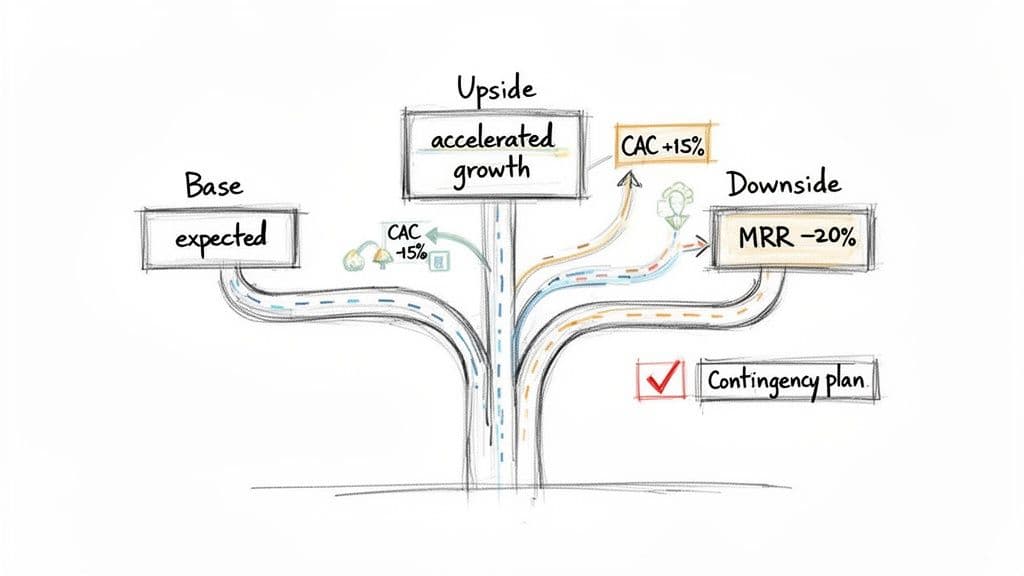
This is where scenario analysis stops being a "nice-to-have" and becomes non-negotiable. It is the process of building resilience directly into your financial plan by modeling three essential outcomes: a 'Base Case,' an 'Upside Case,' and a 'Downside Case.'
This is not about fortune-telling. It is about understanding the specific financial impact of different possibilities so you can map out your contingency plans before you need them. When you present these scenarios, you show investors you are a credible leader who has thought through the risks and is ready to navigate them.
Building Your Three Core Scenarios
Each scenario comes to life by toggling the key assumptions in your financial model. The entire point is to see how sensitive your core outcomes—like revenue, profitability, and cash runway—are to shifts in your most important business drivers.
-
Base Case: This is your most likely reality, built on the driver-based assumptions we have been discussing. It is your operating plan, what you are committing to the board you can deliver. It should be ambitious yet grounded.
-
Upside Case: What happens if everything goes right? A marketing campaign wildly over-performs, a new feature drives unexpected expansion revenue, or a key competitor stumbles. In this scenario, you might model a 10-15% improvement in your core drivers, like sales conversion rates or customer retention.
-
Downside Case: This is the most important scenario for risk management and probably the one your board will care about most. What if headwinds appear? A key client churns, dropping your MRR by 20%. Sales cycles lengthen, or your customer acquisition costs (CAC) spike by 15%. This model tells you exactly when the alarms should go off.
The data backs this up. According to a Fathom survey, 80% of finance pros endorse scenario modeling for real-time adaptability, noting that spreadsheets become unmanageable for scaling startups. This is especially true for businesses in the $500K–$20M range, where variables multiply almost overnight. You can see more on how modern companies are using these strategies in the full Fathom report on financial planning trends.
A Practical Scenario Analysis Example
Let's make this real. The table below illustrates how key metrics and outcomes can shift across different scenarios for a SaaS company, helping you prepare for uncertainty.
SaaS Scenario Analysis Example
| Metric | Downside Case | Base Case | Upside Case |
|---|---|---|---|
| Assumption: Annual Churn Rate | 15% | 10% | 7% |
| Assumption: Sales Conversion | 1.5% | 2.0% | 2.5% |
| Outcome: Year-End ARR | $4.2M | $5.0M | $5.9M |
| Outcome: Cash Runway | 9 Months | 14 Months | 22 Months |
| Action Plan | Freeze hiring, cut marketing spend | Execute plan, monitor hiring | Accelerate hiring, increase marketing spend |
Look closely at the table. The real power here is in the "Action Plan" row. This is where your forecast connects directly to strategic decisions.
If you start seeing your metrics trend toward the Downside Case, you do not panic—you already have a playbook for how to react. This is how you move from firefighting to focused execution. It also forces you to think through the inputs required to hit your targets, a core concept we cover in our break-even analysis guide for startups.
This kind of structured thinking proves to your board and investors that you are not just an optimist. You are a pragmatist prepared to lead through the inevitable uncertainty.
Red Flags: Common Mistakes That Kill Investor Confidence
Even the sharpest founders make forecasting mistakes. But these are not just spreadsheet errors—they are credibility killers. An airtight financial forecast tells a story an investor can trust. A flimsy one is an immediate red flag, signaling a deep disconnect between your vision and the operational realities of your startup.
Think of this section as your defense against the brutal questions you will get in a pitch meeting. It is a pre-mortem for your financial model, designed to spot and fix the weak points before a VC does it for you.
The Unbelievable Hockey Stick
We have all seen it. The infamous "hockey stick" projection. A few months of modest growth, then a sudden, dramatic explosion skyward. While ambitious, these charts are usually fantasies, completely detached from a bottom-up plan that explains how you will achieve that inflection point.
Investors see this pattern every single day. Their first question will be: “What specifically happens here to cause this sudden growth?”
If your answer is not backed by a concrete, calculated operational plan—like tripling your sales team, unlocking a new and tested marketing channel, or a proven product-led growth loop kicking in—you have just lost the room.
Confusing Bookings, Revenue, and Cash
For any SaaS business, mixing up these three terms is a fatal flaw. They are not interchangeable. Getting them wrong does not just break your forecast; it violates fundamental accounting principles like ASC 606.
- Booking: A customer commits by signing a $12,000 annual contract. That is a booking.
- Revenue: With accrual accounting, you only recognize that revenue over the 12-month contract. That is $1,000 in revenue each month.
- Cash: If the customer pays the full $12,000 upfront, your cash balance jumps by $12,000 in Month 1. But your revenue for that month is still just $1,000.
Confusing these leads to disastrously wrong calculations for burn rate and runway. To an investor, it is a clear sign of financial indiscipline.
Other Red Flags That Kill Confidence
Beyond those major conceptual blunders, a handful of smaller mistakes can poison your credibility. Keep a close watch for these common red flags:
-
Underestimating COGS: Gross margin is a core signal of your business’s scalability. Too many founders inflate it by conveniently leaving key costs out of their Cost of Goods Sold. For a SaaS company, your COGS must include hosting costs (like AWS or Google Cloud), the salaries of your customer support and success teams, and any third-party software embedded in your product.
-
Ignoring Seasonality: Very few businesses grow in a perfectly straight line. Digital marketing agencies often see a major slowdown in December. E-commerce brands might pull in 40% of their annual revenue in Q4 alone. If your forecast does not reflect these predictable market rhythms, it shows you do not truly understand your own business.
-
A Disconnected Model: Your financial model cannot exist in a vacuum. If your marketing plan calls for generating 5,000 new leads a month, but your financial model only budgets for a marketing team of two people, it is a fantasy. The financials must be a direct numerical translation of your operational plan, period.
To get better at this and avoid repeating errors, you must perform regular variance analysis. The entire goal is to Master SaaS Financial Variance by systematically comparing your actual performance to what you projected. This discipline is what separates the founders who learn from their mistakes from those destined to repeat them.
When to Stop DIY-ing Your Financial Forecasts
As a founder, your most valuable asset is your time. So, is spending a dozen hours every month wrestling with a financial model the best use of that time? Almost certainly not.
The back-of-the-napkin or DIY spreadsheet model works fine in the early days. But it has a shelf life. Sooner or later, you will hit a wall where your homegrown forecast becomes more of a liability than an asset. Deciding to bring in expert help is a critical inflection point for any startup ready to scale.
Recognizing the signs that you have outgrown your model allows you to act before financial management starts choking your growth.
The Triggers That Tell You It’s Time
These are not just minor headaches; they are clear signals that your company’s complexity has outpaced your internal finance capabilities. If any of these sound familiar, it is time to seriously consider outsourcing.
-
You are heading into a fundraise. This is the big one. Investors will rip a founder-built spreadsheet to shreds during due diligence. They need to see an auditable, institutional-grade model, not a collection of best-guess formulas.
-
You’ve crossed the $1M revenue mark. Business complexity explodes after you hit seven figures. Suddenly, things like revenue recognition, cohort analysis, and accurate cash management become far more complicated. What worked at $500K ARR will break at $1.5M.
-
You spend more time in Excel than on strategy. Are you spending your Sunday nights updating your forecast instead of talking to customers or leading your team? If so, you have become your own bookkeeper, and that is a massive bottleneck.
When you hit these points, a strategic finance partner stops being a "cost" and becomes a direct investment in your company’s future valuation and operational stability.
Finding the Right Partner for Your Stage
Not all financial help is the same. A bookkeeper logs daily transactions. A controller oversees the accounting process. Both are essential, but they are not who you call to build a forward-looking financial engine.
A true strategic partner, like a fractional CFO for startups, does more than just fill in a template. They deliver an entire finance function. This means building a robust, driver-based financial model, establishing a guaranteed 5-day month-end close, and creating investor-ready dashboards built on clean, reliable data.
"Expecting revenues and preparing for payments as per due dates are the pillars of financial planning.” — Syian Malis, Finance Expert
This level of support moves you beyond just recording what happened. It frees you from the financial weeds and lets you get back to what you do best: growing the company.
Common Questions About Startup Forecasting
Founders always have a handful of great questions when they start digging into their financial models. Let's tackle the most common ones head-on.
How Far Out Should a Startup's Financial Forecast Go?
Think in two time horizons: near-term operations and long-term fundraising.
For running your actual business—making payroll, managing inventory, and reporting to your board—you need a detailed 12-18 month forecast. This is your operational playbook. It must be paired with a rolling, tactical 13-week cash flow model that you live in weekly to manage liquidity. No surprises.
When you are fundraising, investors want to see the big picture. They will expect a 3-5 year forecast. The catch? The first 12-24 months of that long-term view must be meticulously built from the bottom-up. Later years can use broader, top-down assumptions to show your vision for scale. The goal is not to predict 2031 revenue to the dollar; it is to prove you have a credible plan to get there.
What’s the Difference Between a Top-Down and a Bottom-Up Forecast?
A top-down forecast starts with a massive market number (your Total Addressable Market or TAM) and just assumes you will capture a sliver of it. For example: "The global market is $50B, and we will capture 1%, so we will get to $500M in revenue." It is great for painting a grand vision, but on its own, it lacks real credibility.
A bottom-up forecast, on the other hand, is built from the ground up using the actual drivers of your business. Think website traffic, sales conversion rates, sales team quotas, and your specific pricing. Investors overwhelmingly prefer a bottom-up model because it proves you actually understand the mechanics of how your business makes money.
How Often Should I Update My Financial Forecast?
Your forecast must be a living document, not a "set it and forget it" spreadsheet you made six months ago.
Your main operating model needs to be updated monthly. This should happen right alongside your financial close process, where you are comparing what actually happened (actuals) to what you thought would happen (your budget). This is called variance analysis, and it is where the real learning happens.
Your 13-week cash flow model needs even more attention. Update it weekly. This is your early-warning system for any potential cash crunches that could derail the business. This constant cycle of updating and adjusting is what turns forecasting from a chore into your most powerful strategic tool.
Actionable Next Steps:
- Build a Bottom-Up Revenue Model: Connect your forecast directly to your sales and marketing activities.
- Implement a 13-Week Cash Flow Forecast: Update it weekly to manage liquidity proactively.
- Create Three Scenarios (Base, Upside, Downside): Prepare your action plans before you need them.
Ready to move beyond DIY spreadsheets and build a financial engine that impresses investors? Jumpstart Partners delivers the expert bookkeeping, controller services, and strategic forecasting you need to scale with confidence. Schedule a free consultation to see how our US-based, CPA-led team can build the financial foundation your growth depends on.