Financial Operations
The Ultimate 13-Week Cash Flow Forecast Guide for Founders
Master your finances with our 13-week cash flow forecast guide. Learn how to build, analyze, and use this critical tool to drive sustainable growth.
ByJumpstart Partners, CPA, QuickBooks ProAdvisor
··22 min readA 13-week cash flow forecast is a rolling, week-by-week projection of every single dollar moving in and out of your business. If your annual budget is the roadmap, the 13-week forecast is your GPS. It gives you a 90-day tactical window into your real liquidity, helping you stop surprises before they happen and make smarter operational decisions.
Why Your Annual Budget Is Putting Your Business at Risk
You have an annual budget. You review monthly reports. So why are you still getting blindsided by sudden cash shortages that leave you scrambling? You’re not bad at your job; you’re using the wrong tool.
Your annual budget is a strategic document, great for setting long-term goals and aligning resources. But it completely fails to capture the weekly volatility that defines a growing business. It uses accrual accounting, which recognizes revenue when you earn it, not when the cash actually hits your bank account. This mismatch creates a dangerous blind spot.
The Problem with Long-Term Views
A single delayed payment from a major client or an unexpected quarterly tax bill doesn't just look bad on a report—it can derail your operations. These are the details your annual budget misses, but they are exactly what the 13-week cash flow forecast is built to expose.
“The 13-week view helps teams manage the next few weeks in real time, spot tight periods early, and adjust while there is still room to act. It’s valuable when decisions can’t wait until month-end close.” – John Murphy, CFO, Adobe
The forecast forces you to confront the real-time movement of money, giving you the clarity needed to act before a problem explodes into a crisis. For you as a founder or finance leader, this isn't just another report—it's your command center for short-term financial navigation.
From Strategic Guesswork to Tactical Certainty
Shifting your focus from a static annual plan to a dynamic 90-day forecast fundamentally changes how you run your business. You can now:
- Anticipate Cash Crunches: See a potential shortfall coming in Week 8 and take action today, not after the month-end close when it’s too late.
- Time Investments Intelligently: Know exactly when you’ll have the surplus cash to hire that key employee or launch a new marketing campaign.
- Build Credibility: Give investors and lenders a clear, defensible view of your short-term liquidity and operational discipline.
- Improve Decision Making: End the "do we have the cash for this?" debates with a data-driven answer.
Relying too heavily on an annual budget without this dynamic forecasting exposes your business to risks you don't need to take. Some of these risks can be softened by leveraging external support from programs like the Canada Small Business Financing Program.
Ultimately, mastering your short-term liquidity is a core part of effective cash flow management for any small business. By adopting a 13-week forecast, you gain the tactical control needed to execute your long-term vision without getting derailed by predictable surprises.
Building Your First Cash Flow Model That Works
A functional 13-week cash flow forecast isn't about wizard-level financial modeling; it’s about the disciplined work of assembling the right data. The goal is simple: a clear, week-by-week ledger of every dollar moving in and out of your business, giving you a reliable 90-day operational view.
We'll walk through this using a fictional $5M ARR SaaS company as our example. This makes the process tangible, something you can replicate for your own business. First, set a strong, accurate foundation.
For many teams, the first hurdle is just getting existing data into a new system without creating a mess. It's worth knowing how other finance teams import Excel to Google Sheets to ensure you start with a solid base for your forecast.
Gathering Your Core Data Inputs
Everything you need is already in your accounting and payment systems, whether that's QuickBooks, Xero, or Stripe. The trick is pulling the right data and organizing it by when you expect the cash to actually move—not by invoice dates or abstract revenue recognition rules.
Start with your Beginning Cash Balance. This is easy. What is the actual, spendable cash sitting across all your operating bank accounts right now? That number is your Week 1 starting point. Everything else flows from there.
This whole process is about bridging the gap between your big-picture annual budget and the day-to-day cash realities that those high-level plans often miss.
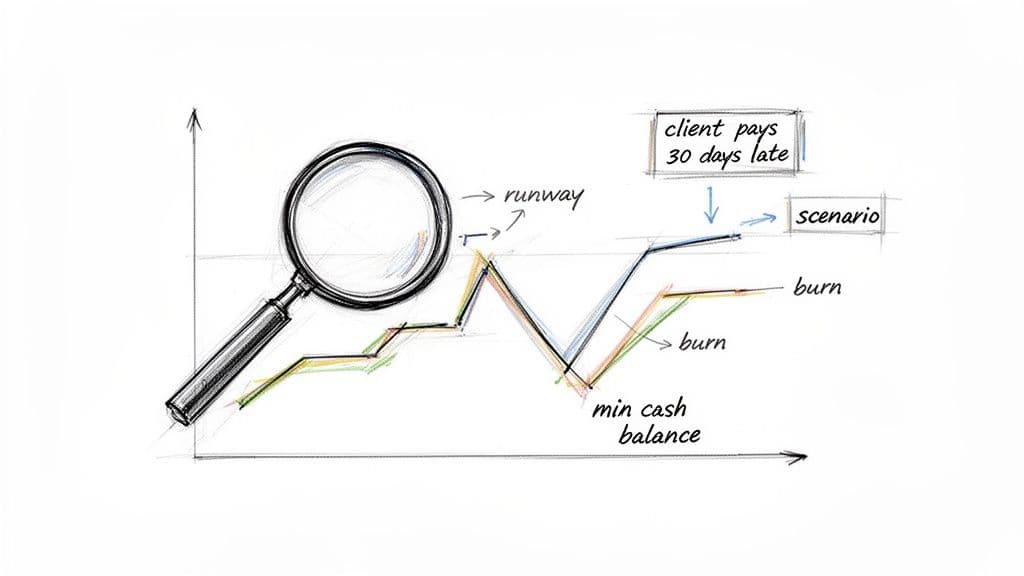
Think of the 13-week forecast as a magnifying glass. It gives you the granular, short-term detail that a 30,000-foot annual budget simply can't provide.
Projecting Cash Inflows Accurately
The number one mistake founders make is wearing rose-colored glasses when it comes to cash receipts. Hope is not a strategy. Your projections must be grounded in historical data.
- Accounts Receivable (AR) Aging: Pull your AR aging report from QuickBooks or Xero. Do not just dump the total into the week it's technically due. Analyze payment histories. If Client ABC consistently pays 15 days late, schedule that cash inflow for when you actually expect to see it.
- Subscription Renewals: For a SaaS company, this is your bread and butter. Use your payment processor data from Stripe to map out all expected subscription payments. Account for known churn and any seasonal dips you've seen in past years.
- New Sales: Be brutally conservative. Your new business cash projections must be based on your historical sales cycle length and cash collection timelines, not just the "closed-won" date in your CRM.
Grounding your inflow projections in reality is what makes this a useful tool instead of a misleading document.
Mapping Your Cash Outflows
The good news is that outflows are generally more predictable than inflows, but timing is still everything. Separate them into fixed and variable buckets to get a clear picture of your baseline cash burn.
Fixed Costs:
- Payroll & Benefits: This is almost always your largest and least flexible expense. Map it out for all 13 weeks, making sure to include payroll taxes and benefits payments on the exact dates they get debited from your account.
- Rent & Utilities: These are straightforward. Schedule them for their specific payment dates.
- Software Subscriptions: Add up all your recurring software costs—think Salesforce, Slack, AWS, etc.
- Debt Payments: If you have any loans or lines of credit, plug in the principal and interest payments.
Variable Costs:
- Vendor Payments (AP): Go through your Accounts Payable aging report. Schedule payments based on their due dates and your established payment terms. Don't pay early unless you must.
- Commissions: If you pay sales commissions, forecast these based on your cash collection assumptions for the deals they closed. Tie the outflow to the inflow.
- Marketing Spend: Plot out your planned ad spend, content creation costs, or any agency fees week by week.
Once you have all your inflows and outflows mapped out, the calculation itself is simple arithmetic. For a deeper dive into the nuances, you can check out our guide on cash flow forecasting best practices.
The Worked Calculation: A SaaS Example
Let’s put this into practice with a simplified table for our $5M ARR SaaS company, showing just the first four weeks. Assume they start with a $300,000 cash balance.
This table shows how the weekly ending cash balance is calculated by tracking all the money coming in and going out.
Sample 13-Week Cash Flow Calculation (First 4 Weeks)
| Cash Flow Item | Week 1 | Week 2 | Week 3 | Week 4 |
|---|---|---|---|---|
| Beginning Cash Balance | $300,000 | $262,500 | $231,000 | $199,500 |
| Cash Inflows | ||||
| AR Collections | $45,000 | $35,000 | $40,000 | $55,000 |
| Subscription Renewals | $30,000 | $28,500 | $28,500 | $32,000 |
| Total Inflows | $75,000 | $63,500 | $68,500 | $87,000 |
| Cash Outflows | ||||
| Payroll & Benefits | ($90,000) | $0 | ($90,000) | $0 |
| Vendor Payments (AP) | ($15,000) | ($20,000) | ($5,000) | ($18,000) |
| Marketing & Software | ($7,500) | ($75,000) | ($5,000) | ($7,000) |
| Total Outflows | ($112,500) | ($95,000) | ($100,000) | ($25,000) |
| Net Cash Flow | ($37,500) | ($31,500) | ($31,500) | $62,000 |
| Ending Cash Balance | $262,500 | $231,000 | $199,500 | $261,500 |
This simple ledger immediately gives you a clear line of sight. You can see the cash dips in Weeks 2 and 3, driven by bi-weekly payroll, before it bounces back in Week 4. This is the exact tactical visibility that lets you make smart decisions ahead of time, transforming your financial management from reactive to proactive.
Finding Actionable Insights in Your Forecast
A completed 13-week cash flow forecast is just a spreadsheet full of numbers. Its real power is in the strategic conversations and decisions it forces you to have. This is where you shift from building a report to actively steering your company's financial health.
First, you need to establish your minimum cash balance. This isn’t a goal; it's your panic button number. It's the absolute floor—the lowest amount of cash your business needs in the bank to function. Your forecast is the early warning system that makes sure you never drop below that line.
By tracking your projected ending cash each week, you'll start to see the rhythm of your business. Maybe you spot a recurring cash crunch in the third week of every month, which lines up perfectly with your bi-weekly payroll. That's no longer a surprise. It’s a predictable pattern you can now plan for.
Key Metrics to Guide Your Decisions
To pull real meaning from the data, you need to focus on a few key performance indicators (KPIs). These metrics turn raw numbers into a clear story about your operational efficiency and financial stability.
- Cash Runway: This is the big one. It tells you exactly how many months you can keep operating at your current burn rate. The calculation is: Total Cash Balance / Monthly Net Burn.
- Burn Multiple: This KPI measures capital efficiency. It reveals how much cash you're burning to generate each new dollar of Annual Recurring Revenue (ARR). The formula is: Net Burn / Net New ARR.
These aren't just abstract figures; they have real-world consequences that investors and lenders fixate on. Knowing how you stack up against industry benchmarks is non-negotiable.
| Metric | Calculation | Healthy SaaS Benchmark | What It Tells You |
|---|---|---|---|
| Cash Runway | Total Cash / Monthly Net Burn | 12+ Months | How long your business can survive without additional funding or revenue. |
| Burn Multiple | Net Burn / Net New ARR | Less than 1.5x | How efficiently you are using capital to drive growth. A high multiple signals inefficiency. |
According to OpenView's 2024 SaaS Benchmarks, a burn multiple below 1.5x is considered good. Anything over 2.0x is a major red flag for investors. Your 13-week cash flow gives you the precise net burn data needed to calculate this on a rolling basis.
Transforming Your Forecast with Scenario Planning
This is where your forecast graduates from a passive report into an active, strategic weapon. Scenario planning is about asking "what if?" and modeling the impact on your cash position. It prepares you for the inevitable bumps in the road—and helps you spot opportunities.
Create three versions of your forecast:
- Best-Case: Assumes your biggest deals close on time and collections are faster than average.
- Realistic-Case: Based on your historical averages for sales cycles and payment behavior. This is your primary working model.
- Worst-Case: Models what happens if a major client pays 30 days late, a key prospect pushes their decision, or a large, unexpected expense hits.
Let’s walk through an example. Your realistic forecast shows a healthy cash balance. But in your worst-case scenario, you model your largest client ($50,000 AR) paying 30 days late. By plugging that one change into your model, you suddenly see your cash balance in Week 8 dips dangerously close to your minimum threshold.
“Building a model is the easy part. The real work is in the weekly discipline of updating it and using it to challenge your assumptions. It transforms finance from a reactive, historical function into a proactive, strategic partner to the business.”
— John Smith, Fractional CFO
With that insight, you don't wait for Week 8. You take action now. You start a collections push on other overdue accounts, delay a non-essential vendor payment, or draw on your line of credit to shore things up. This proactive management is the entire point of the exercise. A detailed guide on cash flow projection can further help in refining these scenarios.
Red Flags to Watch For in Your Forecast
As you review your forecast each week, certain patterns demand immediate attention.
- Declining Ending Cash Balance Week-Over-Week: If your ending cash is consistently lower for three or more weeks, your burn rate is unsustainable.
- Heavy Reliance on a Single Large Inflow: If your solvency for a month depends on one big client payment, you have a huge concentration risk to mitigate.
- Projected Balance Nearing Minimum Threshold: Any projection that brings you within 10-15% of your minimum cash balance in the next 90 days is a signal to act now, not later.
Your 13-week cash flow forecast is more than a financial report; it's a decision-making framework. By identifying your minimum cash balance, tracking key metrics, and running what-if scenarios, you can navigate uncertainty with confidence and turn your financial data into a competitive advantage.
Common Forecasting Pitfalls and How to Avoid Them
Building a 13-week cash flow forecast is straightforward, but a handful of common mistakes can turn a powerful tool into a useless spreadsheet. These aren’t complex modeling errors; they're almost always about mindset and flawed assumptions.
Misconception #1: "Profit Equals Cash"
This is the single biggest mistake we see. Your P&L can show a healthy six-figure profit while your bank account is scraping zero. This happens because accrual accounting recognizes revenue when you earn it, not when the client actually pays you. Your cash flow forecast must be ruthlessly focused on the actual movement of dollars. It’s not about profitability. It’s about liquidity and survival.
Misconception #2: "My Forecast is My Sales Goal"
A cash flow forecast is not a sales goal or a motivational tool. It’s a reflection of reality, grounded in cold, hard data. Basing projections on what you hope will happen is a recipe for disaster.
- Model actual payment behavior. Don't use the invoice due date. If a key client consistently pays 15 days late, your forecast must show that cash arriving 15 days late.
- Apply realistic close rates. Use your historical, data-backed close rates and average sales cycle length—not the aspirational numbers from your sales kickoff meeting.
- A verbal commitment is worth zero. A deal isn't cash until the wire transfer clears.
This disciplined, conservative approach ensures your forecast serves its primary purpose: to be an early-warning system.
Misconception #3: "All Expenses are Created Equal"
It’s tempting to just pull expense numbers from your P&L, but doing so will introduce non-cash items that distort your forecast. Your model must only track the movement of actual dollars.
Make absolutely sure you exclude these common non-cash expenses:
- Depreciation
- Amortization
- Stock-based compensation
These are important for tax and accounting, but they have zero impact on your weekly cash balance.
At the same time, you must account for "lumpy" cash expenses that don't occur monthly. A smooth, predictable expense line is a myth.
| Lumpy Expense Type | Example Scenario & Calculation | Impact if Forgotten |
|---|---|---|
| Annual Insurance | Your $12,000 annual premium is due in Week 7. Do not spread it as $1,000/month; model a single ($12,000) outflow in Week 7. | A sudden, un-forecasted five-figure withdrawal that puts payroll at risk. |
| Quarterly Taxes | Estimated quarterly tax payments of $25,000 are due in Week 11. This must be a specific line item. | An unexpected major cash drain that forces you to dip into reserves or a line of credit. |
| Annual Bonuses | You plan to pay $50,000 in annual performance bonuses in Week 13. This must be in your payroll outflow for that specific week. | A significant hit to your ending cash balance right at the end of your forecast period. |
By accurately mapping these irregular payments, you eliminate the surprises that cause the most financial stress. A great way to find these is to perform a budget variance analysis to see how past unexpected expenses threw off your plans.
Weaving the Forecast Into Your Weekly Rhythm
Your 13-week cash flow forecast isn't a static report. It’s a living management tool. Its power is only unlocked when it becomes the heartbeat of your company’s operational rhythm. This means creating a disciplined, weekly cadence to review, update, and act on its insights.
This isn’t just another meeting. Think of it as your weekly financial command center—where high-level strategy meets on-the-ground reality.
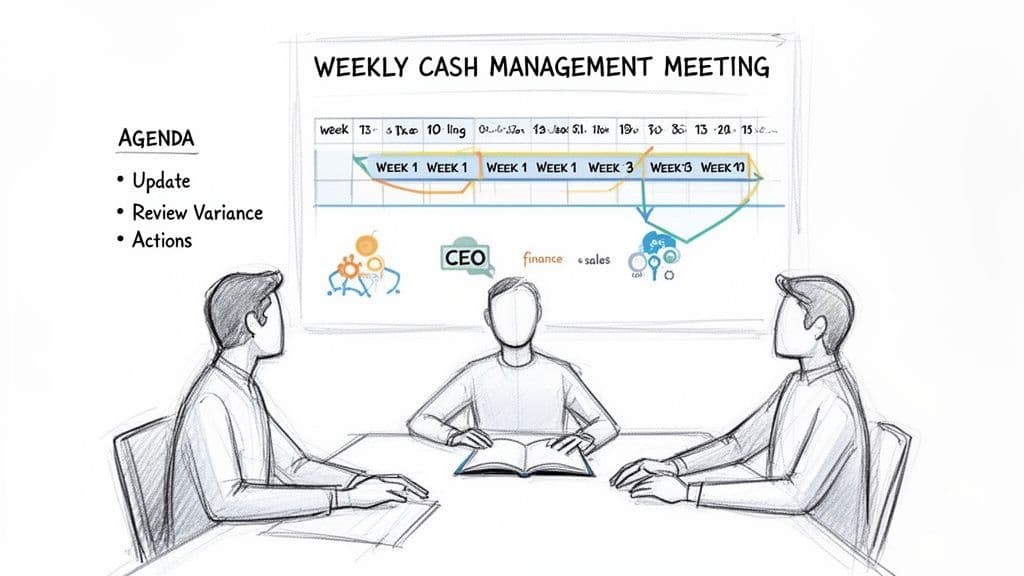
Setting Up the Weekly Cash Meeting
The goal of this weekly huddle is simple: get the leadership team aligned on the company's short-term cash position and make concrete decisions.
- Who Must Attend: The CEO, your finance lead (CFO, Controller, or Finance Manager), and the heads of Sales and Operations. This group covers both sides of the cash equation.
- When to Hold It: Schedule it for the exact same day and time every week. Tuesday morning works well. This gives your finance lead Monday to update the model with the previous week's actuals and leaves the team the rest of the week to act.
- Duration: Keep it tight. This meeting should be 30 minutes, max. A strict agenda is key.
The power of this routine is undeniable. During its 2009 crisis, General Motors used a 13-week forecast to manage over $30 billion in assets and secure $13.4 billion in government loans, a move that helped prevent a total collapse. It’s a battle-tested tool for navigating financial uncertainty, and you can learn more about how these models are used in critical financial situations.
The Rolling Forecast Process: Your Actionable Next Steps
The mechanics of keeping the forecast alive are straightforward. Each week, you will follow a simple three-step update that keeps your 90-day view continuously current.
- Plug in the Actuals: Take the week that just ended and replace your projections with the actual cash that came in and went out, straight from your bank statements.
- Analyze the Variance: Compare what actually happened to what you forecasted. Did a big client pay a week earlier than you thought? Was a vendor payment larger than planned? Digging into these variances is how you get smarter and refine your future assumptions.
- Add a New Week 13: Tack a new week onto the end of the forecast. This rolling process ensures you always have a complete 90-day view into your future cash position.
This consistent process makes your forecasting muscle stronger over time. Every variance analysis is a mini-lesson that makes your next projection that much more reliable.
Your Weekly Meeting Agenda
To keep the meeting laser-focused and actionable, you need to drive the conversation with a core set of questions. The forecast itself is the central document everyone is looking at.
Here’s a sample agenda that cuts right to the chase:
| Agenda Item | Key Question(s) to Answer | Desired Outcome |
|---|---|---|
| 1. Variance Review (5 mins) | Did we hit last week's forecast? Where did we deviate, and why? | Understand what assumptions were off and refine future projections. |
| 2. Inflow & AR Review (10 mins) | What are the key collections we expect this week? Are there any at-risk payments we need to start chasing now? | Assign clear action items to the sales or finance lead to accelerate collections. |
| 3. Outflow & AP Review (10 mins) | What major payments are scheduled to go out? Can any non-critical expenses be delayed to preserve cash? | Get consensus on which payments are essential versus which can be deferred. |
| 4. Red Flags & Actions (5 mins) | Does the forecast show any potential cash crunches in the next 90 days? What actions must we take this week to mitigate that risk? | Agree on one or two proactive steps, like starting a collections push or tapping a line of credit. |
This structure guarantees you cover the most critical ground quickly. By focusing on these questions, you use the 13-week cash flow model to drive decisions that directly impact your financial health. To go deeper on this, check out our guide on how to improve working capital for more strategies.
Answering Your Top Questions About Cash Flow Forecasting
Even with a great template, getting started with a 13-week cash flow forecast brings up common questions. Let's clear up the final hurdles between you and total cash clarity.
How Is This Different from a Budget vs. Actuals Report?
Think of it this way: a budget vs. actuals report is like looking in the rearview mirror. It’s a backward-looking tool that compares what you planned to do against what you actually did, usually on a monthly, accrual basis.
The 13-week cash flow forecast is the complete opposite—it’s your forward-looking GPS. This is a cash-based tool that projects the actual dollars moving in and out of your bank account each week. It deliberately ignores non-cash items like depreciation to answer the one question that truly matters for survival: Will we have enough cash to operate next month?
"The budget is your annual road map; the 13-week cash flow is your GPS for the next 90 days. You need both to reach your destination without running out of gas."
While your budget is strategic, the cash flow forecast is purely tactical. It’s the tool you use to navigate the day-to-day financial realities of your business.
Can I Still Use This with Unpredictable Revenue?
Absolutely. If your revenue is lumpy or unpredictable—like at a digital agency or professional services firm—this discipline is even more critical for you. The goal isn't to predict the future with 100% accuracy, but to understand the range of possible outcomes so you can prepare for them.
This is where scenario planning becomes your best friend. You build three versions:
- Worst-Case: This is your survival model. It includes only guaranteed, contracted revenue and known cash collections.
- Realistic-Case: This is your primary working forecast. It’s built on historical conversion rates, your typical sales cycle, and how your customers actually pay their bills.
- Optimistic-Case: This scenario models what happens if a few of those big deals you're chasing close ahead of schedule.
By maintaining these three views, you gain a deep understanding of your cash position under different conditions. It empowers you to make proactive decisions—like tapping a line of credit or delaying a non-essential hire—long before a cash crunch becomes a crisis.
How Much Time Does This Take to Build and Maintain?
Let’s be honest: there’s an upfront time investment. Building your forecast for the first time will likely take between four to eight hours.
The good news? The weekly upkeep is surprisingly quick. Once the model is built, the weekly update process should take no more than 30 to 60 minutes.
This minimal time investment involves:
- Plugging in last week's actual cash movements.
- Quickly reviewing any big differences between your forecast and reality.
- Adding a new projection for Week 13 to keep the 90-day view rolling.
That time pays for itself countless times over by giving you the visibility to steer the ship with confidence.
What Is the Next Step After I Build the Forecast?
Building the forecast is just step one. The real value comes from what you do with it. The forecast itself is a diagnostic tool; its entire purpose is to drive action.
If your forecast flags a potential cash crunch in Week 8, you don’t wait until Week 7 to panic. You start a collections push on overdue accounts today.
On the flip side, if it reveals a healthy surplus coming in Week 10, you can have a strategic conversation about how to reinvest it for growth. Maybe that means approving a new marketing campaign or pulling the trigger on a key hire a month early.
The forecast transforms you from a reactive firefighter into a proactive financial strategist. It becomes the data-driven foundation for every significant operational decision your leadership team makes.
Your 13-week cash flow forecast provides the data; Jumpstart Partners provides the expert guidance to turn that data into strategic action. Our outsourced controller and bookkeeping services give you the financial clarity and discipline needed to scale confidently. If you're ready to move beyond spreadsheets and build a resilient financial operation, schedule a consultation with our team today.