Financial Operations
Cash Flow Projection: A Proven Guide to Financial Control
Master cash flow projection to boost liquidity for SaaS and service firms. Learn a proven forecasting method to make confident decisions and fuel growth.
ByJumpstart Partners, CPA, QuickBooks ProAdvisor
··23 min readA cash flow projection isn't just another financial report. It's your company's financial roadmap—a forward-looking forecast that estimates the actual cash moving in and out of your business over the coming weeks and months. For a growing business, it's the single most important tool for managing liquidity and making strategic decisions with confidence.
Unlike the backward-looking cash flow statement, a projection gives you the visibility to navigate the future. It's the difference between driving by looking in the rearview mirror and having a clear view of the road ahead.
Why Your Business Is Flying Blind Without a Cash Flow Projection
Running a business with soaring revenue but no clear view of your cash is like flying a high-performance jet through a storm with a fogged-up cockpit. Your altitude (revenue) looks impressive, but you have zero visibility into the mountains (payroll, taxes, vendor payments) directly ahead.
For founders and CEOs, this lack of visibility is the single biggest unmanaged risk in the company. It’s the very reason so many otherwise profitable businesses run out of cash and fail. Your profit and loss (P&L) statement tells a seductive but dangerously incomplete story. A cash flow projection, on the other hand, tells the ground truth. It translates your accrual-based revenue into the only metric that keeps the lights on: cash in the bank.

The SaaS "Profitability Trap"
Here’s a classic scenario for a fast-growing SaaS company. You just closed a record quarter, and your Monthly Recurring Revenue (MRR) jumped by $50,000. The P&L looks fantastic. But it completely hides the timing mismatch that’s about to hit you:
- Delayed Inflows: Many of those new annual contracts won't actually pay for 45-60 days.
- Immediate Outflows: You have to pay sales commissions now. Your server costs just went up. You hired two new engineers to support the growth, and their paychecks are due next week.
- The Squeeze: Your cash outflows spike this month, but the corresponding cash inflows won't arrive for another two months.
Without a projection, you're suddenly staring down a payroll shortfall, forcing you to draw on a line of credit or delay critical payments to vendors. This is exactly how successful, high-growth companies fail. They mistake revenue growth for cash security and end up making reactive, panicked decisions.
From Reactive Firefighting to Proactive Strategy
A reliable cash flow projection shifts your entire operational mindset. It’s not just an accounting exercise; it’s your primary navigation tool.
"A cash flow projection is the bridge between your company's vision and its financial reality. It forces you to confront the operational consequences of your strategic decisions before they become cash crises." – David Worrell, Finance and M&A Advisor at Fuse Financial Partners
This forward-looking view lets you answer critical questions with data, not gut feelings. You can determine exactly when you’ll have the cash to make that key hire, invest in a new marketing channel, or need to secure financing—long before it becomes an emergency.
The persistent challenge, however, is accuracy. A landmark EY study found that only 28% of companies kept their forecasts within 10% of their actual results, a tough task for any business with fluctuating revenue.
This guide gives you a proven framework for building a projection you can actually trust. For gaining immediate control, there’s no better place to start than with a short-term tactical tool like a 13-week cash flow forecast.
Gathering Your Essential Data Inputs
An accurate cash flow projection is built on solid data, not guesswork. Before you can look forward, you need a crystal-clear view of your financial reality right now. Pulling the right numbers from your systems is the foundational step that separates a useful forecast from a dangerous fantasy.
This isn’t just about exporting a P&L from QuickBooks and calling it a day. It’s about digging into the specific reports that reveal the timing of cash movements, because in cash flow, timing is everything.
The Bedrock of Your Projection: Historical Financials
Your journey into the future begins by looking back. You need at least 12-24 months of historical financial data to spot the trends, seasonality, and the real-world rhythm of your cash cycle. This historical context grounds your forecast in reality, acting as a critical check against overly optimistic assumptions.
It’s a proven fact: businesses that base forecasts on at least a year or two of past sales, expenses, and bank data achieve 15-20% higher accuracy in their projections. For a digital agency, this means understanding the Q4 project surge; for a SaaS company, it's about seeing how customer acquisition costs fluctuate with economic shifts. To dive deeper into cash flow management trends, explore insights from industry leaders at Brex.
Beyond the P&L: The Data That Truly Matters
Your accounting software holds most of what you need, but you have to look beyond the high-level P&L. Vague estimates won't cut it when payroll is on the line. The table below outlines the non-negotiable data points and where you can typically find them.
Essential Data Sources for Your Cash Flow Projection
This checklist covers the critical financial documents and data points you'll need to build an accurate projection. Each source provides a unique piece of the puzzle, moving you from high-level profit estimates to a ground-level view of actual cash movements.
| Data Source | What It Tells You | Where to Find It |
|---|---|---|
| A/R Aging Report | The true speed of your cash collections, not just invoiced revenue. It shows who owes you money and, more importantly, how overdue they are. | QuickBooks, Xero, NetSuite |
| A/P Aging Report | Your payment habits and upcoming cash outflows. This details who you owe and when those payments are due, which is critical for scheduling outflows. | QuickBooks, Xero, NetSuite |
| Sales Pipeline / CRM Data | Future cash inflows based on deal probability and close dates. This helps forecast new cash coming in the door beyond existing contracts. | Salesforce, HubSpot, Your CRM |
| Payroll Schedule | One of your largest and most predictable cash outflows. This includes salaries, taxes, and benefits. | Gusto, Rippling, Your Payroll Provider |
| Loan & Debt Schedules | Fixed outflows for principal and interest payments that must be factored into your projection to avoid surprises. | Bank Statements, Loan Agreements |
Getting a handle on these specific data points helps you bridge the gap between your reported numbers and your actual cash position. A great way to sharpen this skill is by regularly comparing your performance through an actuals vs budget analysis.
Choosing Your Method: Direct vs. Indirect
Finally, you need to decide how to structure your projection. There are two primary methods, and for anyone actually running a business day-to-day, the choice is clear.
The indirect method starts with net income and adds back non-cash expenses like depreciation. It’s fine for high-level financial analysis but completely useless for operational cash management because it doesn't track actual cash movements.
The direct method, on the other hand, tracks specific cash inflows (customer payments) and outflows (payroll, rent, vendor payments). It provides the operational clarity you need to see exactly when cash will hit your account and when it will leave. For any founder or CEO of a growing business, the direct method is the only option that gives you true control over your company's lifeblood.
Building Your 13-Week Tactical Cash Flow Model
Your annual financial plan sets the long-term vision, but the 13-week cash flow model is the tactical tool that gets you there. Think of it as your early warning system, giving you a week-by-week view of your liquidity. It transforms cash management from a reactive scramble into a proactive, disciplined process.
Many leaders mistakenly believe their annual budget is enough to manage cash. It isn’t. An annual plan is too high-level to capture the weekly swings in customer payments and vendor bills that can make or break a growing business. This is the visibility gap the 13-week model is designed to close.
The 13-week forecast has become the gold standard for a reason. According to a growth analysis from Paro.ai, companies that use this rolling forecast experience 30% fewer cash crunches during high-growth phases. By updating it every two to four weeks, you create a living document that keeps you grounded in reality.
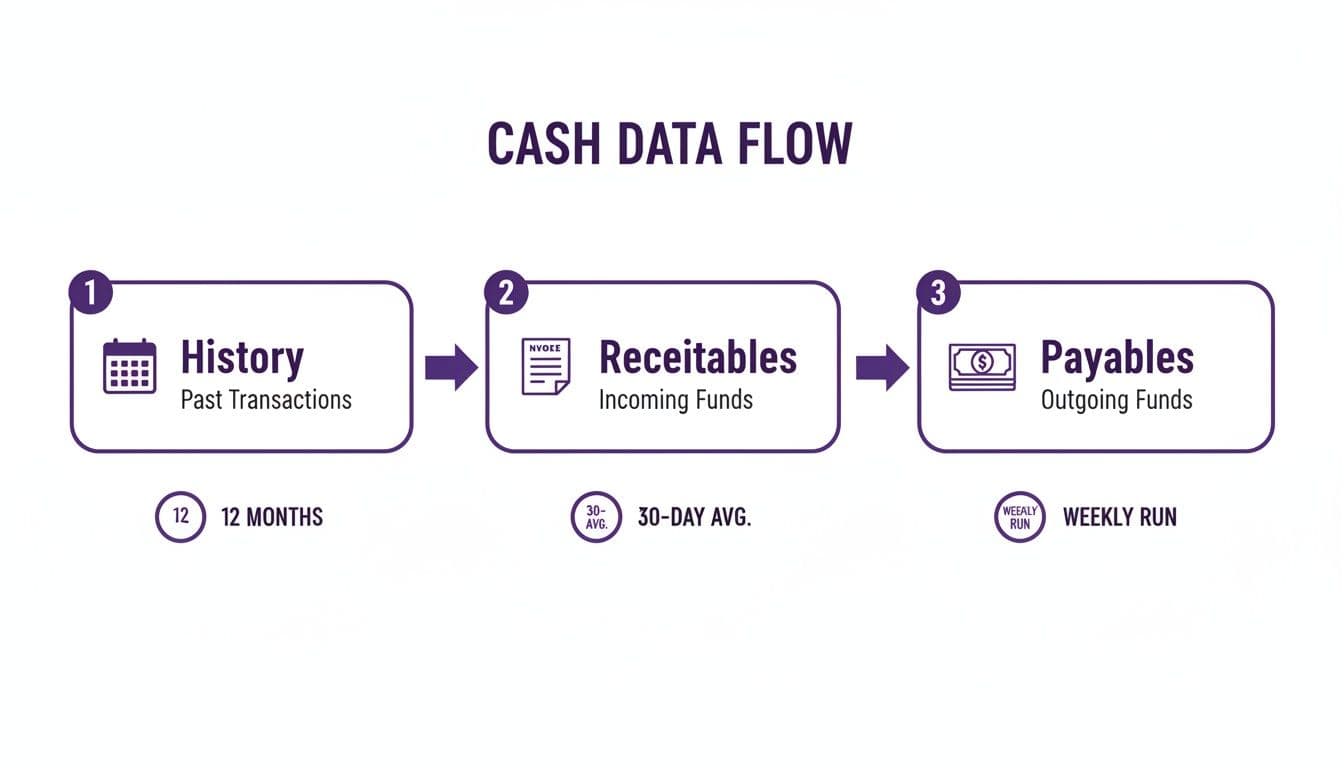
This visual breaks down the essential data flow: your past performance informs your assumptions, your accounts receivable (A/R) dictates the cash coming in, and your accounts payable (A/P) defines the cash going out.
A Worked Example: A $5M Professional Services Firm
Let's make this tangible. We'll walk through a specific calculation for a professional services firm with $5M in annual revenue. This agency operates on Net 30 terms, but like most, they often see payments stretch to 45 or even 60 days.
We’ll start with the most important number on the sheet: your opening cash balance. Let’s say the firm starts Week 1 with $250,000 in the bank. This is your baseline.
Step 1: Projecting Cash Inflows
This is where many businesses get tripped up. Your cash inflows are not your invoiced revenue. They are the actual dollars you expect to collect. Your Accounts Receivable (A/R) aging report is your source of truth here.
Here’s a simplified A/R aging snapshot for our example firm:
| A/R Aging Bucket | Amount Outstanding | Probability of Collection (Next 7 Days) |
|---|---|---|
| Current (0-30 days) | $150,000 | 10% |
| 1-30 Days Past Due | $80,000 | 50% |
| 31-60 Days Past Due | $40,000 | 30% |
| 61+ Days Past Due | $20,000 | 5% |
Now, let's calculate the expected cash receipts for Week 1 based on historical collection patterns:
- Current: $150,000 * 10% = $15,000
- 1-30 Past Due: $80,000 * 50% = $40,000
- 31-60 Past Due: $40,000 * 30% = $12,000
- 61+ Past Due: $20,000 * 5% = $1,000
Total Projected Inflows for Week 1 = $68,000
You repeat this logic for each of the 13 weeks, adjusting your collection probabilities based on past data and any direct communication you've had with clients. You’ll also layer in expected payments from new deals in your pipeline, using a weighted probability based on deal stage.
Step 2: Scheduling Cash Outflows
The good news is that outflows are often more predictable than inflows. You know your fixed costs and can schedule the variable ones. For this, you’ll need your Accounts Payable (A/P) aging report, your payroll schedule, and a list of any other known expenses.
Let’s map out the outflows for Week 1:
- Payroll & Benefits: A bi-weekly payroll of $75,000 is due.
- Vendor Payments: Your A/P report shows $25,000 due to various software vendors and contractors this week.
- Rent & Utilities: The fixed monthly rent of $12,000 is always paid in the first week of the month.
- Marketing Spend: A payment of $8,000 is scheduled for a digital ad campaign.
Total Projected Outflows for Week 1 = $120,000
These are just a few examples; a complete projection would include everything from software subscriptions to tax payments and insurance.
"A 13-week cash flow projection forces a discipline of honesty. You can no longer hide behind vanity metrics like revenue. You are forced to confront the real-world timing of every dollar, which is the only way to build a resilient business." – Scott Way, CPA, Founder of Jumpstart Partners
Step 3: Calculating Your Ending Cash Balance
With your inflows and outflows projected, the final calculation is straightforward.
Opening Cash + Projected Inflows - Projected Outflows = Ending Cash
For our example firm in Week 1: $250,000 (Opening) + $68,000 (Inflows) - $120,000 (Outflows) = $198,000 (Ending Cash)
This ending balance of $198,000 now becomes the opening balance for Week 2. You then repeat the process, rolling the forecast forward for the next 12 weeks. The real power comes from updating the model every week or two with your actual results. This sharpens your future assumptions and keeps the projection grounded in reality.
For more guidance on refining your forecasting accuracy, explore our detailed guide on cash flow forecasting best practices.
Scenario Planning: From Best Case to Worst Case
A single cash flow projection is just your best guess. While it’s an essential starting point, it operates in a vacuum, assuming the future will cooperate perfectly with your plans. You know from experience that never happens.
Real strategic control comes from modeling multiple outcomes. Scenario analysis turns your static forecast from a simple report into a dynamic decision-making tool. It’s how you prepare for uncertainty, stress-testing your financial resilience against both big wins and unexpected gut punches. This isn’t about trying to predict the future with perfect accuracy. It's about defining the boundaries of what’s possible so you can react with speed and intelligence, not panic.
Identifying Your Key Business Drivers
First, you need to pinpoint the few critical variables that actually move the needle on your cash position. For a SaaS company or a digital agency, these are specific, operational metrics you can directly influence or monitor closely.
Common drivers include:
- Customer Churn Rate: How many customers are you losing each month? According to OpenView's 2024 SaaS Benchmarks, the median annual gross dollar retention is 90%. A dip below this benchmark directly impacts future cash inflows.
- Sales Cycle Length: How long does it take to close a new deal? If your typical 60-day cycle stretches to 90 days, your projected cash receipts get pushed out significantly.
- Revenue Per Client: What happens if you land a whale versus a series of smaller accounts? The cash impact is dramatically different.
- Accounts Receivable Collection Period: How quickly do your clients actually pay their invoices?
Once you identify 2-3 of your most sensitive drivers, you can build powerful what-if scenarios around them.
"Scenario analysis is the financial equivalent of a fire drill. You practice for the worst so that when a real crisis hits, you have a clear plan and don't have to make panicked decisions with incomplete information." – David Worrell, Finance and M&A Advisor at Fuse Financial Partners
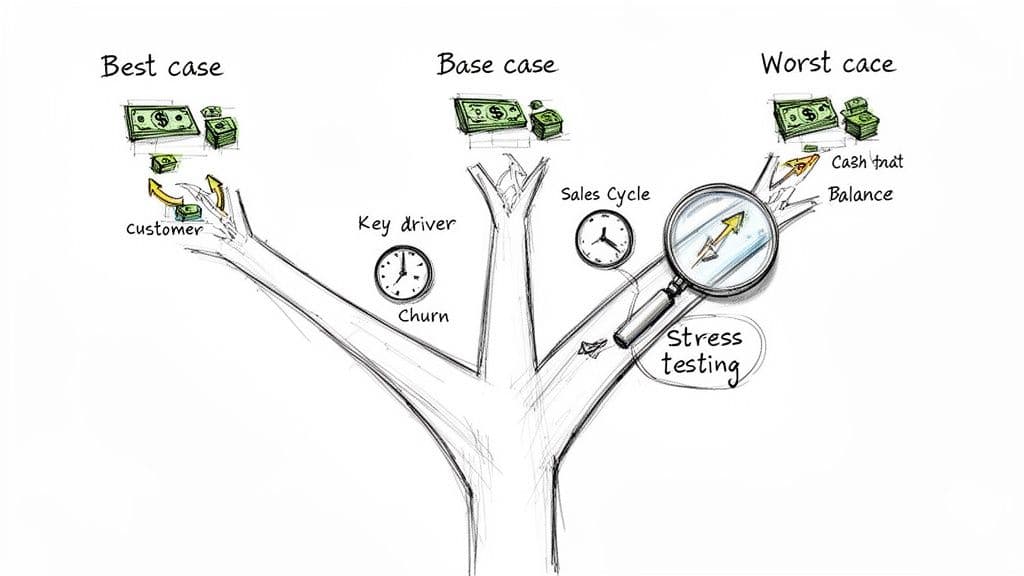
Building the Three Core Scenarios
Let's stick with our example of the $5M professional services firm and model three distinct futures. We’ll focus on two game-changing drivers: landing a major new client and losing a key account. Our base-case projection already assumes business as usual, so that's our starting point.
1. Best-Case Scenario: Landing the Whale You finally sign that new flagship client you've been chasing, adding $75,000 in monthly recurring revenue. The catch? They demand Net 60 payment terms, which creates an initial cash lag. You also need to hire one senior consultant immediately to service the account, increasing monthly payroll by $12,000.
2. Worst-Case Scenario: Losing a Key Account Out of the blue, your largest client, representing $50,000 in monthly revenue, churns. They were a reliable payer, so this immediately craters your projected monthly cash inflows. As a quick defensive move, you can delay a planned marketing hire to save $8,000 per month, but the net impact is still severe.
This kind of side-by-side analysis shows the direct cash impact of major business events. It’s also how you calculate your financial runway under different conditions, a crucial metric you can learn more about in our guide to calculating your startup's burn rate and runway.
From Scenarios to Actionable Triggers
The point of this exercise is to define your trigger points for action before you need them. By knowing the potential outcomes, you can establish clear "if-then" rules that guide your decisions, taking emotion and guesswork out of the equation when the pressure is on.
The table below shows how our example agency might translate its scenario analysis into a concrete playbook.
Cash Flow Scenario Analysis Example ($5M Agency)
This comparison breaks down the projected 12-month cash impact of three scenarios and the specific actions management should take when certain financial triggers are hit.
| Scenario | Key Assumption Changes | Projected 12-Month Ending Cash | Required Action |
|---|---|---|---|
| Best-Case | +$75k MRR, +$12k monthly payroll, Net 60 terms on new deal | $520,000 | Accelerate hiring for two planned roles; explore performance bonus distribution in Q4. |
| Base-Case | Standard sales pipeline conversion, stable churn and collections | $290,000 | Continue with approved budget and hiring plan; monitor A/R aging closely. |
| Worst-Case | -$50k MRR, -$8k monthly expense reduction | -$40,000 (Negative) | Trigger: Immediately freeze all non-essential hiring and travel. Draw $150,000 from the line of credit. CEO and sales lead focus entirely on replacing lost revenue. |
Suddenly, your cash flow projection isn't just a passive report—it's an active playbook. You are no longer just observing your finances; you're managing them against a pre-defined strategy, ready to pivot the moment one of your triggers gets hit.
Common Projection Pitfalls (And How to Avoid Them)
A solid cash flow projection gives you a powerful sense of control. But that feeling is dangerously false if your forecast is built on flimsy assumptions. In fact, an inaccurate forecast is worse than no forecast at all—it gives you the confidence to make the wrong decisions, like hiring two new people right before a seasonal dip or putting off a credit line draw until it’s too late.
Knowing the common traps is the first step to building a projection you can actually run your business on. These aren’t just minor accounting errors; they’re fundamental mistakes that can derail a growing company.
Misconception 1: "Profit equals cash."
This is the most common and deadliest mistake. Your P&L statement can be screaming “record profit!” while your bank account is quietly whispering “goodbye.” This happens because accrual accounting recognizes revenue when it’s earned, not when the cash actually hits your bank.
Imagine a digital agency signs a $120,000 annual contract in January. On the P&L, you recognize a neat $10,000 in revenue each month. Great, right? But what if the client pays quarterly? You won't see a dime of that cash until the end of March, when the first $30,000 wire transfer arrives. A projection based on that P&L revenue would show a smooth, predictable inflow, completely hiding the fact that for two full months, you have zero cash coming in from your biggest new client.
How to Fix It: Your cash flow projection must be built using the direct method, which tracks actual cash receipts and payments. Your Accounts Receivable aging report—not your income statement—is your source of truth for forecasting inflows.
Misconception 2: "Our sales forecast is good enough."
Every founder has to be an optimist; it’s practically a job requirement. The problem starts when that optimism bleeds into your sales assumptions without a serious reality check, leading to a nasty cash crunch. Basing your inflows on your sales team’s most aggressive, best-case-scenario targets without weighting them for probability is a classic blunder.
"Hope is not a strategy. Your 'base case' cash flow projection should be the one you'd bet your job on, grounded in historical conversion rates and conservative growth assumptions, not the hockey-stick forecast you show to investors." – Scott Way, CPA, Founder of Jumpstart Partners
If your sales team has historically closed 25% of deals that reach the proposal stage, your projection can't assume a 50% close rate just because the pipeline "feels" strong this quarter. This single error creates a massive, painful gap between expected and actual cash.
How to Fix It: Use a weighted pipeline. Multiply the value of deals at each stage of your sales funnel by their historical probability of closing. This data-driven approach pulls your sales assumptions out of the clouds and grounds them in reality.
Misconception 3: "Operating expenses are the only cash outflows that matter."
Your forecast needs to account for every significant dollar leaving the business, not just your day-to-day operating expenses. Founders, especially in the early stages, often forget about the big cash outflows that don't show up on a standard P&L.
These are the usual suspects:
- Quarterly Tax Payments: These are substantial outflows that can come as a huge surprise if you haven't planned for them weeks in advance.
- Loan Principal Repayments: Your P&L only shows the interest portion as an expense. The actual principal repayment is a direct cash outflow that your projection must include.
- Owner Draws or Distributions: Taking money out of the business for yourself isn't an "expense," but it's absolutely a cash outflow that needs to be explicitly modeled.
Red Flags That Your Projection Is Unreliable
Your cash flow forecast should be a living document, constantly checked against what's actually happening in your bank account. Here are glaring warning signs that your model is flawed and needs an immediate overhaul.
| Red Flag | What It Means | Corrective Action |
|---|---|---|
| Consistently Missing Forecasts | If your actual weekly cash balance is consistently >15% different from your projection, your core assumptions are just plain wrong. | Go back to the drawing board. Re-evaluate your A/R collection speed, sales cycle length, and expense timing assumptions. |
| Inflows Don't Match A/R Aging | Your projected cash receipts don't line up with what your Accounts Receivable report suggests is actually collectible in the near term. | Rebuild your inflow forecast directly from your A/R aging report, using historical data on how long it actually takes specific clients to pay. |
| Ignoring Seasonality | Your projection shows a smooth, linear growth curve, even though your historical data clearly shows seasonal peaks and valleys every year. | Pull up the last 24 months of financial data. Identify those seasonal patterns and build them directly into your forecast assumptions. |
Actionable Next Steps: From Spreadsheet to Strategic Control
You’ve built your projection and stress-tested it. Congratulations—you now have a level of financial clarity most founders only dream of. But the spreadsheet itself is just a map; the real value comes from turning it into a GPS that guides your daily operations.
Your next move is to build a system that automatically feeds your forecast with real-time, accurate numbers. This means hooking your model directly into your accounting software, like QuickBooks or Xero. The goal is simple: eliminate the manual work. It’s not just slow; it’s the number one source of errors that can poison your entire forecast. Automating this data flow ensures your projection is always built on the most current financial reality, not last month’s best guess.
When to Stop Doing It Yourself
As your business scales, managing cash flow gets exponentially more complex. That simple spreadsheet that worked at $500K in revenue becomes an unwieldy beast at $5M. You hit a critical inflection point where the hours you spend wrestling with VLOOKUPs and chasing down data are hours you’re not spending on strategy, closing deals, or leading your team.
This is the moment to bring in an expert. It isn't an admission of failure; it’s a strategic investment in growth. It’s what separates businesses that stall out from those that scale successfully.
"Many founders are brilliant at their craft but get completely bogged down by financial administration. Outsourcing the finance function frees them to focus on high-value activities, secure in the knowledge that their cash is being professionally managed." - Scott Way, CPA, Founder of Jumpstart Partners
The Value of Outsourced Controller Services
For a business generating millions in revenue, this expertise usually comes from an outsourced controller service. This isn't just about bookkeeping. It’s about gaining a strategic partner who can install a professional-grade financial system.
This partner will:
- Implement a 5-Day Close: Get accurate financial statements in the first week of the month, not the last. This means you’re making decisions on fresh data, not ancient history.
- Manage Your Projection: Take ownership of your 13-week cash flow model, providing insights, flagging risks before they become crises, and running scenario analyses.
- Prepare You for Growth: Deliver the audit-ready, institutional-quality financials that investors, lenders, and potential acquirers demand.
By moving from a DIY spreadsheet to a professional financial system, you’re installing the operational backbone that supports scalable growth. You can learn more about the benefits in our guide to financial reporting automation.
Ready to graduate from spreadsheets to strategic control? Book a consultation to see how a 13-week cash flow sprint or our ongoing controller services can give you the financial command you need to scale with confidence.
Common Questions About Cash Flow Projections
What's the Difference Between a Cash Flow Projection and a Cash Flow Statement?
Think of it like driving a car.
A cash flow statement is your rearview mirror. It’s a historical report that shows you exactly how cash moved through your business in a past period—what came in, what went out, and why. It's factual, precise, and backward-looking.
A cash flow projection, on the other hand, is your windshield and GPS. It’s a forward-looking forecast that estimates your future cash position based on what you expect to happen. The statement is for analyzing the past; the projection is for navigating the future.
How Often Should I Update My Cash Flow Projection?
This depends on which projection you’re talking about.
Your tactical 13-week cash flow projection is a living document that guides your immediate decisions. It demands constant attention. You should be reviewing and updating it weekly, or at the absolute minimum, bi-weekly. This keeps it synced up with the real-time operational pace of your business.
Your longer-term 12-month model can be updated less frequently, typically on a monthly basis. Most businesses roll this into their month-end close process. This allows you to plug in the actual results from the previous month and refine your assumptions for the year ahead.
Which Is Better for My Business: The Direct or Indirect Method?
For any founder or operator running the day-to-day of a growing business, the direct method is worlds better. It’s not even a fair fight.
The direct method gives you a granular, real-world view of actual cash movements—customer payments coming in, payroll going out, rent being paid. It's the only way to get the tactical detail you need to manage working capital effectively.
The indirect method starts with net income and then adds back non-cash expenses like depreciation. While it’s useful for high-level financial analysis, especially for investors or lenders, it offers zero operational insight. For making decisions on the ground, the direct method is the only one that truly matters.
Ready to gain true financial control and move beyond unreliable spreadsheets? The US-based, CPA-led team at Jumpstart Partners can implement a strategic 13-week cash flow projection to give you the visibility you need to scale confidently. Schedule your free consultation today.