Financial Operations
How to Analyze a Balance Sheet Like a Founder, Not an Accountant
Learn how to analyze balance sheet fundamentals for your SaaS or service startup and boost investor confidence.
ByJumpstart Partners, CPA, QuickBooks ProAdvisor
··19 min readAs a founder or CEO, you glance at your balance sheet and think, "Assets equal Liabilities + Equity. Great. Back to building the business." This is a critical mistake. Your balance sheet isn't a compliance document; it's a diagnostic tool that reveals the structural health—or hidden fragility—of your company.
Ignoring it is like flying a plane without checking the fuel gauge. A deep dive tells you if you have enough cash for next month's payroll, if you can afford that strategic hire, or if you have the financial resilience to survive a market downturn. For SaaS, digital agency, and professional services leaders, this analysis is non-negotiable.
Look Beyond the Numbers to See Your Company's Story
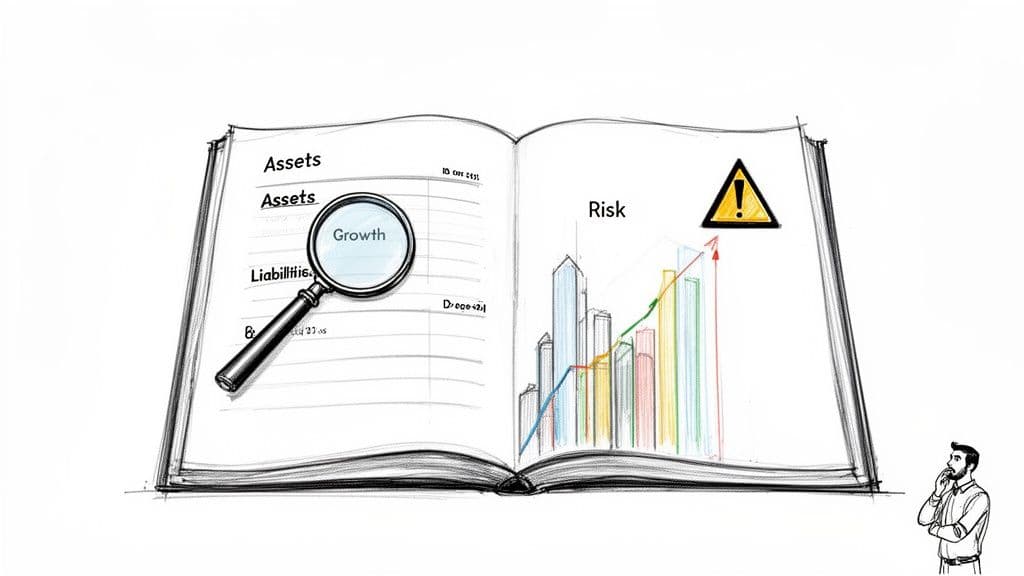
While you’re focused on driving sales and shipping product, your balance sheet tells the real story. Is it a story of sustainable growth, or one of accumulating risk? For companies in the $500K-$20M revenue range—where deferred revenue, accounts receivable, and intangible assets are core business drivers—a quick glance simply isn't enough.
Your Balance Sheet Is a Strategic Tool
Learning to properly analyze your balance sheet transforms it from an accounting chore into a strategic weapon. You start making smarter, data-backed decisions that secure your company’s future and give investors unshakable confidence.
The analysis answers the most fundamental questions about your business's viability:
- Liquidity: Can we meet our short-term obligations like payroll and vendor payments?
- Solvency: Is our capital structure sustainable for long-term survival and growth?
- Efficiency: Are we using our assets effectively to generate revenue?
"A balance sheet is a snapshot, but when you analyze it over several periods, it becomes a motion picture of your company’s financial journey. You start to see trends, identify opportunities, and spot trouble long before it hits your income statement." - Alex Carter, Fractional CFO
This proactive approach is everything. For instance, a company with rising profits might look healthy, but a ballooning accounts receivable balance on the balance sheet is a massive red flag for future cash flow problems. A proper analysis lets you spot this and take action before you can't make payroll.
If you're new to financial statements, it helps to understand how all the pieces fit together. We've put together a guide on how to read financial statements to get you up to speed. This isn't just about crunching numbers; it's about building a resilient and valuable business.
Building Your Foundation for a Flawless Analysis
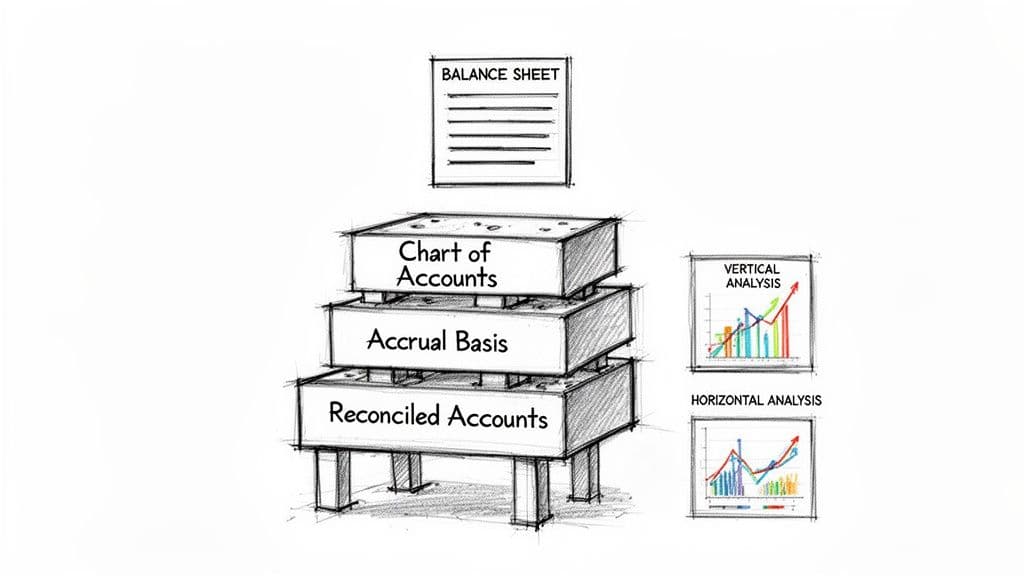
Here's a hard truth: your balance sheet analysis is worthless if the underlying data is garbage. Before you touch a single ratio, your financials must be clean, consistent, and timely. This isn't just "good hygiene"; it's the bedrock of any sound financial decision.
Your starting point is a standardized chart of accounts and a disciplined month-end close. For a business in your revenue range, closing the books should take no more than five to seven business days. Any longer, and you're steering the company with a rearview mirror, making critical decisions on outdated information.
Forget about cash-basis accounting. To get a real picture of performance, you must use the accrual basis. Accrual accounting matches revenue and expenses to the period they’re actually earned or incurred, which gives you true period-over-period comparability. We cover the fundamentals in our complete guide on how to prepare financial statements.
Preparing Your Data for Analysis
Once your books are closed and accurate, you can start your analysis with two high-level techniques. These are non-negotiable first steps that give you an immediate lay of the land before you dive into specific ratios.
- Vertical Analysis: Shows each line item as a percentage of total assets. It’s a fantastic way to see the relative size of each account and understand what makes up your asset base and how it's financed.
- Horizontal Analysis: Compares line items over several periods (think quarter-over-quarter or year-over-year). It turns a static report into a story, showing you the direction and speed of change.
Let's walk through a vertical analysis for a professional services firm with $800,000 in total assets.
| Line Item | Amount | Percentage of Total Assets |
|---|---|---|
| Cash | $200,000 | 25.0% |
| Accounts Receivable | $320,000 | 40.0% |
| Property & Equipment | $80,000 | 10.0% |
| Goodwill & Intangibles | $200,000 | 25.0% |
| Total Assets | $800,000 | 100.0% |
This simple table immediately flags a major issue: 40% of the firm's assets are tied up in Accounts Receivable. This instantly raises a critical question: Are we collecting cash from our clients fast enough? This is the kind of immediate insight you get from foundational analysis—it points you exactly where to dig deeper.
For SaaS businesses, this prep stage has an extra hurdle. You must be meticulous about booking deferred revenue and capitalized software development costs according to standards like ASC 606 and ASC 350-40. Get these wrong, and you dramatically distort your company’s financial health. To really nail balance sheet interpretation, it helps to build a strong foundation, as detailed in this essential guide for financial analysis.
Measure Your Short-Term Financial Runway
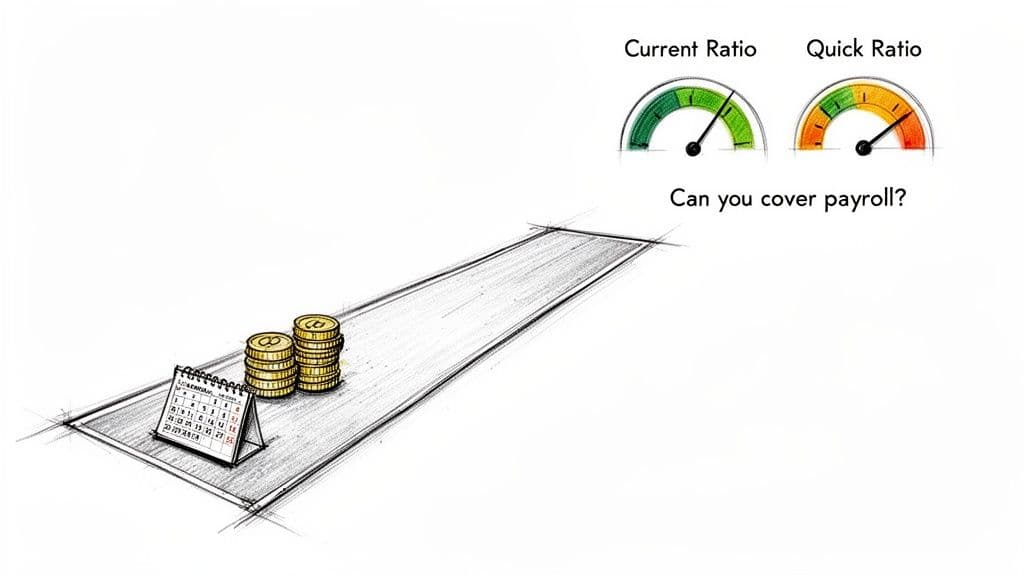
Can you make next month’s payroll? It’s the single most important question a leader can ask, and the answer lives in your company’s liquidity.
This isn't an abstract accounting term. It’s your real-world ability to cover all your short-term bills—payroll, rent, vendor invoices—without having to resort to a fire sale of critical assets. For any growing SaaS or services business, cash flow isn’t just king; it’s the entire kingdom.
Liquidity ratios are the vital signs that tell you exactly how much financial runway you have. Ignoring them is like flying a plane without a fuel gauge. Eventually, you run out.
The Current Ratio: Your First Line of Defense
The first and most common liquidity metric is the Current Ratio. It’s a broad measure of your ability to cover short-term debts using assets you expect to turn into cash within the next year.
The formula is dead simple: Current Ratio = Current Assets / Current Liabilities
Let’s run the numbers for a digital agency with $400,000 in current assets (cash, accounts receivable, prepaid expenses) and $200,000 in current liabilities (accounts payable, accrued payroll, short-term debt).
- Current Ratio = $400,000 / $200,000 = 2.0
A ratio of 2.0 is solid. It means for every $1 you owe in the near term, you have $2 in assets ready to cover it. For most SaaS and service companies, a ratio consistently above 2.0 shows a healthy buffer. If it dips below 1.5, you’re entering a warning zone. A ratio below 1.0 is a five-alarm fire.
For growing firms, understanding your balance sheet is a core part of mastering cash flow planning and making sure you can always meet your obligations.
The Quick Ratio: Your "Acid Test" for Solvency
The Current Ratio is a good start, but it has a flaw: it includes assets like inventory that aren't easily converted to cash. The Quick Ratio—also known as the Acid-Test Ratio—is a much stricter, more conservative measure.
It tells you if you can cover your immediate liabilities without selling a single piece of inventory, a very relevant scenario for service and SaaS firms.
The formula pulls out less liquid assets: Quick Ratio = (Current Assets - Inventory) / Current Liabilities
Picture a SaaS company with $750,000 in current assets and $400,000 in current liabilities. Since it has no physical inventory, its Current and Quick ratios are the same.
- Quick Ratio = $750,000 / $400,000 = 1.88
A Quick Ratio above 1.0 is the gold standard. It proves you can satisfy your current debts with only your most liquid assets. The 1.88 here shows strong short-term stability. Historical data confirms just how critical this is. During the 2008-2009 financial crisis, firms that maintained quick ratios above 1.0 saw 25% fewer bankruptcies. You can find more detail on how historical data strengthens analysis by exploring these analyst best practices.
Balance Sheet Red Flags: Liquidity
- A declining Current or Quick Ratio for 2+ quarters: This is a clear signal that your cash burn is outpacing your cash generation or collections.
- Current Ratio below 1.5: You have a thin safety margin. An unexpected expense or a few late-paying clients could create a cash crunch.
- Quick Ratio below 1.0: You cannot cover your immediate bills without selling inventory or other less-liquid assets. This is a serious red flag.
Weak liquidity is a sign you're operating too close to the edge. If your ratios are consistently low, build a robust 13-week cash flow forecast to get a real handle on your near-term cash needs.
Use Debt to Grow Without Sinking the Ship
Liquidity gets you through the next payroll. Solvency ensures you’ll still be in business ten years from now. As you grow past the $1M revenue mark, understanding your solvency isn't optional—it's non-negotiable, especially before you take on venture debt or a bank loan.
Solvency ratios show you exactly how much of your business is running on borrowed money. While the right kind of leverage can be a rocket booster for growth, too much of it flashes a giant red warning sign to investors and lenders, making future funding much harder and more expensive to get.
Dissecting Your Debt Load
Your company's leverage story comes down to two key solvency ratios: the Debt-to-Assets Ratio and the Debt-to-Equity Ratio.
- Debt-to-Assets Ratio: Measures the percentage of your company’s assets financed with debt. A ratio below 0.5 is generally seen as a safe, manageable level.
- Debt-to-Equity Ratio: Compares total liabilities to shareholder equity. It shows how much debt you're using for every dollar of your own capital.
Let's run the numbers for a SaaS company with $2,000,000 in total assets, $800,000 in total liabilities (debt), and $1,200,000 in shareholder equity.
Debt-to-Assets Ratio = Total Liabilities / Total Assets
$800,000 / $2,000,000 = 0.40
A ratio of 0.40 means 40% of the company’s assets are financed by debt. This is a healthy, comfortable position.
Debt-to-Equity Ratio = Total Liabilities / Shareholder Equity
$800,000 / $1,200,000 = 0.67
This tells us the company has $0.67 of debt for every $1 of equity. For tech and services companies, a Debt-to-Equity ratio under 1.0 is fantastic. As it creeps toward 1.5, you must pay close attention.
What the Numbers Actually Mean
A ratio on its own is just a number. The real story unfolds when you track these figures over time. Trend analysis is where you find the narrative. For instance, I once analyzed a company where total assets had jumped by 49.8%, but it was driven by a massive 177.5% spike in long-term debt. That wasn't organic growth; it was a clear signal of aggressive borrowing for acquisitions. You can learn more about how to interpret financial statement trends on Saylor.org.
"Founders often see debt as a sign of weakness, but that's a misconception. Smartly deployed debt is a tool. The key is to match the type of capital to the use case. Don't use short-term debt to fund a long-term project. That's how you create a solvency crisis." - Marcus Pearson, Financial Strategist
Using debt for growth isn't a bad thing. In fact, it can be a savvy way to scale without giving up more equity. This type of financing is what we call growth capital, and it's a powerful engine for expansion when you know how to manage it.
Balance Sheet Red Flags: Solvency
- A steadily climbing Debt-to-Equity ratio: If this number rises for several quarters in a row, you're becoming more reliant on borrowing. This increases your risk profile.
- Heavy reliance on short-term debt to fund long-term assets: This creates a dangerous timing mismatch and is a classic recipe for a cash crisis.
- Negative Shareholder Equity: If total liabilities exceed total assets, your equity is negative. On paper, your business is insolvent. This is a sign of extreme financial distress.
Keeping an eye on these ratios isn't just an accounting chore. It's about ensuring your growth is built on solid ground, giving you the confidence to make bold moves without betting the farm.
Turn Your Assets into Revenue More Efficiently
Being liquid and solvent means your business can survive. But efficiency ratios? They show if your business can actually thrive. They measure how well you're using your assets—the engine of your business—to generate revenue. A highly efficient company grows faster and more profitably on less capital.
This is where your balance sheet connects directly to day-to-day operations. Poor efficiency means cash is trapped, unable to be reinvested into growth. We'll focus on Days Sales Outstanding (DSO) for service and SaaS businesses.
Are You Collecting Cash Fast Enough?
For any SaaS or service-based company, the most critical efficiency metric is Days Sales Outstanding (DSO). It tells you, on average, how many days it takes to collect payment after you've made a sale. It is a direct measure of your cash conversion cycle.
The formula is: DSO = (Accounts Receivable / Total Credit Sales) x Number of Days in Period
Let's run the numbers for a digital agency that billed $1.5M in revenue (all on credit) over a year (365 days) and ended the year with $200,000 in Accounts Receivable.
- DSO = ($200,000 / $1,500,000) x 365 = 48.7 days
This means it takes the agency nearly 49 days to get paid. A high DSO is a massive red flag. It strains your working capital and points to problems with your billing process or even the creditworthiness of your clients.
"A rising DSO is one of the most dangerous trends a founder can see. It means your cash flow is slowing down, even if your revenue is growing. You are effectively providing your clients with an interest-free loan, and it’s your growth that pays the price." - Sarah Chen, Fractional CFO
According to OpenView's 2024 SaaS Benchmarks, a best-in-class DSO for SaaS companies is under 45 days. An agency with a DSO inching toward 60 days needs to take immediate action. To understand how this fits into the bigger picture of asset efficiency, you can dive deeper into our guide on the asset turnover ratio.
Context is everything. You need to know what's "good" for your specific industry. Globally, firms that actively benchmark their performance against industry peers reduce their financial risks by as much as 35%, according to industry studies. You can explore insights on the value of benchmarking from KM&Co to see why this matters so much.
Actionable Next Steps to Improve Efficiency
If your DSO is climbing, you need a plan. Don't just watch the trend and wait for a cash crisis.
| Action Item | Description |
|---|---|
| Automate Invoicing | Implement a system that sends invoices and payment reminders on a set schedule. No more "forgetting" to chase late payments. |
| Offer Early Pay Discounts | Incentivize clients to pay faster. A simple "2/10, n/30" term (a 2% discount if paid in 10 days) works wonders for cash flow. |
| Tighten Credit Policies | Be more selective about offering generous payment terms, especially to new or unproven clients. Run credit checks if needed. |
| Invoice Promptly & Accurately | Ensure invoices go out the same day work is completed or a milestone is hit. Delays on your end create delays on their end. |
Translate Your Analysis Into Decisive Action
Insights without action are just numbers on a page. The purpose of analyzing your balance sheet is to create a concrete game plan that makes the business stronger. This is where you shift from passive observer to financial strategist.
Your analysis shines a light on your company’s financial strengths and weaknesses. The next step is to create a clear set of "if-then" rules to guide your decisions. This isn’t guesswork—it's a disciplined response to what the data is telling you.
Prioritizing Your Next Moves
Your ratios and trend analysis tell you exactly where to focus first. A weak liquidity position is an immediate threat, while rising leverage is a slower-burn strategic risk. You must prioritize based on urgency and impact.
For instance, this decision tree shows a simple, action-oriented path for improving asset efficiency—a common headache for service and SaaS companies.
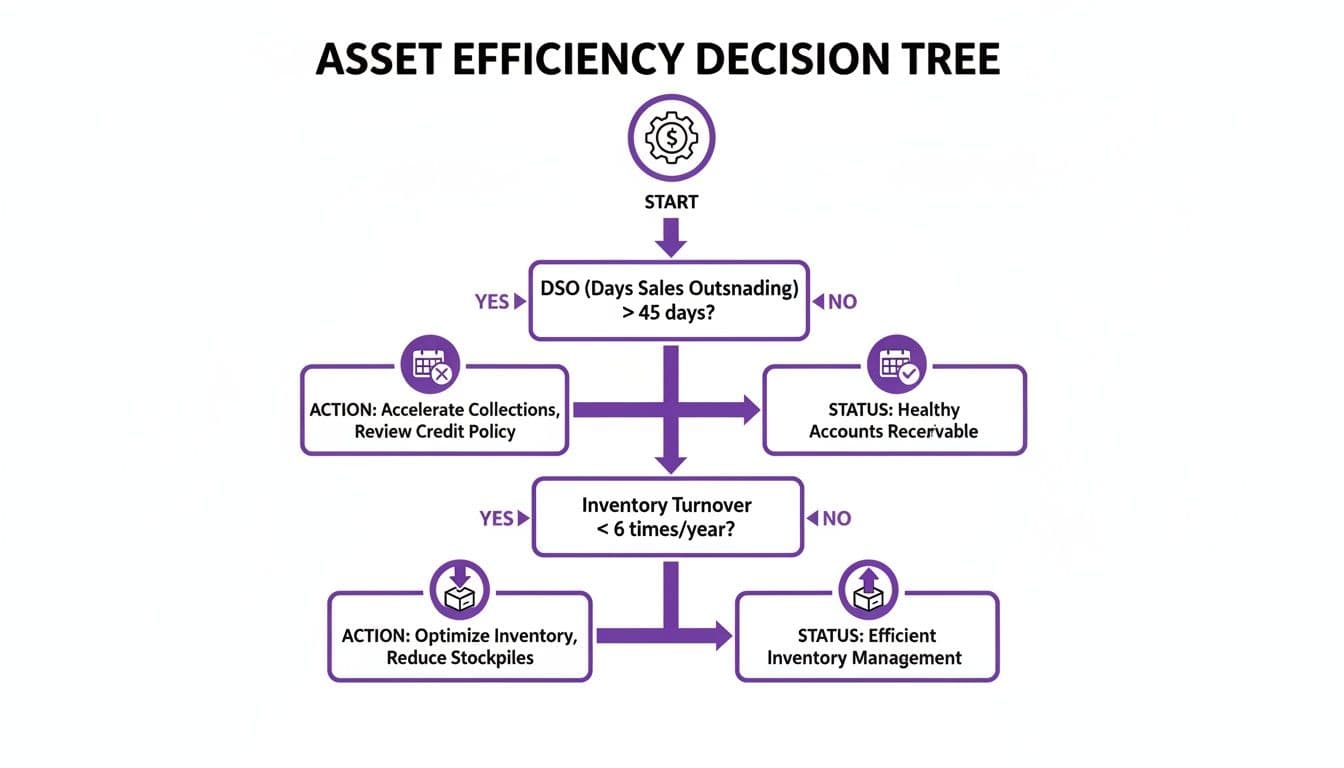
The key takeaway is that if your Days Sales Outstanding (DSO) creeps past the industry benchmark of 45 days, your top priority is to fix your collections process. That's where you'll unlock the most cash, fast.
Here’s a quick-action guide. Find the primary red flag from your analysis and execute the corresponding first step.
| If You See This... | Your Immediate Next Step Is... |
|---|---|
| Weak Liquidity (Current Ratio < 1.5) | Build a 13-week cash flow forecast to get ahead of shortfalls and see your true burn rate. |
| High Leverage (Debt-to-Equity > 1.5) | Model debt repayment scenarios versus the dilution impact of raising a new equity round. |
| Slow Collections (DSO > 60 days) | Launch an aggressive collections sprint. Call every overdue account and tighten payment terms for new clients. |
| Poor Solvency (Negative Equity) | Immediately freeze all non-essential spending and build a turnaround plan focused on restoring profitability, now. |
Your Action-Oriented Roadmap
Stop letting your financials happen to you. Use this framework to take control.
- Isolate the Biggest Risk: Based on your ratio analysis, what is the single greatest threat to your financial health right now? Focus on that one thing first.
- Define a Single, Actionable Step: What is one specific thing you can do in the next week to start mitigating that risk? Start with one high-impact task.
- Assign Ownership and a Deadline: Who on your team is responsible for this, and when will it be done? Accountability is everything.
This proactive approach is what separates companies that scale successfully from those that stagnate. Financial resilience isn't something you have; it's something you build through a continuous cycle of analysis, decision, and action. Think of it like the European banking stress tests, which prove that resilience is about being prepared for future shocks. Your business is no different—strong financials give you the power to act, not just react.
If you’ve uncovered issues that seem overwhelming or just need an expert eye to build a recovery plan, we can help. Schedule a consultation to see how our controller services can give you the clarity and control you need to secure your company's future.
Frequently Asked Questions
When you start digging into your balance sheet, a few common questions always pop up. Here are the direct answers for founders and finance leaders.
How Often Should I Analyze My Balance Sheet?
You need two cadences: monthly and quarterly.
Right after your books close each month, perform a 30-minute health check. Review your Current Ratio, Quick Ratio, and Debt-to-Equity to ensure no sudden red flags have appeared.
Then, quarterly, go deep. This is where you conduct trend analysis, compare your numbers to industry benchmarks, and dig into the story your balance sheet is telling. This strategic review sets the agenda for the next quarter.
What Do Investors Look For Beyond Basic Ratios?
Investors are reading between the lines. They look for financial discipline and operational savvy. They will zero in on:
- Asset Quality: A large, mysterious balance in "Other Assets" is an immediate red flag. A ballooning Accounts Receivable balance also signals collection problems or even uncollectible revenue. They want to see assets clearly tied to generating cash.
- Debt Sustainability: It’s not just the Debt-to-Equity ratio. They want to know the type of debt you have. Is it patient, long-term debt used for strategic growth? Or is it high-interest, short-term debt used to patch cash flow holes? The difference is massive.
- Working Capital Efficiency: A savvy investor will calculate your cash conversion cycle. For a SaaS business, a low DSO is a powerful sign of a sticky product and a tight collections process. For an agency, it proves you run a tight operational ship.
"Investors dig into the balance sheet to understand a company's financial discipline. A clean, well-structured balance sheet with healthy ratios is a powerful signal that the leadership team understands how to build a resilient and valuable business." - Maya Patel, Venture Capitalist
Objection: "My company is profitable, so my balance sheet doesn't matter as much."
This is a dangerous misconception. Profitability on your income statement and financial health on your balance sheet are two different things. You can be "profitable" on paper but go bankrupt because you can't collect cash from customers fast enough to make payroll (a balance sheet problem). High profit with weak liquidity is a sign of a business that is growing too fast for its financial infrastructure—a common path to failure.
A deep balance sheet analysis often uncovers issues that feel complex and overwhelming. At Jumpstart Partners, we provide the expert guidance you need to turn financial data into decisive action. Our outsourced controller services give you the clarity and control to strengthen your financials and secure your next phase of growth. Schedule a free consultation to get started.