Financial Operations
How To Read An Income Statement: Founder's Guide
Master how to read an income statement. Founders learn revenue, margins, SaaS metrics, & red flags for investor-ready financial reporting.
ByJumpstart Partners, CPA, QuickBooks ProAdvisor
··22 min readIf you don’t know how to read an income statement, you’re steering your company off a rearview mirror and guessing at the road ahead.
Most founders look at revenue first, net income second, and stop there. That’s not analysis. That’s how you miss margin erosion, overhire against weak unit economics, and walk into fundraising with numbers that look clean on the surface but fall apart under diligence. The income statement is where your business model either proves itself or exposes itself.
For growth-stage SaaS and service firms, this matters even more because the same top-line number can hide very different businesses. One company is compounding with strong gross margins and disciplined operating spend. Another is buying growth, underpricing delivery, and calling it momentum. Your job is to tell the difference quickly.
Your Income Statement Is a Growth Tool Not a History Report
Too many founders treat the income statement like a tax document. It isn’t. It’s a decision tool.
If you run a SaaS company or a services business, your income statement tells you whether your revenue model can support the team, systems, and go-to-market spend you’re planning to add. It tells you whether your pricing works. It tells you whether delivery is efficient. It tells you whether growth is improving the business or making the underlying problems bigger.
A founder who reads only the top line gets fooled fast. Revenue can rise while gross margin slips. Gross profit can look healthy while operating expenses swell underneath it. Net income can look acceptable for a period while the business keeps making bad structural decisions.
Practical rule: Your income statement is not a compliance report. It’s your operating scoreboard.
This is why I push founders to review the P&L monthly as a management tool, not just a bookkeeping artifact. If your finance process only produces statements for your accountant, you’re already late. If you want a sharper framework for ongoing review, this guide on profit and loss management is a useful companion.
What founders usually get wrong
There are three common mistakes.
- They confuse revenue with health. Revenue growth without margin discipline creates expensive chaos.
- They ignore cost structure. A services firm can look busy and still be poorly priced. A SaaS business can grow subscriptions and still bloat delivery and support costs.
- They wait for cash problems to discover profit problems. By then, you’ve already made hiring and spending decisions that are hard to reverse.
What the income statement should answer
When you read it correctly, your income statement should tell you:
| Question | Why it matters |
|---|---|
| Is revenue quality improving or getting worse? | You need to know if growth is durable or distorted. |
| Are direct costs under control? | That determines whether scale will help you or hurt you. |
| Are operating expenses aligned with your stage? | This affects runway, fundraising story, and hiring pace. |
| Is the business producing operating leverage? | Investors want a business that gets stronger as it grows. |
If you’re the CEO, you don’t need to think like an accountant. You need to think like an allocator of capital. The income statement is where you decide what to fix, what to fund, and what to stop.
Deconstructing the Income Statement Top to Bottom
The cleanest way to read an income statement is as a staircase. You start at revenue, subtract costs step by step, and end at net income. Every step tells you something strategic.
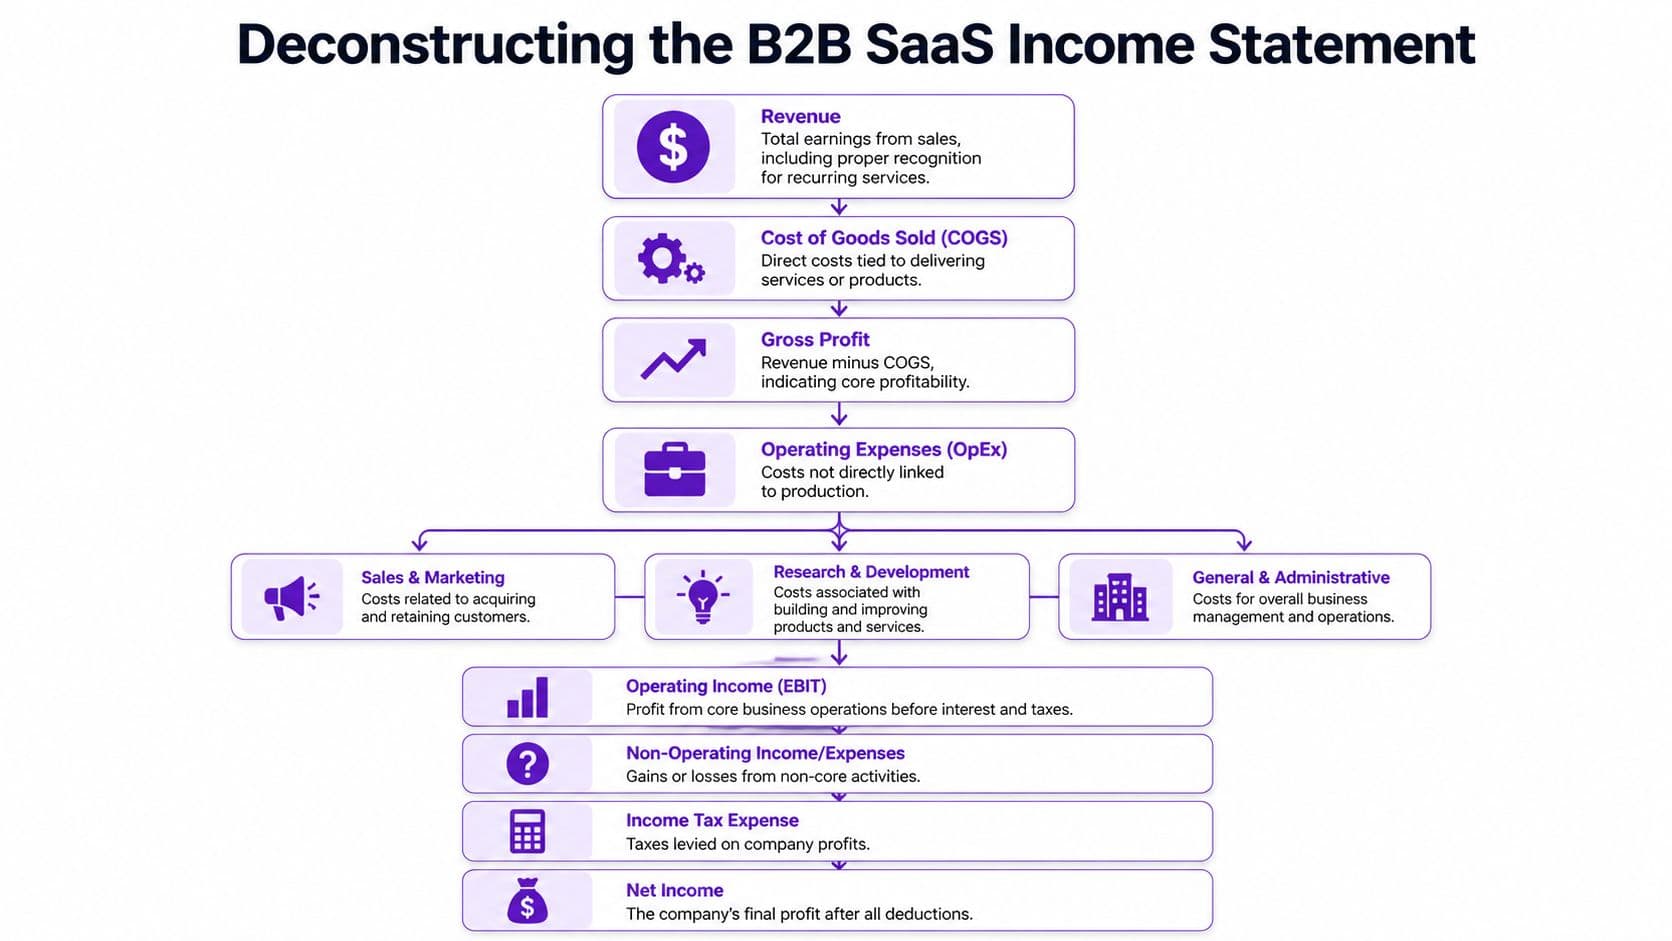
Start with revenue
Revenue sits at the top because everything else depends on it. But don’t just ask how much revenue you booked. Ask what kind of revenue it is and how reliably it repeats.
For SaaS, this means recognized revenue, not just closed contracts. For agencies and professional services, it means revenue earned based on delivery, not the invoice date alone. Founders often celebrate bookings while the income statement tells a more disciplined story.
You need that discipline because the statement exists to show performance for a specific period, not optimism about future periods.
Then isolate cost of goods sold
Cost of goods sold, or COGS, captures the direct cost to deliver what you sold. In SaaS, that often includes hosting, third-party tools tied to service delivery, and support or implementation costs that directly support the customer. In services, it often includes billable labor and contractor costs tied to delivery.
If you classify these inconsistently, your entire margin story gets distorted. That’s one reason founders misread profitability. They think they have an overhead problem when their problem is a delivery-cost problem.
Gross profit tells you whether the engine works
Gross profit = revenue - COGS. This is your first real test.
A foundational measure here is gross margin, calculated as gross profit divided by net sales. In one widely used example, Home Depot reported $50.8 billion in revenue and a gross margin of approximately 33.6%, meaning it retained about 33.6 cents of gross profit per dollar of sales according to this gross margin walkthrough using Home Depot’s income statement. That same source notes that SaaS businesses often operate with 70% to 90% gross margins because software has low variable costs after development.
That point matters. If you’re building a SaaS company and your gross margin is weak, you don’t have a scale story yet. You have a cost structure issue, a pricing issue, or both.
High gross margin doesn’t guarantee a great business. Low gross margin usually guarantees a harder one.
A worked example using real numbers
Use this example to see how the staircase works in practice. In an HBS analysis example, a company reported $4.358 billion in sales and $2.738 billion in COGS, producing $1.619 billion in gross profit. That works out to a 37.1% gross margin because $1.619 billion divided by $4.358 billion = 37.1%.
After that, the company deducted operating expenses. It had $560 million in selling expenses and $293 million in G&A, for total operating expenses of $853 million. Subtract that from $1.619 billion in gross profit and you get $765 million in operating income.
Here’s the full staircase:
| Line item | Amount |
|---|---|
| Sales | $4.358 billion |
| COGS | $2.738 billion |
| Gross profit | $1.619 billion |
| Selling expenses | $560 million |
| G&A | $293 million |
| Operating income | $765 million |
| Taxes | $257 million |
| Net income | $483 million |
This is how you should read every statement. Don’t skim. Reconstruct the logic.
Operating expenses show where management discipline lives
Below gross profit, you’ll usually see operating expenses. These are the costs to run the company that aren’t directly tied to producing or delivering the product in the period.
For a B2B SaaS company, I want founders to separate this area mentally into three buckets:
-
Sales and marketing
This spend should support efficient acquisition and expansion. If it rises faster than revenue for too long, your growth engine needs scrutiny. -
Research and development
This spend can be strategic and necessary. But founders should still ask whether product investment is creating retention, expansion, or defensibility. -
General and administrative Finance, legal, admin, leadership overhead. Operational sprawl becomes evident here.
When founders ask me where to start cutting or where to invest more, I don’t answer from instinct. I answer from this section of the income statement.
Operating income is your core business verdict
Operating income tells you what the business earns from normal operations before taxes and, depending on presentation, before or after other non-operating items. It strips out some noise and gives you a cleaner view of whether the underlying model works.
Using the HBS example above, the company’s operating margin is 17.5% because $765 million divided by $4.358 billion = 17.5%. That’s a far better management lens than just looking at net income in isolation.
If you want a deeper breakdown of this line and why it matters in decision-making, read this explanation of what operating income means.
Net income is important, but it’s not the first number to trust
At the bottom sits net income. This is the final result after operating costs, taxes, and other items. It matters, but founders overfocus on it.
Why? Because net income is downstream. If gross margin is weak and operating expenses are misaligned, net income only reflects those problems after they’ve already spread through the statement. I care more about whether the earlier layers are healthy.
Still, net income forces accountability. In the same HBS example, the company ended with $483 million in net income after $257 million in taxes. That’s what remains after the staircase has done its work.
What to review every month
Use this checklist every time you open your income statement:
-
Revenue quality
Is revenue recognized properly and supported by actual delivery or subscription terms? -
COGS discipline
Are direct costs rising in line with customer value, or are they creeping up because your delivery model is inefficient? -
Gross margin strength
Is the core model improving as you scale? -
Operating expense control
Which expense category moved, and was that move intentional? -
Operating income trend
Is your core business getting stronger, or are you spending more to stand still? -
Net income context
Does the bottom line reflect operational improvement, or just accounting timing and non-core effects?
Most founders don’t need a more complex P&L. They need to read the one they already have with more discipline.
Turning Numbers Into Strategic Insights and KPIs
Founders who review only dollar amounts miss the pattern that drives valuation. Investors, lenders, and disciplined operators look for trend, mix, and efficiency.
Your income statement becomes useful when you convert it into ratios and movement. That is how you spot margin erosion early, catch bloated overhead before cash gets tight, and explain performance in a fundraising meeting without hand-waving.
Vertical analysis shows whether growth is getting cleaner or messier
Vertical analysis turns every major line into a percentage of revenue. Do that every month. It strips out scale and shows how your business model behaves as you grow.
Coursera’s overview of income statement analysis gives a simple example. If operating expenses move from 45% of revenue to 52%, you do not have a minor variance. You have a cost structure problem. Revenue may be rising, but the company is keeping less of each dollar.
That matters more than the raw spend number.
Use the worked example from above like this:
| Line item | Amount | As a percentage of sales |
|---|---|---|
| Sales | $4.358 billion | 100% |
| COGS | $2.738 billion | 62.8% |
| Gross profit | $1.619 billion | 37.1% |
| Operating expenses | $853 million | 19.6% |
| Operating income | $765 million | 17.5% |
| Net income | $483 million | 11.1% |
This view tells you where the model keeps cash and where it bleeds. For SaaS founders, I care first about gross margin and sales efficiency. For service firms, I care first about gross margin and labor utilization. Same statement, different management decisions.
If you need a tighter handle on one of the most important operating metrics, this guide on how to calculate gross margin will help you clean up the math and the interpretation.
If revenue rises and margin percentages fall, growth is covering a structural problem, not solving it.
Horizontal analysis shows whether execution is improving
Horizontal analysis compares one period to another. Month over month is useful for pace. Quarter over quarter is better for signal. Trailing twelve months is best for judging whether the business is improving.
Do not stop at revenue growth. Compare revenue, gross profit, operating expenses, and operating income together. If revenue is up 20% but operating expenses are up 35%, your operating model is getting weaker. If gross profit grows slower than revenue, your pricing, delivery cost, or customer mix needs attention.
SaaS and services founders should get more specific than generic accounting advice. A SaaS company should separate product-driven improvements from support and success headcount growth. A services firm should separate healthy hiring for booked demand from margin loss caused by underpricing, scope creep, or poor utilization. The income statement gives you the symptom. Your operating model explains the cause.
Use ratios to run the business
If your finance team sends a monthly P&L with no ratio commentary, they are sending a recordkeeping package, not management reporting.
Track these three first:
-
Gross margin
This shows whether your core offer produces enough value after delivery costs. In SaaS, weak gross margin often points to heavy service work, hosting inefficiency, or support costs that scale poorly. In services, it usually points to utilization, pricing, or bad scoping. -
Operating margin
This shows whether the business can grow without overhead expanding out of control. If this number stalls while revenue grows, your go-to-market and admin spend need a hard review. -
Net profit margin
This shows what remains after everything else. It matters, but it should not be your first diagnostic tool.
Use benchmarks carefully. Industry averages are blunt. A bootstrapped SaaS company, a hybrid SaaS plus services firm, and a project-based agency should not be judged by the same margin profile.
| Metric | SaaS (> $1M ARR) | Digital Agency | Professional Services |
|---|---|---|---|
| Gross margin | Usually strong if implementation and support stay controlled | Lower because delivery depends heavily on labor | Depends on utilization, rate discipline, and project scoping |
| Operating margin | Improves when growth outpaces support and overhead hiring | Sensitive to account sprawl and management layers | Improves with staffing discipline and profitable client mix |
| Net profit margin | Often compressed during aggressive growth periods | Falls quickly when delivery costs rise faster than pricing | Reflects pricing power, utilization, and overhead control |
Founders also need alignment between financial KPIs and operating KPIs. Your P&L should connect to MRR, utilization, billable capacity, CAC payback, retention, and expansion. If those systems disagree, you cannot manage cleanly and you will struggle in diligence. For a practical outside view, Founder Connects' strategic KPI insights are useful.
Ratios and trends expose the underlying business health.
A simple monthly review process
Keep the routine tight.
- Convert every major line item to a percentage of revenue.
- Compare the current month to prior months, the prior quarter, and the trailing twelve months.
- Flag any material move in gross margin, operating expenses, or operating income.
- Identify the cause. Pricing, mix, headcount, delivery inefficiency, one-time spend, or recognition timing.
- Decide on an action.
That last step is what separates operators from spectators. A good income statement review should end with decisions. Raise prices. Cut low-margin work. slow hiring. Fix onboarding cost. Change packaging. Reallocate sales spend. If the review does not change behavior, it is just accounting theater.
SaaS and Services Accounting Specifics You Must Know
A standard income statement doesn’t tell the whole story for recurring revenue or project-based businesses. That’s where founders get trapped. You see growth in your CRM, billing platform, or sales dashboard, then look at the P&L and wonder why revenue doesn’t move the same way.
That disconnect is normal. You need to understand why.
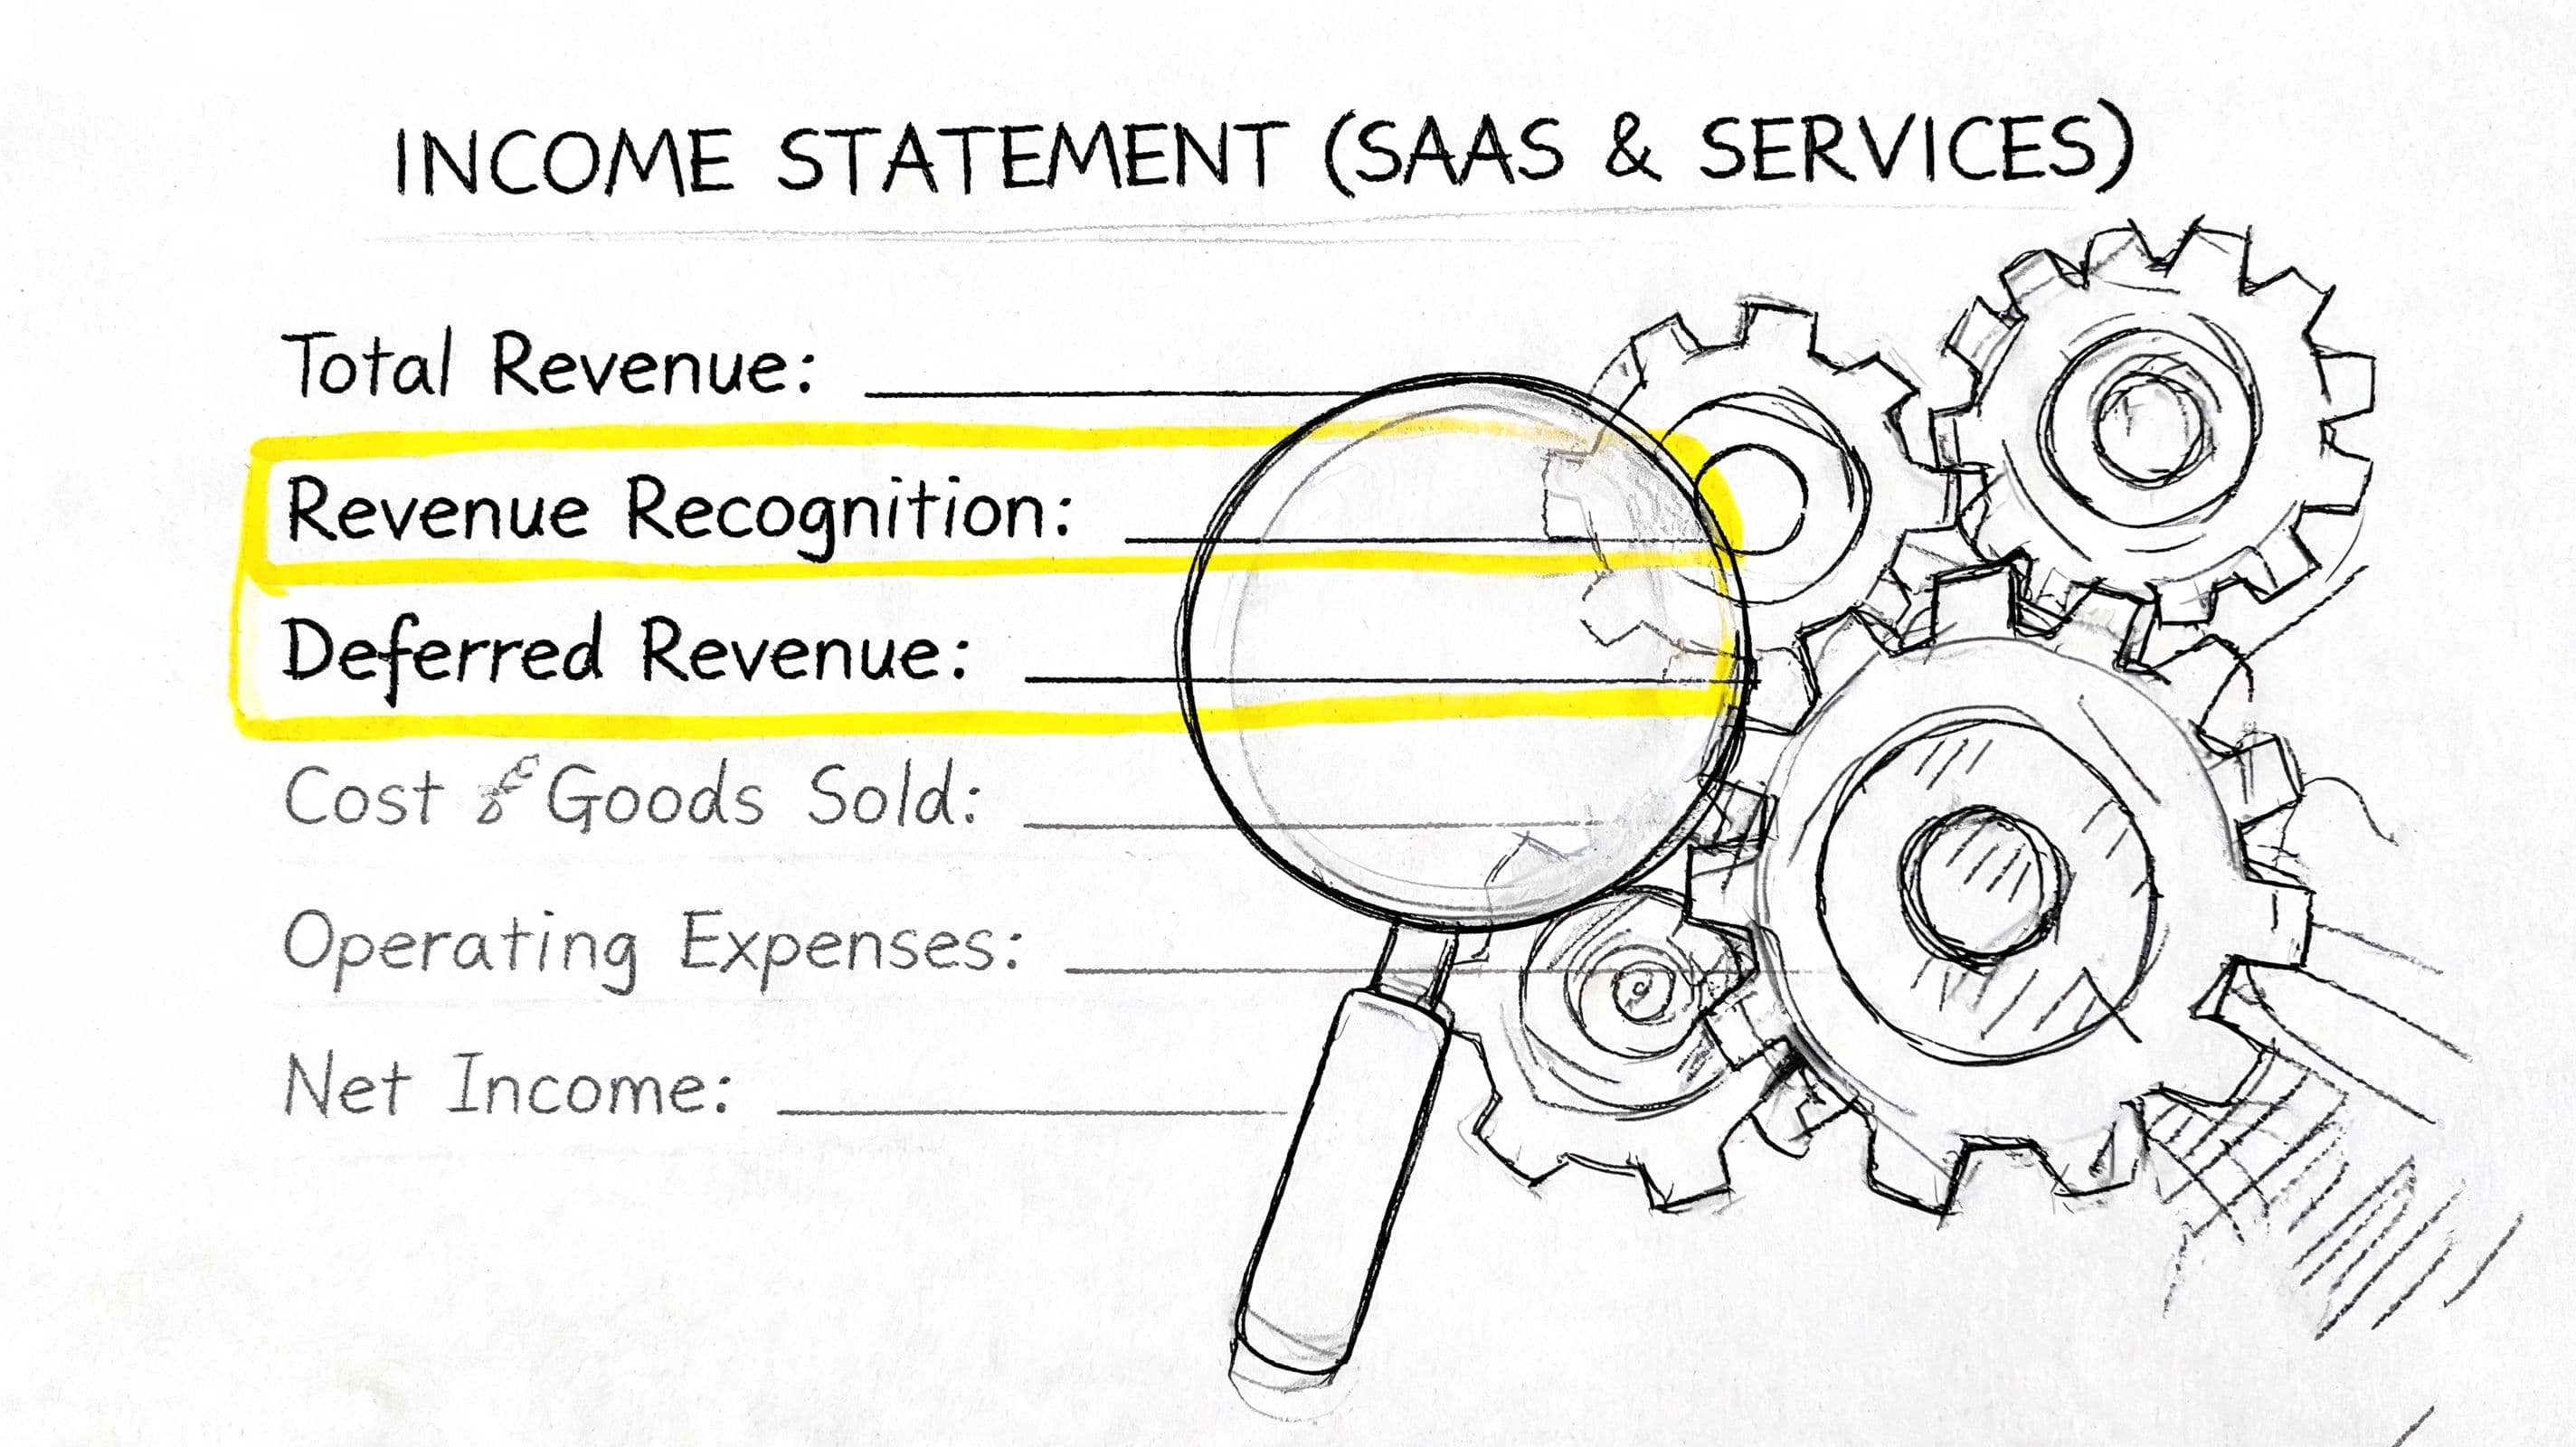
Revenue on the income statement is not the same as bookings
If you sell annual SaaS contracts, multi-month retainers, implementation packages, or milestone-based projects, the top-line number on your income statement follows accounting recognition rules. It does not just mirror what was signed or invoiced.
That’s why a founder can close a large contract and still not see a matching jump in recognized revenue for the month. The sale matters. But the income statement only records the portion earned in the reporting period.
Operational metrics and financial reporting need a bridge. ARR, MRR, bookings, and pipeline are useful. None of them replaces recognized revenue.
Deferred revenue matters more than most founders realize
If a customer pays before you’ve delivered the service period, that cash doesn’t instantly become income statement revenue. It often sits as deferred revenue until you earn it.
That liability account is one of the most useful signals in a recurring revenue business because it helps explain why cash and revenue move differently. It also helps you understand future revenue that is already contracted and paid.
If this topic has been fuzzy in your reporting, read this plain-English explanation of what deferred revenue is.
A clean SaaS income statement requires a clean bridge between bookings, billings, deferred revenue, and recognized revenue.
ASC 606 changes how founders should think about contracts
You don’t need to become a technical accountant, but you do need to understand the business implications of revenue recognition under ASC 606.
For SaaS and services businesses, the big issue is timing. Revenue gets recognized based on when performance obligations are satisfied. In plain English, that means your contract terms and delivery model shape what shows up on the income statement.
Pay attention to these areas:
-
Implementation work
If onboarding or setup is part of a broader service commitment, recognition may not line up with invoice timing. -
Multi-year contracts
The total contract value feels great in the sales meeting. The income statement spreads recognition based on the service period. -
Sales commissions
Some commissions may be capitalized and recognized over time rather than expensed immediately, depending on the facts and policy.
This is exactly why generic bookkeeping breaks down once a company starts scaling.
Build a simple bridge your team can review monthly
Every recurring revenue or project-based company should maintain a reporting bridge that connects operational numbers to GAAP revenue. It doesn’t need to be fancy. It needs to be consistent.
A useful monthly bridge includes:
- Bookings or signed contracts
- Amounts invoiced
- Cash collected
- Deferred revenue movement
- Revenue recognized on the income statement
If those five views don’t tie together, your reporting is incomplete.
For founders aiming to mature the business model, especially on the path toward larger scale, this broader discussion on scaling SaaS to $10 million is useful context because it reinforces how much operational rigor matters once recurring revenue starts compounding.
The misconception that causes the most confusion
Founders often assume the income statement should match the sales dashboard. It shouldn’t.
The sales dashboard shows commercial activity. The income statement shows earned performance for a period under accounting rules. Both matter. The mistake is expecting one report to do the job of the other.
When those views are reconciled properly, your board reporting improves, your fundraising narrative gets cleaner, and your internal decisions stop bouncing between two versions of the truth.
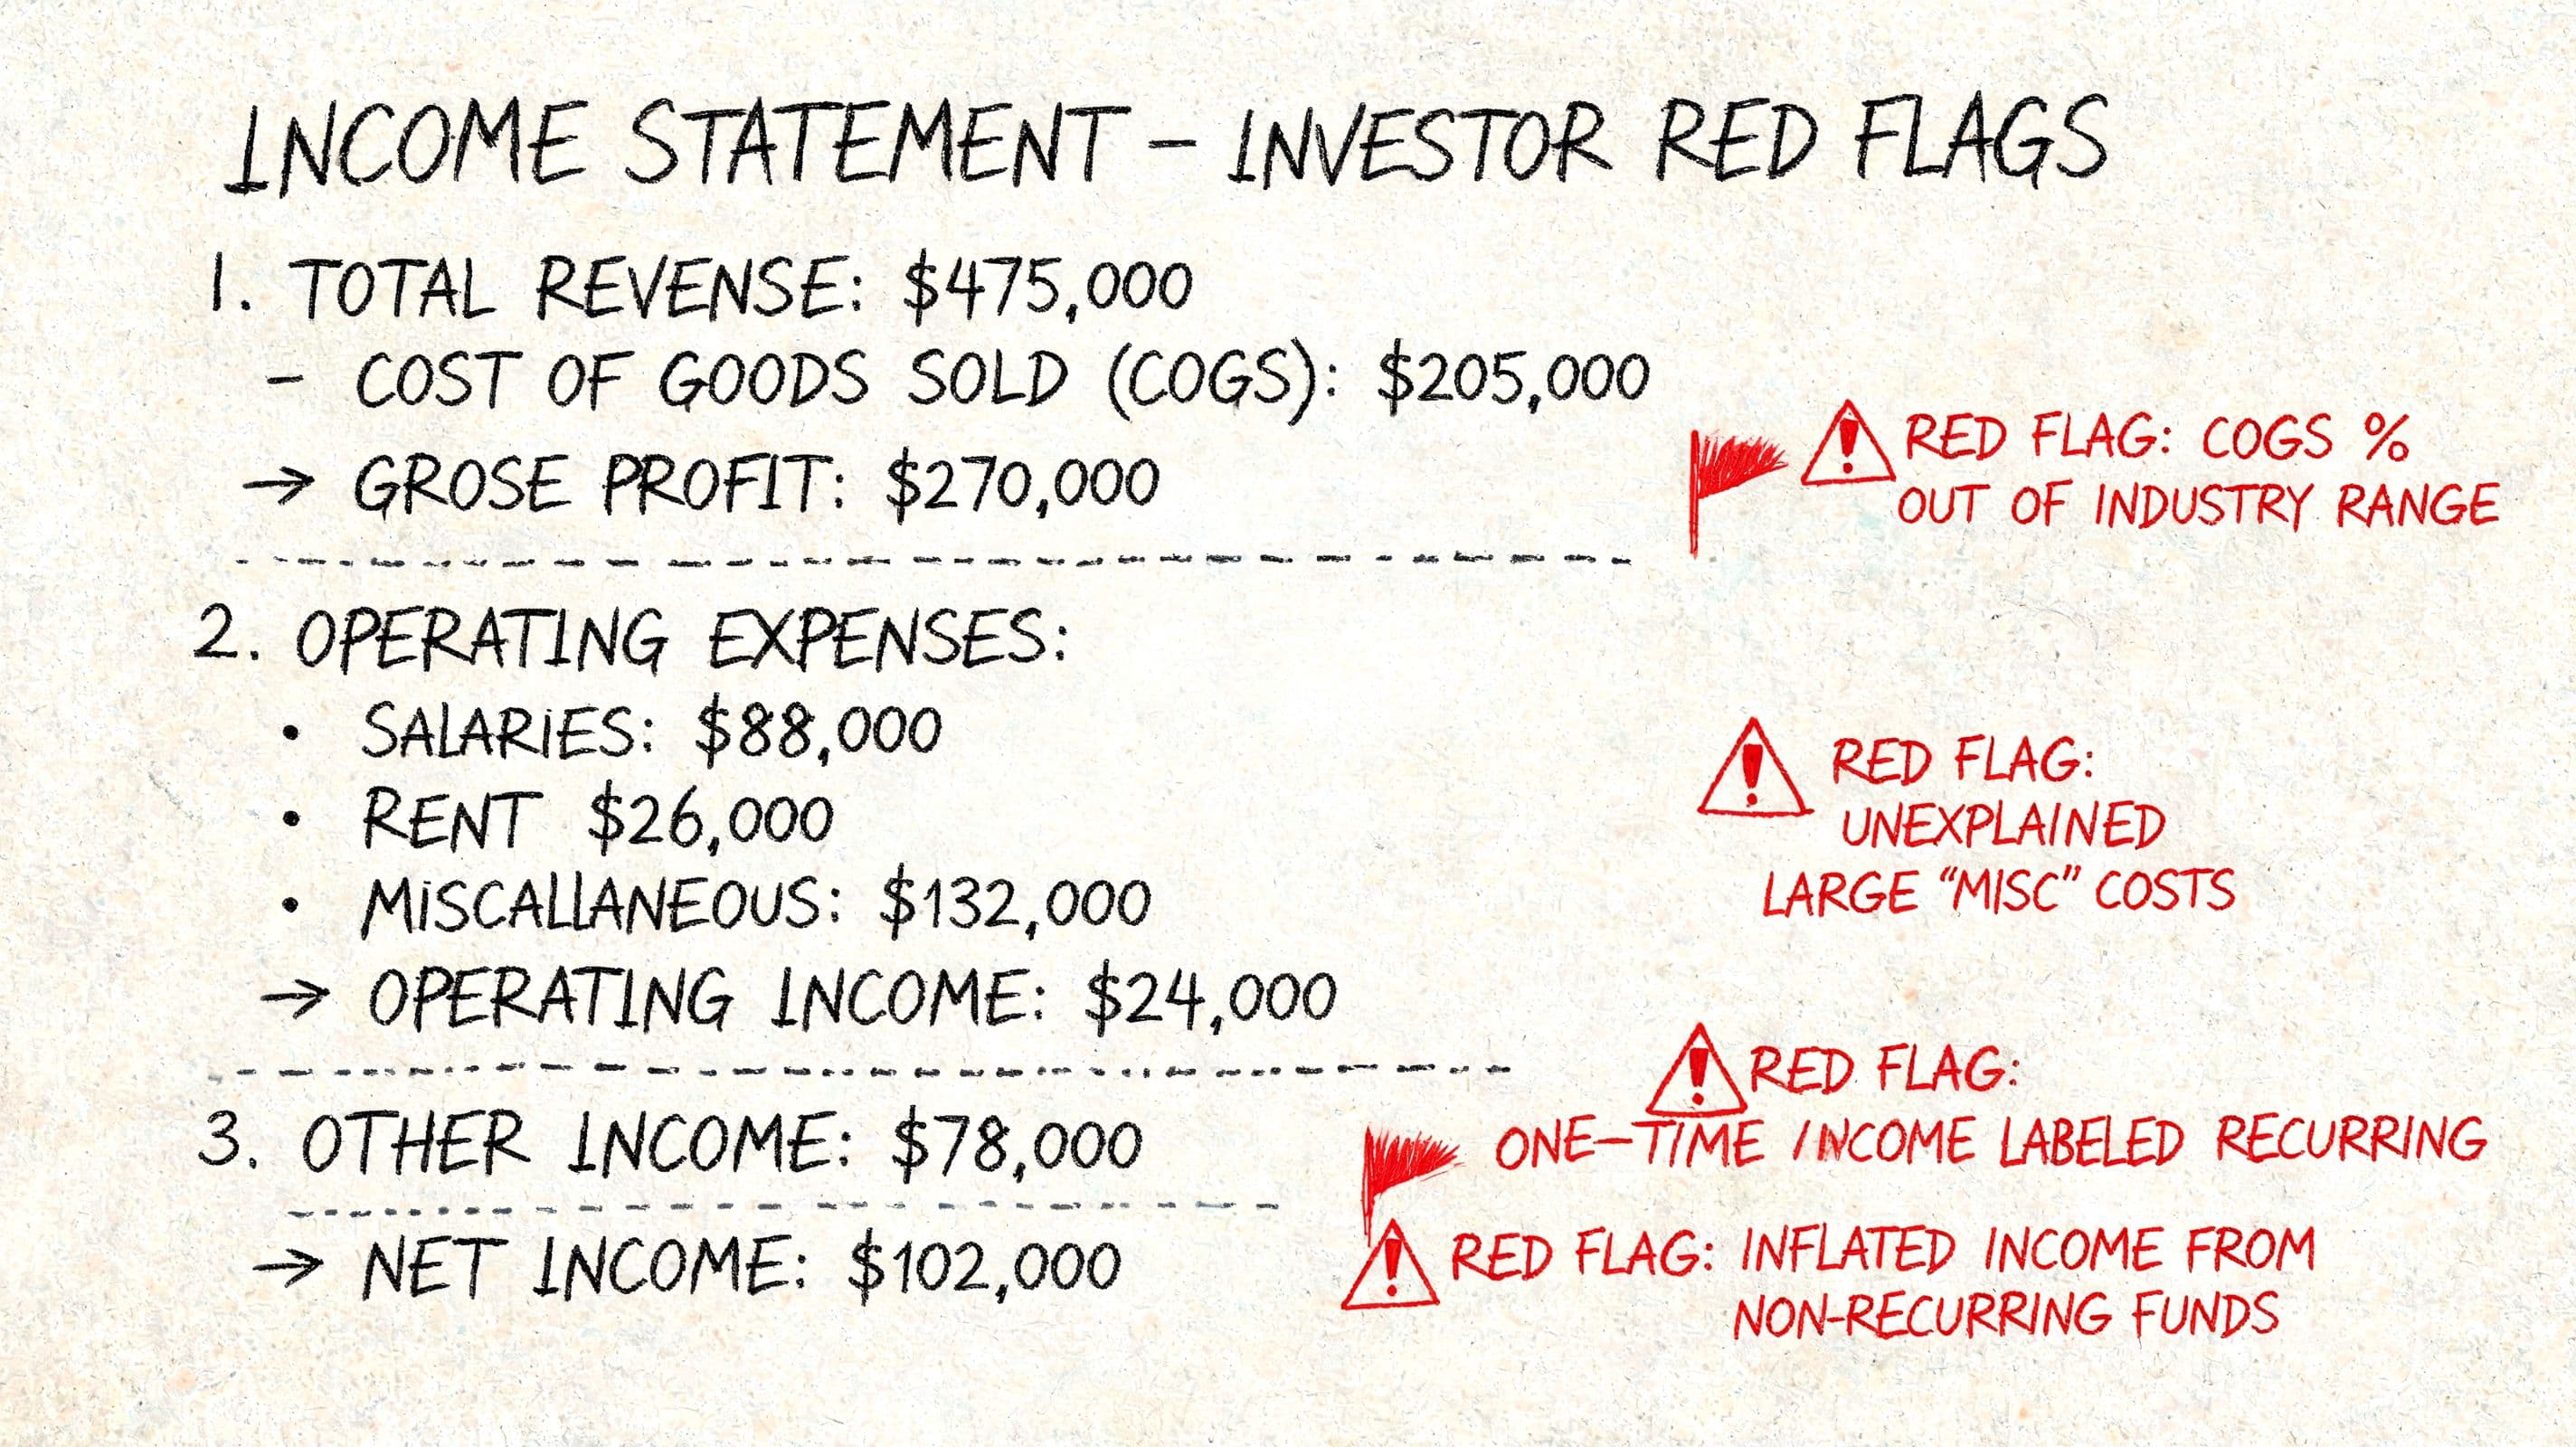
Common Red Flags and Reporting Mistakes to Avoid
Bad reporting rarely fails in an obvious way. It fails by making a weak business look healthier than it is, or by hiding a fixable problem until it is expensive.
For SaaS and service founders, the biggest mistake is reading the income statement as a compliance document instead of an operating tool. Investors will test whether your margins, revenue quality, and spending pattern hold up under scrutiny. You should do that first.
Revenue that looks good but behaves badly
A company that sells recurring contracts should not produce revenue patterns that swing wildly without a clear reason. Some seasonality is normal. Repeated lumpiness usually points to weak revenue recognition, too much project work mixed into the model, or customer concentration that makes revenue less predictable than the story suggests.
Look below the top line. If revenue is rising while gross profit is getting squeezed, you are buying growth with delivery effort, discounts, or support burden. That is not premium growth. That is expensive growth.
For SaaS, watch for implementation fees or services revenue masking weakness in subscription economics. For agencies and other service firms, watch for a few oversized projects creating the illusion of momentum.
Expense growth that outruns revenue
If operating expenses keep climbing faster than revenue for several periods, fix it. Do not explain it away.
Ask four questions:
- Why did this category increase?
- Was the increase planned?
- What measurable result came from it?
- Is this cost temporary or now part of the base business?
If your team cannot answer those questions quickly, your cost structure is drifting.
This matters even more in fundraising. Investors will tolerate deliberate spending ahead of growth. They will not tolerate vague spending with no payback logic. Sales and marketing should produce pipeline. Product and engineering should improve retention, expansion, or delivery efficiency. G&A should stay controlled. If a line item is growing without a business case, cut it or contain it.
Misclassification that flatters profit
This is one of the fastest ways to make bad decisions from clean-looking reports.
Typical examples include:
- Direct delivery costs buried in overhead
- Customer support treated as admin when it functions as service delivery
- Expenses capitalized aggressively to avoid current-period impact
These choices distort gross margin, which then distorts pricing, hiring, and investor conversations. A SaaS company with support, onboarding, and hosting costs pushed below gross profit can look more efficient than it is. A service business that hides contractor costs in operating expenses can convince itself projects are more profitable than reality.
If your team needs a cleaner foundation, use this guide on preparing financial statements that support management decisions. The goal is consistency, not cosmetic polish.
A short explainer can help your team sharpen pattern recognition before monthly review:
Net income that doesn’t match business reality
Do not celebrate net income that conflicts with what the business feels like operationally.
If the income statement shows profit while cash is tight, collections are slipping, deferred revenue is messy, or customer delivery is strained, treat that as a warning. The accounting may be technically correct, but the report is not giving management the full picture. Or worse, the close process is weak enough that timing issues are covering up operational problems.
Founders in SaaS should be especially careful here. Recognized revenue can look fine while churn, concessions, or rising service load are undermining the model. Service firms face the opposite problem. Reported profit can look acceptable while underbilling, write-offs, or utilization issues are eating future margin.
Questions to ask your finance team immediately
| Red flag | Ask this question |
|---|---|
| Declining gross margin | What exact direct costs changed, and when did that change start? |
| Lumpy recurring revenue | Which contracts or recognition rules explain the volatility? |
| Fast-growing operating expenses | Which hires, tools, or programs drove this, and what return are we seeing? |
| Strong profit but weak cash position | What timing items explain the gap between earnings and cash? |
| Unusually clean margins | Are any direct costs sitting in the wrong expense category? |
Healthy skepticism is part of the job. If a number looks too clean, too smooth, or too flattering, assume you need a better explanation.
Your Action Plan for an Investor-Ready Income Statement
If your current review process is “glance at revenue, ask about cash, move on,” fix that this month.
Start with the last three monthly income statements. Put them side by side. Don’t wait for your next board deck or diligence request. The fastest way to improve reporting quality is to inspect the statements you already have and force clarity line by line.
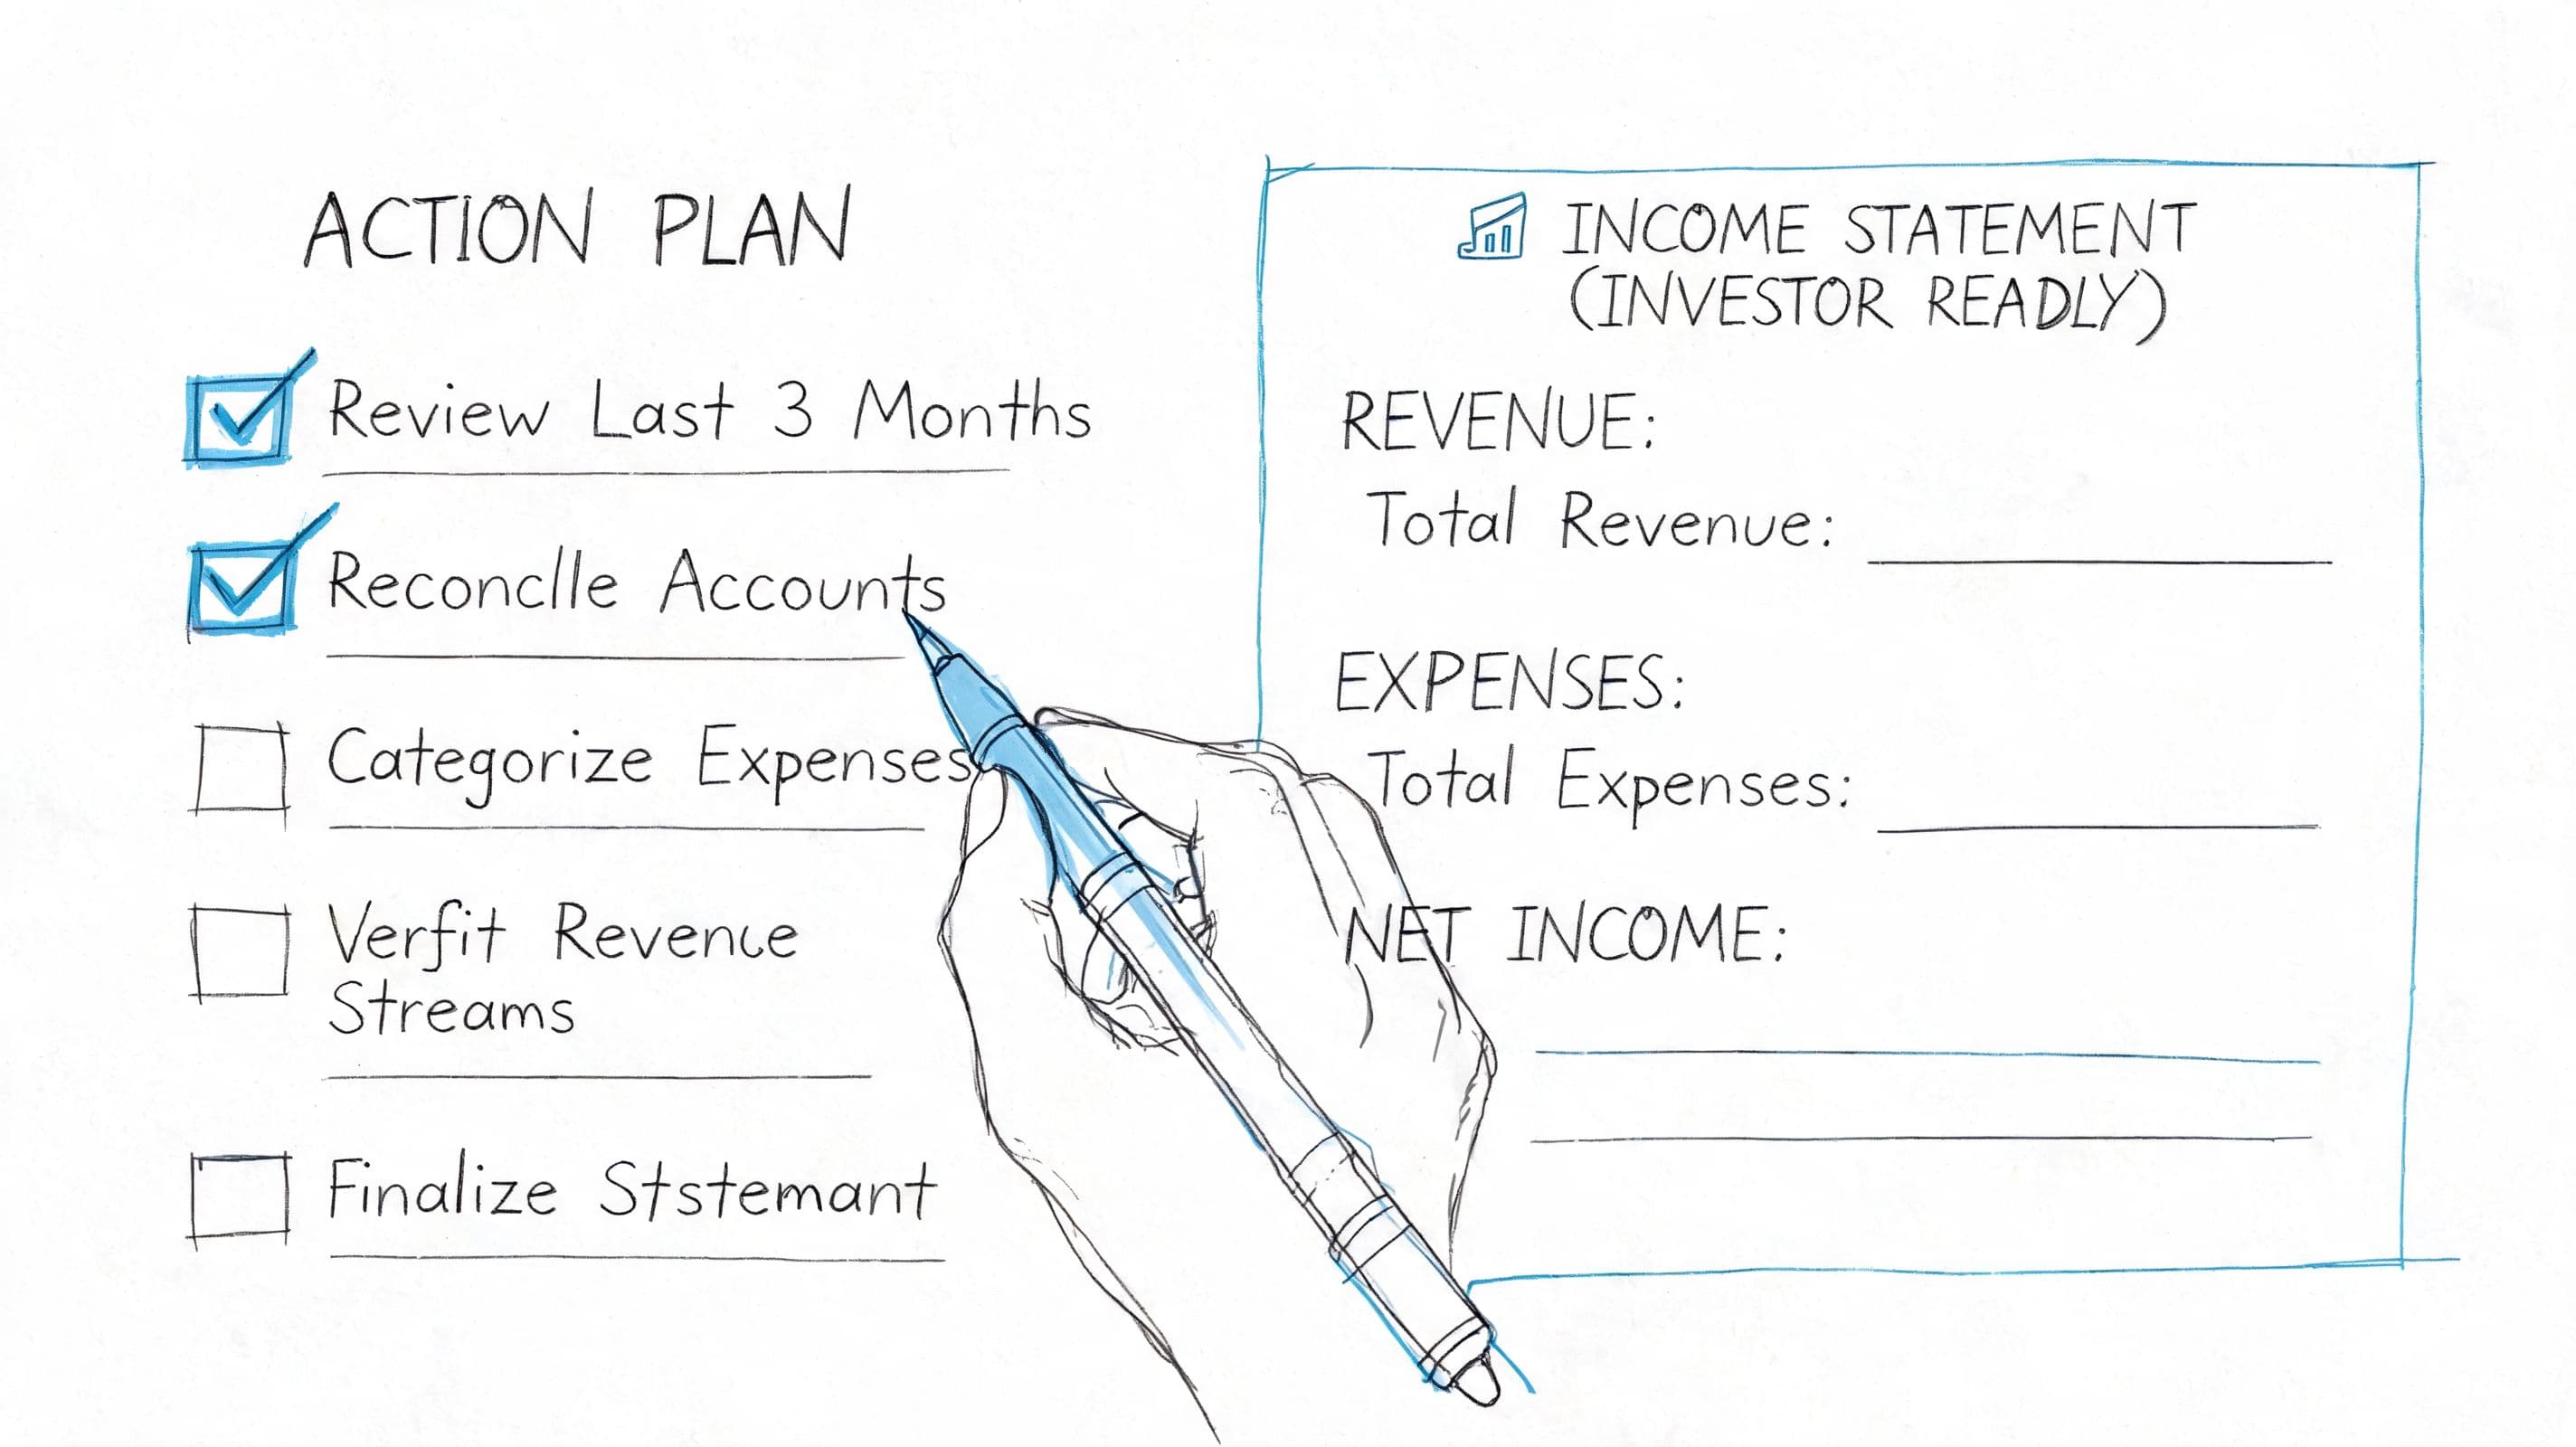
Do these five things next
-
Pull the statements and standardize them
Make sure the categories are consistent across periods. If one month classifies a cost as COGS and the next puts it in overhead, analysis is useless. -
Run vertical analysis
Convert major line items into percentages of revenue. You want to see cost structure, not just dollar movement. -
Run horizontal analysis
Compare month over month and year over year where possible. Look for trends, not isolated explanations. -
Ask three hard questions
Ask what changed in gross margin, what drove operating expense movement, and whether recognized revenue matches the underlying contract and delivery reality. -
Tighten your close process
Late statements create bad management decisions. Stale data is not neutral. It’s expensive.
Your income statement should help you make decisions while they still matter.
What investor-ready actually means
Investor-ready doesn’t mean pretty formatting. It means your numbers are timely, internally consistent, and easy to defend. A serious investor will want to understand how revenue is recognized, what sits in COGS, why margins moved, and whether operating expenses reflect intentional growth or sloppy control.
If your team needs a clearer framework for assembling statements that stand up under scrutiny, this guide on how to prepare financial statements is a strong next step.
The right outcome here is simple. You should be able to open your income statement, explain every major line, identify what improved, flag what slipped, and know what action to take next.
If your income statement still raises more questions than it answers, Jumpstart Partners can help you get to investor-ready reporting with cleaner closes, sharper financial visibility, and statements you can use to run the business.