Financial Operations
What Is Operating Income and Why You Should Care
What is operating income? This guide explains how to calculate it and why it's the most critical metric for assessing your business's core profitability.
ByJumpstart Partners, CPA, QuickBooks ProAdvisor
··19 min readAs a founder, it’s easy to get obsessed with revenue. But chasing top-line growth without watching profitability is a classic mistake that sinks promising companies. High revenue just proves you’re busy—it doesn’t prove you have a healthy, sustainable business.
The real measure of your company’s core financial strength is operating income. It’s the one metric that tells you if you are actually making money from your primary business activities—the thing you are in business to do. It’s the proof that your business model works.
Your Core Profitability Starts with Operating Income
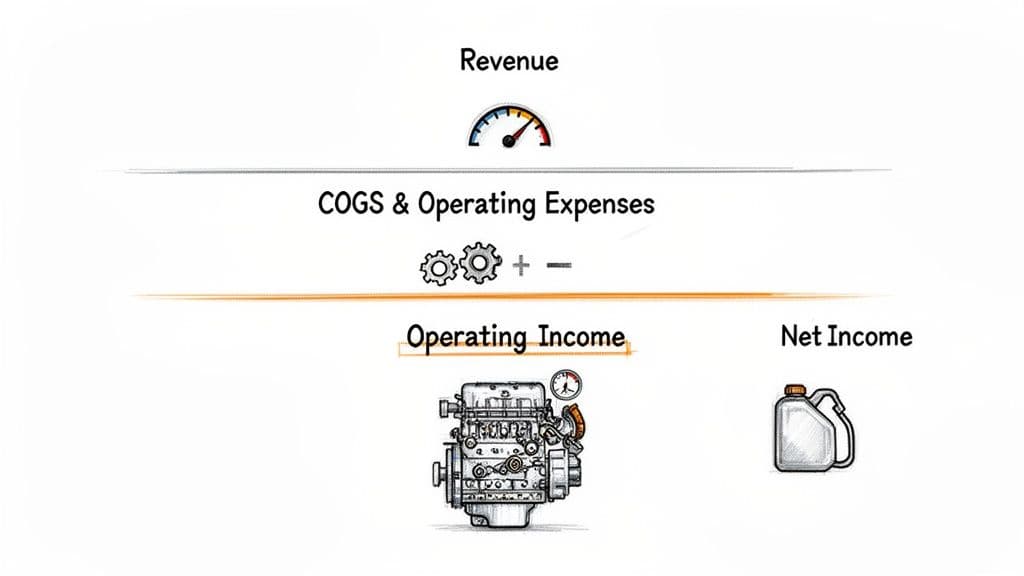
Think of your financials like a car's performance metrics:
- Revenue is your top speed. It’s an impressive number, but it says nothing about how much fuel you're burning to get there.
- Net Income is the fuel left in the tank after a long, complicated road trip. It accounts for everything, including unexpected detours (interest payments) and toll roads (taxes).
- Operating Income is the engine's efficiency. It shows how effectively your business converts fuel (day-to-day spending) into power (profit). It’s the purest signal of your business model’s viability.
To get a clearer picture, let's break down the calculation in a simple table.
Operating Income at a Glance
This table shows the essential parts of the operating income formula, clarifying what gets included and what's left out.
| Component | Description | Example for a SaaS Business |
|---|---|---|
| Revenue | All income generated from selling your products or services. | $500,000 in Monthly Recurring Revenue (MRR) and one-time setup fees. |
| Cost of Goods Sold (COGS) | Direct costs required to deliver your service. | $75,000 for hosting (AWS), third-party data APIs, and customer support salaries. |
| Operating Expenses (OpEx) | All other costs to run the business, excluding interest and taxes. | $250,000 for sales commissions, marketing spend, engineering salaries (R&D), and office rent (G&A). |
| Operating Income | The profit left over after subtracting COGS and OpEx from Revenue. | $175,000 ($500K - $75K - $250K) |
| Non-Operating Items (Excluded) | Costs and income not related to core business activities. | Interest payments on a venture debt loan or income from selling an old server. |
This breakdown shows exactly how operating income isolates the performance of the core business, ignoring financing and tax strategies.
Why It’s the Metric That Matters Most
For a growing SaaS company, digital agency, or professional services firm, this number is everything. It answers the one question that matters most to smart investors and operators: Can you make money doing what you do, day in and day out?
It cuts through the noise of venture debt, tax planning, and one-off gains to show your raw operational performance.
"Founders get fixated on fundraising headlines and top-line growth. But smart investors and operators look straight to operating income. It’s the clearest signal of a sustainable business model and disciplined execution. It shows you can actually make money." – Mike Lingle, Co-founder, Jumpstart Partners
A strong, growing operating income proves you have a scalable, profitable model that has found product-market fit. On the other hand, a weak or declining figure is a major red flag, pointing to problems with your pricing, cost structure, or operational efficiency. For a deeper dive, check out our guide on effective profit and loss management.
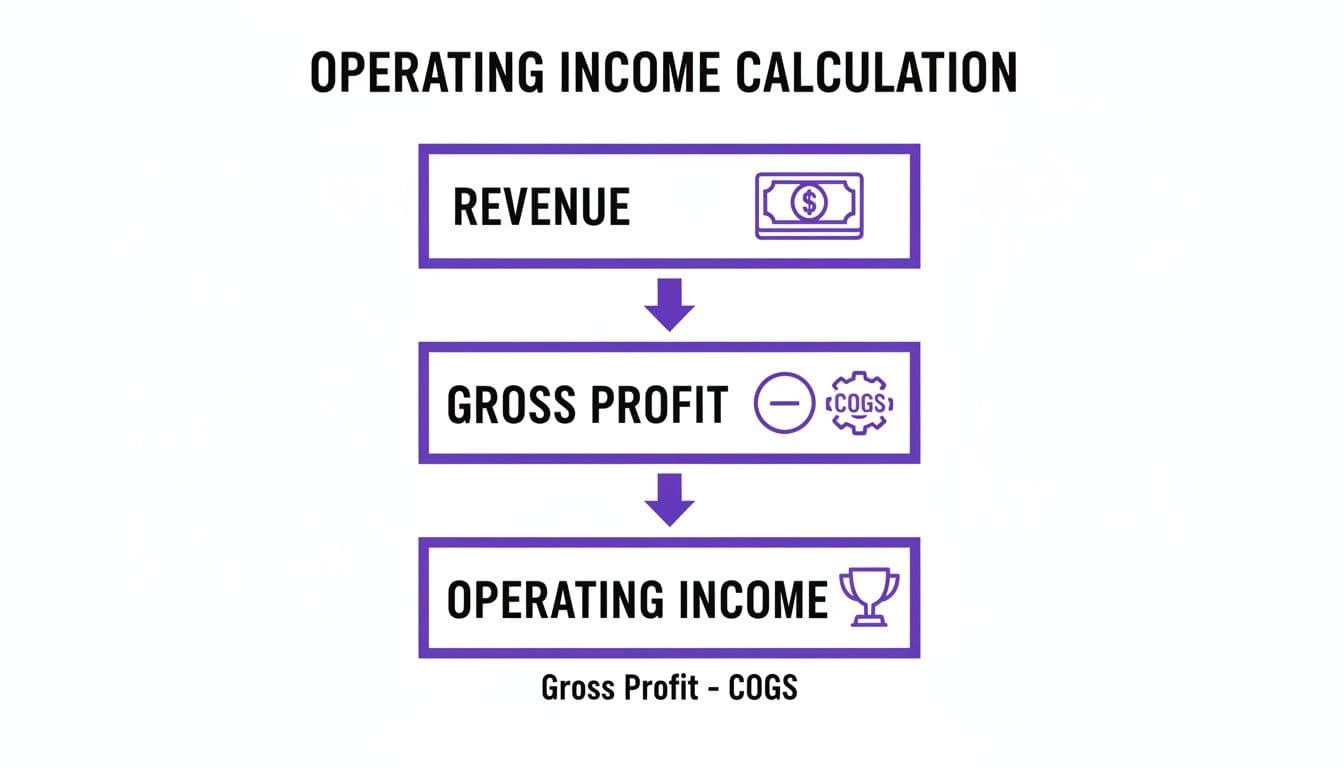
Calculating Operating Income for Your Business
The formula for operating income is simple on paper. But knowing the theory and actually applying it to your business are two very different things. This is where most founders get tripped up—in the details of what counts as COGS versus OpEx.
Let's walk through a worked calculation for a SaaS company and a digital agency. These aren't just abstract exercises; they're templates for how to see the true profitability of your own operations. For a more detailed breakdown of the mechanics, this guide on how to calculate income from operations is a great resource.
SaaS Company Calculation Example
Let's break down the numbers for a SaaS business that brought in $200,000 in Monthly Recurring Revenue (MRR). That's your top line. From there, you subtract the direct costs of delivering the software.
Your Cost of Goods Sold (COGS) is anything required to keep the product running for your customers. This includes:
- Hosting costs (e.g., AWS, Azure): $18,000
- Third-party API and data fees: $5,000
- Customer support salaries and tools: $12,000
That gives you a total COGS of $35,000. When you subtract that from revenue, you get a Gross Profit of $165,000. Getting this part right is critical, which is why we have a separate guide on how to calculate gross margin you might find useful.
Next, you subtract the money you spend to run and grow the business—your Operating Expenses (OpEx):
- Sales & Marketing (S&M): All salaries, commissions, and ad spend, totaling $60,000.
- Research & Development (R&D): Your engineering and product team salaries, totaling $55,000.
- General & Administrative (G&A): Executive pay, rent, and general business software, totaling $25,000.
With a total OpEx of $140,000, you can now put all the pieces together.
| Line Item | Amount |
|---|---|
| Total Revenue | $200,000 |
| Less: Cost of Goods Sold (COGS) | ($35,000) |
| Gross Profit | $165,000 |
| Less: Operating Expenses (OpEx) | ($140,000) |
| Operating Income | $25,000 |
The company’s operating income for the month is $25,000. This translates to an operating margin of 12.5% ($25,000 / $200,000). According to OpenView's 2024 SaaS Benchmarks, companies in the $1M-$20M ARR range typically have median operating margins between 1% and 12%, so this is a solid number that signals an efficient, healthy operation for a growing SaaS business.
Digital Agency Calculation Example
Now for a service business. The logic is identical, but the line items shift. For an agency, COGS is almost entirely driven by the people delivering the client work.
Let’s say your agency generated $150,000 in revenue from projects and retainers this month. Your biggest direct cost is your team's billable time.
Your Cost of Goods Sold (COGS) includes:
- Salaries for billable staff (designers, developers, strategists): $70,000
- Freelancer and contractor payments for project work: $10,000
- Project-specific software or assets: $2,000
Total COGS comes to $82,000, which leaves you with a Gross Profit of $68,000.
Then come the Operating Expenses (OpEx) to keep the lights on and bring in new work:
- Sales & Marketing (S&M): Non-billable sales staff salaries, marketing, and business development: $20,000
- General & Administrative (G&A): Admin salaries, rent, insurance, and agency-wide software: $18,000
Your total OpEx is $38,000. Time for the final calculation.
| Line Item | Amount |
|---|---|
| Total Revenue | $150,000 |
| Less: Cost of Goods Sold (COGS) | ($82,000) |
| Gross Profit | $68,000 |
| Less: Operating Expenses (OpEx) | ($38,000) |
| Operating Income | $30,000 |
The agency’s operating income lands at $30,000. That gives you a 20% operating margin—a strong sign that your pricing is right and your operational costs are well-managed. These examples give you a clear playbook to follow for your own company's analysis.
Comparing Operating Income to Other Profit Metrics
Walk into a board meeting and mix up EBITDA with operating income, and you’ll see investors’ eyes glaze over—or worse, you'll lose their trust. As a founder or CEO, you cannot afford to be fuzzy on your profit metrics. Each one tells a different, crucial part of your financial story.
Too many leaders get fixated on a single number, like Gross Profit or EBITDA. The problem is these metrics can paint a deceptively rosy picture, hiding serious cash drains in your day-to-day operations. Understanding the nuance is what separates founders who build truly healthy businesses from those who just chase vanity metrics.
It’s all about peeling back the layers—first the direct costs of what you sell (COGS), then the costs of running the business itself (OpEx), to finally arrive at your true operating profit.
Profitability Metrics Compared
| Metric | Formula | What It Measures | Best Use Case |
|---|---|---|---|
| Gross Profit | Revenue - COGS | Profitability of the core product or service itself, before overhead. | Evaluating product pricing, production efficiency, and gross margins. |
| Operating Income | Gross Profit - Operating Expenses | Profitability of the core day-to-day business operations. | Assessing operational efficiency, expense management, and core business viability. |
| EBITDA | Operating Income + D&A | Profitability before non-cash expenses, interest, and taxes. | Comparing companies with different capital structures or asset bases. |
| Net Income | Operating Income - Interest - Taxes | The final "bottom-line" profit after all expenses are accounted for. | Understanding the ultimate profitability after financing and tax obligations. |
This table makes the distinctions clear. Now let's break down the practical implications.
Operating Income vs. Gross Profit
Gross Profit (Revenue - COGS) is your first checkpoint. It tells you if you're making money on the basic act of selling your product or service. A healthy gross margin is a great start, but it’s only the first step.
Operating Income forces you to face a much tougher reality by subtracting all your Operating Expenses (OpEx)—the salaries, rent, marketing spend, and software subscriptions it takes to keep the lights on and grow. It answers the real question: Is the business itself profitable, after paying for everything needed to run it?
You can have fantastic gross margins and still be bleeding cash if your operating expenses are out of control.
Common Misconception: Operating Income vs. EBITDA
EBITDA, which stands for Earnings Before Interest, Taxes, Depreciation, and Amortization, is a darling of the fundraising world. You calculate it by taking operating income and adding back depreciation and amortization. The idea is to approximate cash flow by ignoring non-cash expenses.
Here’s the trap: Depreciation isn’t some imaginary number. It represents the very real cost of your assets—like servers, laptops, and office furniture—wearing out. Relying only on EBITDA can make a capital-intensive business look far healthier than it is.
Operating income is a more honest and conservative measure of operational performance because it accounts for these real, ongoing costs of doing business.
Operating income vs. Net Income
Net Income, often called the "bottom line," is what’s left after you’ve subtracted everything—including interest on debt and taxes. It shows your ultimate profit, but it can also be misleading.
A one-time tax credit or a uniquely favorable loan can make a fundamentally weak operation look profitable on the bottom line. Operating income strips out the effects of financing decisions (interest) and tax strategies, giving you a clean look at the underlying health of your business model. This is exactly why savvy investors zero in on it.
While benchmarks vary, data from Vena Solutions shows an average gross profit margin of 36.56% across industries. However, operating margins can be drastically different, highlighting how critical operational efficiency is.
It’s also important to remember what operating income doesn't show. It’s a measure of profitability, not cash. A business can have positive operating income but still run out of money if customers aren't paying their bills on time. For that, you need to look at a related, but distinct, metric. You can learn more about operating cash flow in our guide.
Decoding the Red Flags in Your Operating Income
A declining operating income is a major warning flare. But it’s almost always a symptom, not the disease itself. To protect your business, you need to learn how to read the signals like a seasoned diagnostician. This is your toolkit for spotting the real issues before they put your company’s health at risk.
Red Flag 1: Improper Revenue Recognition
One of the most common and dangerous traps for SaaS and service firms is sloppy revenue recognition. Under GAAP—specifically ASC 606—you can only recognize revenue as you earn it, not just when a client pays you. If a customer pays you $60,000 upfront for a 12-month contract, you can only book $5,000 in revenue each month.
Booking the full $60,000 in month one makes your operating income look fantastic on paper. But it gives you a dangerously false sense of security and completely misleads investors about your actual performance. It's a ticking time bomb that eventually detonates, forcing painful restatements and destroying your credibility.
This isn't just about being compliant; it's about making decisions based on reality. The margin for error is shrinking. Research into long-term US firm dynamics shows that while the 20th percentile of firms had a healthy 8.6% average operational profitability from 1950-1980, that number plunged to an average of -9.7% annually after 1982. This just goes to show how critical disciplined financial oversight has become.
Red Flag 2: SG&A Costs Outpacing Revenue Growth
Here's a classic scaling trap: your sales, general, and admin (SG&A) expenses are growing faster than your top line. You're hiring more salespeople, cranking up the marketing spend, and adding back-office staff, but your operating income is flat or, even worse, shrinking.
This is a clear signal that your operational efficiency is breaking down. It means your spending isn't producing a proportional return on investment.
"An undisciplined G&A budget is the silent killer of otherwise healthy companies. Founders get so focused on growth they forget that every dollar spent on overhead must be justified by profit. If your back-office costs are growing faster than your gross profit, you're not scaling—you're just getting bloated." – Mike Lingle, Co-founder, Jumpstart Partners
The easiest way to spot this is to track your SG&A costs as a percentage of revenue. If that ratio is climbing month after month, it's a huge red flag that your cost structure is becoming unsustainable.
Red Flag 3: Inconsistent or Declining Operating Margins
Your operating margin (Operating Income / Revenue) is your single best indicator of core profitability. If it’s volatile or trending down, it points to deeper issues that need immediate attention.
- Pricing Pressure: Are you discounting too aggressively just to close deals? Are competitors driving your prices down? A falling margin can mean your product is slowly becoming a commodity.
- Loss of Operational Discipline: Are team expenses creeping up without oversight? Have you lost control of all those software subscriptions or travel costs? Small leaks can eventually sink a big ship.
- Shifting Business Mix: If you run a service business, a declining margin might show you're taking on lower-value projects. It could also mean the contribution margin on new work is getting thinner. You can read more about contribution margin in our detailed guide.
Seeing these red flags is the first step. The next, and more important one, is taking action. If you can’t immediately diagnose the root cause of these issues, you have a visibility problem—and you need to fix that before it turns into a solvency crisis.
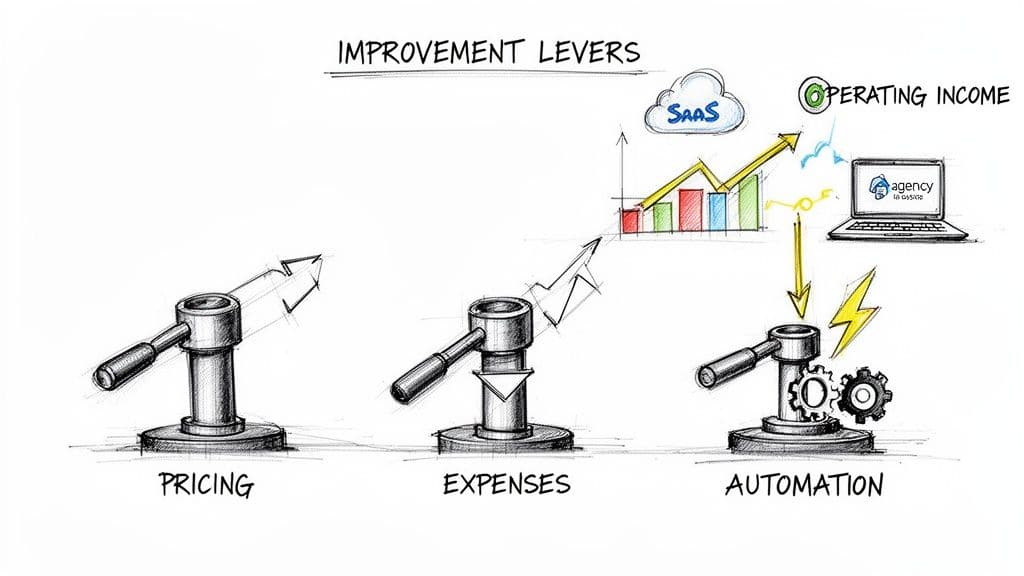
Actionable Next Steps: How to Improve Your Operating Income
Knowing your operating income is one thing. Actually making it better is what separates the founders who build lasting businesses from those who just tread water. This isn't about abstract theory; it's about pulling the right levers in your business to drive real, sustainable profit. It comes down to three areas: your pricing, your spending, and your team's efficiency.
1. Price for Value, Not Just to Cover Costs
The fastest way to boost operating income is to get more revenue out of your existing cost structure. Too many founders fall into the trap of underpricing their services because they're afraid to lose a deal. It's time to stop competing on price and start selling on the value you deliver. A real pricing review means digging into the numbers:
- Find Your Best Customers: Which clients or customer segments are your most profitable? What specific, high-value problem do you solve for them? Your price must reflect that value, not just your internal costs.
- Create Tiers: For SaaS companies, this means building premium tiers with advanced features that high-value customers will happily pay for. For agencies, it’s about creating premium service packages that solve bigger problems and command higher rates.
- Push for Annuals: Offer a small discount for annual prepayments. This is a huge win—it locks in revenue, boosts your cash flow, and dramatically increases customer lifetime value.
2. Get Brutal with Your Expense Review
As companies grow, wasteful spending inevitably creeps in. Forgotten software subscriptions, marketing campaigns that don't deliver, and general overhead bloat are the silent killers of your profit margin. A forensic-level review of your operating expenses isn't optional.
Start by exporting every single line item from your OpEx. Go through it and ask the hard questions. Which software tools have low user adoption? Is that big marketing channel actually delivering a positive ROI? Is your G&A spend growing faster than your revenue? The goal isn't to slash and burn. It's to stop funding things that don't work and reallocate that cash to initiatives that will actually drive growth. To do this right, you need a framework. You can learn more about how to define operating budgets that align with your strategic goals.
3. Automate the Repetitive, Free Up Your People
Your team's time is your most valuable—and most expensive—asset. Every hour they spend on manual, repetitive tasks is a direct hit to your operating income. Investing in automation is one of the highest-leverage moves you can make.
- Automate Lead Nurturing: Use marketing automation to handle lead qualification and initial follow-up. This frees up your expensive sales team to focus their time on closing high-value, ready-to-buy deals.
- Systematize Project Management: If you're an agency, use project management tools to automate task assignments, time tracking, and client reporting. You'll cut down on the non-billable admin hours that eat into project profitability.
- Outsource the Finance Function: Instead of sinking capital into hiring an expensive, full-time finance team, you can partner with an outsourced controller service. This is the ultimate efficiency play for a growing business.
This is exactly where a partner like Jumpstart comes in for businesses in the $500K-$20M range. We don't just "do your books." We give you the investor-ready financials, a 5-day close, and the expert guidance you need to systematically improve your operating income. We help you turn your financial data into a roadmap for driving both your profits and your company's valuation.
Frequently Asked Questions About Operating Income
Even after you get the hang of what operating income is, a lot of practical questions pop up when you start applying it to your own business. Here are the straight-talk answers to the most common questions we hear from founders.
Is a Negative Operating Income Always a Bad Sign?
Not always, but it demands scrutiny. For high-growth startups, it can actually be part of the plan. Many SaaS companies, for example, will deliberately run a negative operating income because they're pouring money into sales and marketing to grab market share, funding the loss with venture capital.
The real question is whether it's a strategic choice with a clear path to profitability. If your operating income is in the red and you don't have a solid plan or the capital to back it up, that's a massive red flag for investors and a serious threat to your business.
What Is a Good Operating Margin for My Business?
This is one of those "it depends" questions, but there are absolutely solid benchmarks you can use to see how you stack up.
| Business Type | Revenue | Healthy Operating Margin | Source |
|---|---|---|---|
| SaaS Companies | $1M-$20M ARR | 1% to 12% (Median) | OpenView 2024 SaaS Benchmarks |
| Digital Agencies / Pro Services | $500K-$20M | 15% to 25% | Industry Standard |
If your margins are consistently falling short of these numbers, it’s a strong signal that you’ve got issues with your pricing, operational efficiency, or cost controls. For service firms trying to bump up their numbers, looking into strategies to increase your freelance income can be a great place to start, as it can boost revenue without adding a ton of fixed costs.
How Can I Track My Operating Income More Effectively?
You can’t. Not without disciplined, accrual-basis accounting and a chart of accounts that’s built for real analysis. You need the right systems and the commitment to use them.
First, your accounting software has to be set up to properly separate your Cost of Goods Sold from your Operating Expenses. If it's not, your numbers are guesswork. Second, you have to commit to a fast month-end close. You can't manage what you aren't measuring in near real-time.
This is frankly where most growing businesses get stuck, and it’s why outsourced controller services exist. Getting an expert to run a rapid close delivers investor-ready financials every single month, giving you a clear, up-to-date picture of your operating income so you can make decisions that actually matter.
Ready to get crystal-clear visibility into your operating income and drive real profit growth? Jumpstart Partners provides the expert, US-based controller services to get you there. Get a 5-day close and investor-ready financials every month.