Financial Operations
Lifetime Value Modeling for SaaS Finance Leaders
Lifetime value modeling turns one blended KPI into a range you can defend. Compare cohort, rule-based, and predictive methods with worked SaaS math.
ByJumpstart Partners, CPA, QuickBooks ProAdvisor
··16 min readIn 2025, Simon-Kucher's global telecommunications study reported that global telecommunications companies were realizing 60% of their potential customer value, while UK operators were realizing approximately 50%, based on a survey of more than 15,700 consumers across 31 countries. Between four and five dollars of every ten available sat uncaptured in businesses with more customer data than you will ever have.
Your own lifetime value number is where that leakage starts. A forecast you can't defend becomes a pricing decision, a hiring plan, and a paid acquisition budget built on a figure nobody can trace back to an invoice. The fix isn't a fancier model. It's choosing the model your ledger can support, running the same customer through three formulas to see how far apart they land, and publishing a range by segment instead of one blended trophy number.
Table of Contents
- Why One Lifetime Value Number Misleads You
- Three Lifetime Value Models and When Each Wins
- Worked Formulas for Simple Cohort and Predictive LTV
- How to Build Lifetime Value for SaaS and Services
- Sample LTV for a SaaS Company and an Agency
- Red Flags That Break Lifetime Value Modeling
- Report LTV with CAC Before You Fundraise
Why One Lifetime Value Number Misleads You
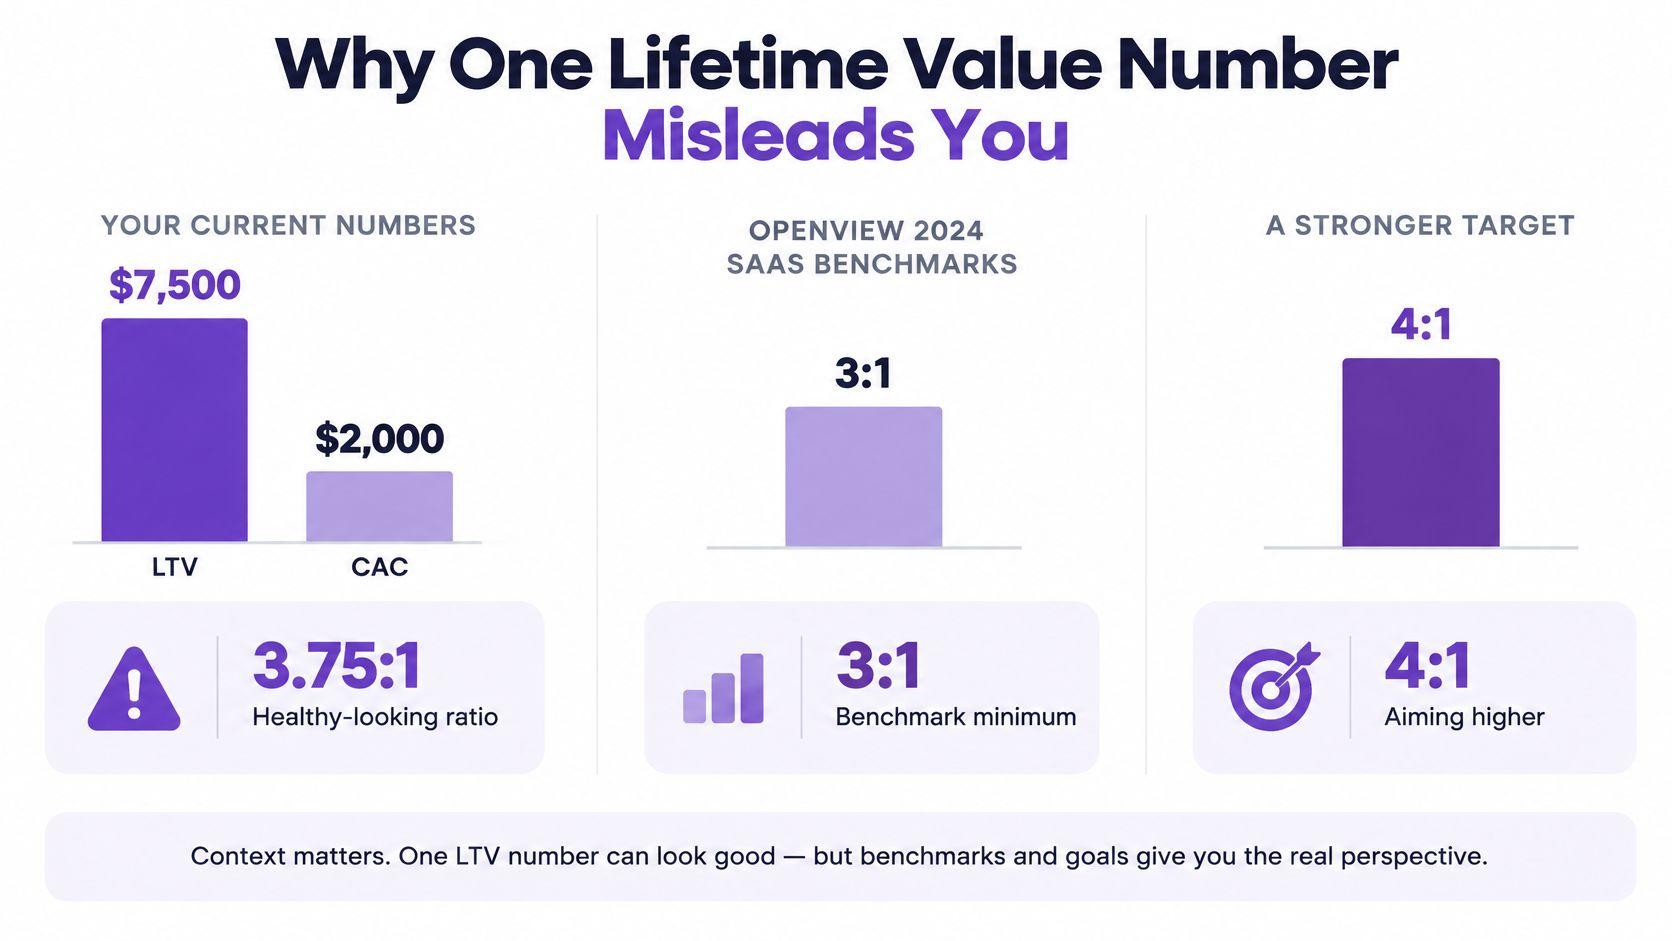
A founder stands up with one slide. Lifetime value $7,500, CAC $2,000, ratio 3.75 to 1. Everyone nods, because the number clears the bar.
According to OpenView's 2024 SaaS Benchmarks, that bar sits above 3 to 1 with CAC payback inside 12 months. Most companies between $500K and $20M of revenue can't produce either figure cleanly from their own books, so they borrow whatever their billing system reports and hope the diligence questions stay soft.
The shortcut behind that slide is average revenue per account divided by churn, and it misstates outcomes more often than the industry admits. A cohort-level analysis of SaaS lifetime value covering 35,512 quarterly customer cohorts across 3,331 accounts found that 28.3% of cohorts differed from the ARPA-divided-by-churn forecast by more than 50%. Roughly one cohort in four is off by half or more. That isn't noise around a good estimate. That's a different business.
The segment case. Take a book where annual contracts carry about $12,000 of margin-based value and month-to-month accounts carry about $2,800. Blended, the table looks acceptable: at a $2,000 CAC, someone in the room can argue 3.75 to 1. Split it and the annual segment returns 6 to 1 while the monthly segment returns 1.4 to 1, a cohort that fails the threshold and funds its own acquisition out of working capital it doesn't have. You didn't overstate the average. You hid a segment that loses money.
David Skok, whose Forentrepreneurs writing set the standard frame for SaaS unit economics, builds lifetime value from gross margin rather than revenue. Every dollar of ARR that leaves as hosting, support, or implementation cost was never yours to keep, so it can't count as customer value.
One thermometer cannot describe a building with hot and cold rooms. You have hot rooms (annual, expanding, low support) and cold rooms (monthly, static, high touch), and the blended reading describes neither. Stop leading the deck with the average. Lead with a model choice, the three formulas applied to the same customer, a build sequence your controller can run, and a reporting package that shows the range. Get the rest of the metrics right alongside it, starting with the SaaS unit economics metrics that actually matter.
Three Lifetime Value Models and When Each Wins
A useful lifetime value model is a forecast with a confidence label: contribution margin by segment, stated as a range, with the churn rule and cohort age attached. If the output looks exact before your oldest cohort has lived through the period you are forecasting, treat the precision as decoration.
Pick the model by how churn is observed and how profit is proven. Sophistication is not evidence. In non-contractual books there is no cancel event, so churn is inferred from purchase gaps; change the inactivity window and the answer moves. That is the practical weakness behind many accuracy-first churn exercises: a model can rank risk well and still miss the accounts worth saving, because high value and high departure probability can show up together.
| Model | Use it when | Churn you use | What you publish | Where it fails |
|---|---|---|---|---|
| Cohort | Contractual SaaS or retainers with a few thousand customers or fewer | Logo and revenue churn by start-month vintage | Margin LTV by segment, with a mature-cohort tail | Immature cohorts look too loyal; small cohorts swing on a few accounts |
| Rule-based | Services or agencies with known terms and short history | Contract end date, or a written inactivity window | One expected value per offer or client type | Ignores expansion, contraction, and early cancel |
| Predictive | Large or non-contractual books where cancel is not observed | Inferred from purchase gaps or a survival curve | A distribution and a prediction interval | Bad labels, thin cost data, or privacy-limited identity |
The verdict by business type
Contractual SaaS and retainer-based agencies under a few thousand customers: build the cohort model on contribution margin. It is auditable, it reconciles to your general ledger, and nobody can argue with what your own customers already paid. When cohorts are young, this beats a blended average and a machine-learning score because it separates observed cash from extrapolated tail.
Non-contractual or high-volume repeat purchase books: use predictive methods, buy-till-you-die styles such as BG/NBD or a survival curve, because there is no cancel button to count and a cohort table of dormant accounts tells you nothing.
Professional services firms whose history is shorter than the life you're forecasting: run a rule-based model as the interim answer, provided the rule is written down, dated, and owned by one person.
Decision rule: if you can't tie a model's output back to recognized revenue and gross margin in the ledger, it isn't a better model. It's a better-looking one.
Define contractual churn, meaning a cancel or non-renewal, and behavioral churn, meaning no invoice after a documented window, before you pick anything. Then choose the simplest model you can reconcile. Escalate only when the simple one fails in a way you can measure. A false sense of precision spends acquisition cash against margin your ledger has not earned.
Worked Formulas for Simple Cohort and Predictive LTV
Run all three methods on one customer so the arithmetic, not the narrative, carries the argument. Inputs: $250 monthly ARPA and 75% gross margin after support and onboarding, which leaves $187.50 of monthly contribution. Monthly logo churn is 2.5%.
Simple margin LTV. Divide contribution by churn: $187.50 ÷ 0.025 = $7,500, the same as 40 expected months of billing. Two assumptions ride along uninvited. Churn never changes, and a dollar collected in month 38 is worth what a dollar is worth today.
Cohort LTV. Start with what your customers paid. Observed contribution over 18 months is $2,150 per starting logo. Add a tail drawn only from cohorts at least 24 months old, here $1,900. Cohort LTV: $4,050. Never fill the missing months with company-wide churn, because the customers who survived are the ones in your data, and the ones who left are the reason the average lies. The mechanics of slicing by start month are worth reading in full on cohort analysis in SaaS.
Discounted LTV. Month one is $187.50 × 0.975 ÷ 1.01 = $180.98, using a 1% monthly discount rate (12% a year) and a 40-month horizon. Sum the 40 terms and you get roughly $3,950.
| Method | Formula |
|---|---|
| Simple margin LTV | Monthly contribution divided by monthly logo churn |
| Cohort LTV | Observed contribution per starting logo plus a tail drawn only from cohorts at least 24 months old |
| Discounted LTV | Sum over months of (monthly contribution times surviving share), each divided by (1 + monthly discount rate) raised to that month |
Read the gaps out loud
Simple LTV sits 85% above the cohort figure, at $7,500 against $4,050, because it treats an immature book as though every logo renews forever. Discounted value sits below the cohort figure because it charges you for time and for churn from the first month rather than pretending the tail is free.
The deck includes the following. Cohort LTV is the base case, because it is the only one built from cash you collected. Discounted LTV is the secondary figure you show when cash timing and payback matter to the reader, which is every lender. Simple LTV appears only as a labeled sensitivity, captioned with the assumption that churn is flat forever.
Expansion needs its own discipline. If net revenue retention runs at 110%, add expansion only inside cohorts where you observed it. Pasting it onto every future month of a brand-new logo invents revenue you haven't billed, and a controller who signs that number owns the miss.
How to Build Lifetime Value for SaaS and Services
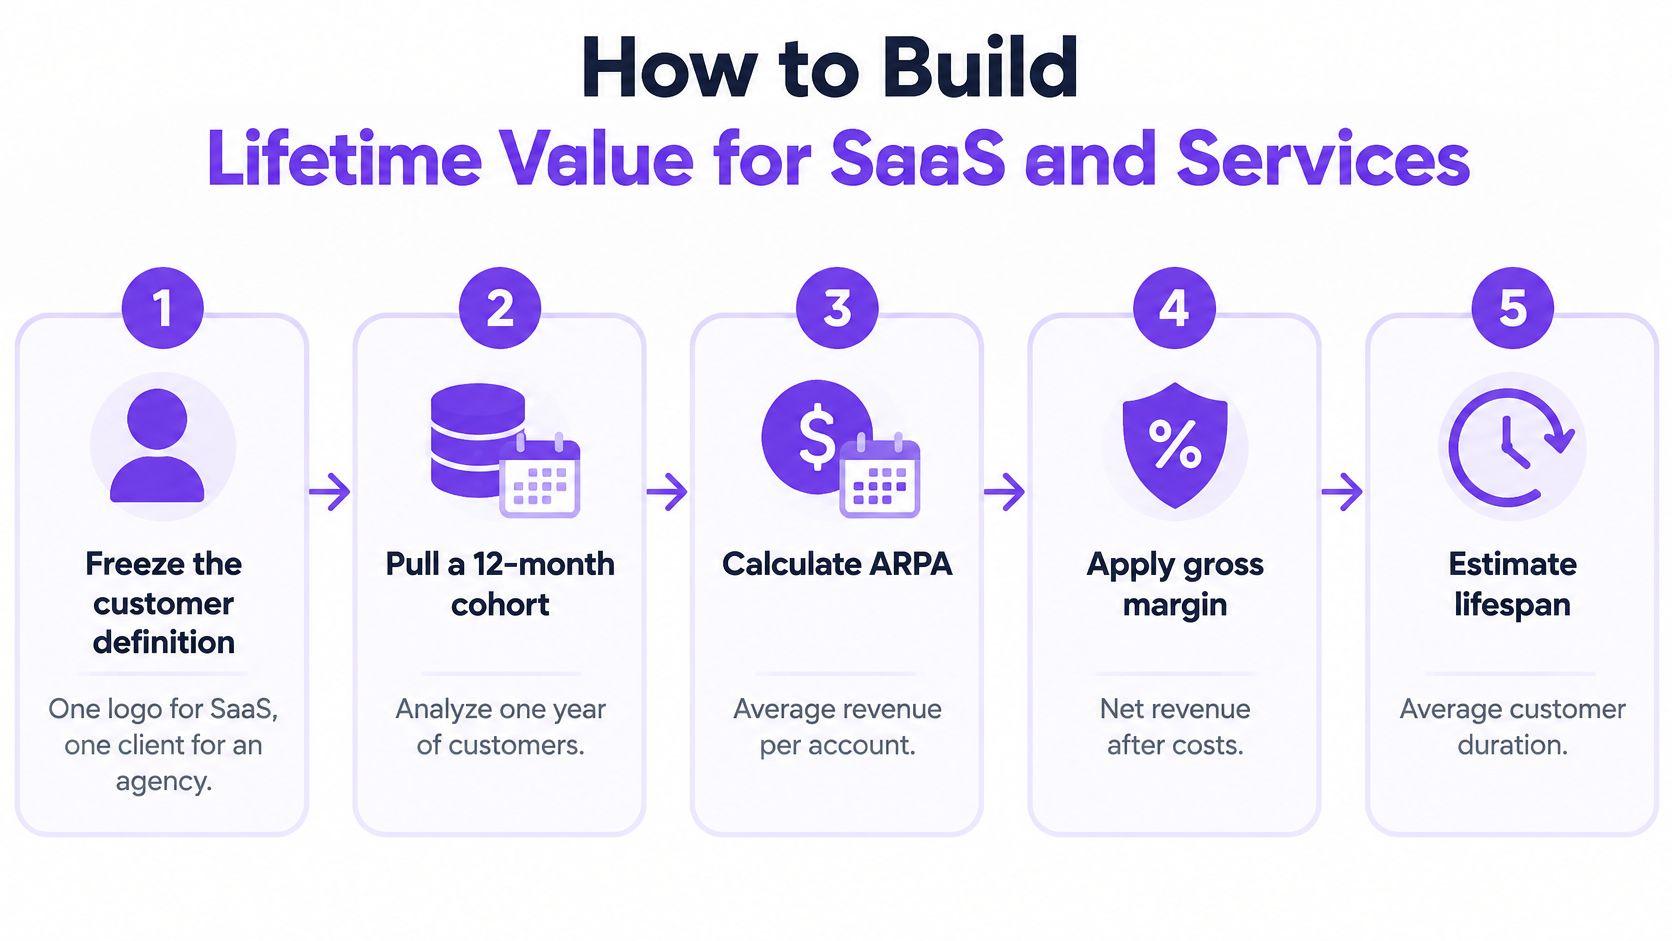
Freeze the method before you touch data. Nine steps, run in this order, produce a file you can defend in a board meeting and hand to an auditor without apology.
- Fix the customer definition. One logo for SaaS, one client for an agency. Never let a parent account and its locations sit in the same file at different grains, because you'll double count revenue and halve your churn.
- Pull a cohort file with start month, plan or service line, contract term, monthly revenue, credits, and cancel or last-invoice date. If your billing system can't produce start month, that's the project.
- Attach cost at the same grain as revenue. Hosting or delivery cost per customer per month, plus month-one onboarding, one line each. Margin computed from a higher grain than revenue is a guess wearing a decimal point.
- Compute contribution margin by month, not revenue. Revenue is what you bill. Contribution is what funds payroll.
- Separate contractual from behavioral churn. A cancel or non-renewal is contractual. No invoice after a documented window, 90 days for a project firm, is behavioral. Write both definitions down.
- Flag every cohort younger than 24 months as immature and keep it out of any tail you publish to investors.
- Run the three formulas by segment, at minimum annual versus monthly, plus your top two plans or service lines.
- Reconcile last year's modeled margin to recognized revenue and gross margin in the ledger. Explain any gap above 5% before the number leaves finance.
- Store the assumptions with the file: horizon, discount rate, inactivity window, and the name of the person who owns it.
Where SaaS and services diverge
For SaaS, add net revenue retention only where expansion shows up in the billing system, and attach hosting and support cost to each plan so a cheap tier doesn't inherit the margin of your best one. For an agency, replace logo churn with retainer renewal plus a written rule for one-off projects, and cap lifetime at the longest relationship you've observed unless a signed term says otherwise.
Twelve months of invoices supports a rule-based draft. Twenty-four months is the bar for a cohort tail you show to investors.
Sample LTV for a SaaS Company and an Agency
Two businesses in the same revenue band, modeled the same week, land on very different numbers.
The SaaS company at $1.8M ARR
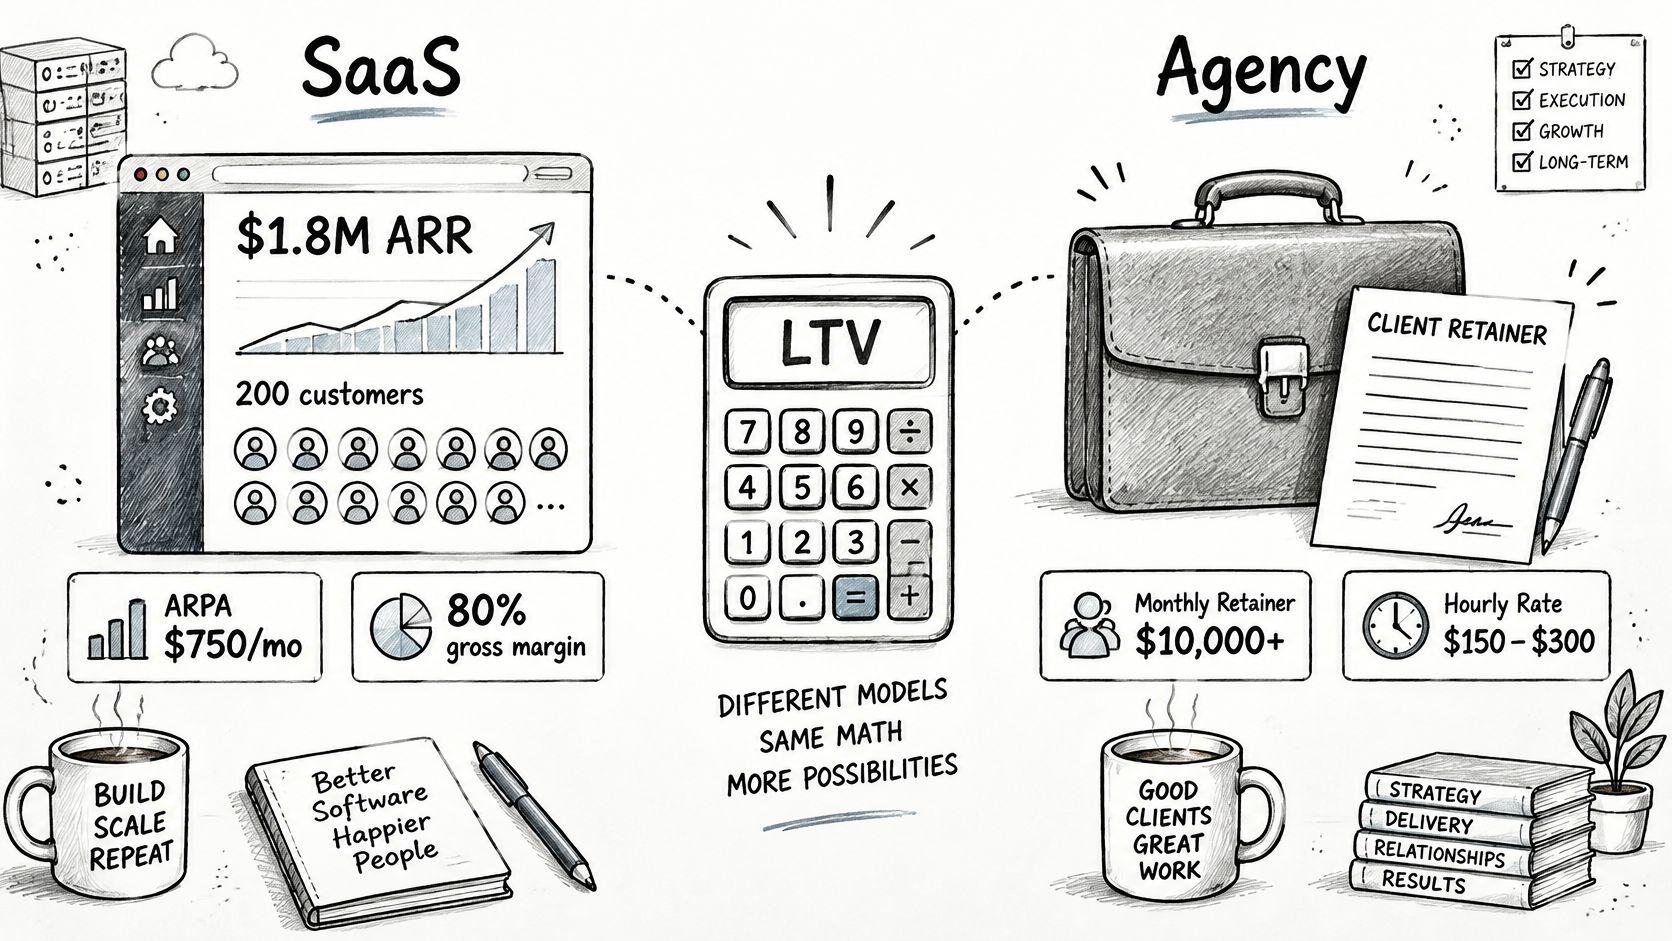
$1.8 million of ARR across 200 customers is a blended ARPA of $750 a month and a gross margin of 80% after hosting and support, or $600 of monthly contribution. Monthly logo churn runs 1.8% on annual plans and 4.5% on monthly plans. Keeping ARPA at $750 for both so only churn moves, swap in each plan's own ARPA before this goes anywhere near a slide.
Annual plans: $750 × 0.80 ÷ 0.018 = $33,333, which is 3.7 to 1 against a blended $9,000 CAC. Monthly plans: $750 × 0.80 ÷ 0.045 = $13,333, or 1.5 to 1. Now apply the cohort file with a 24-month tail. The annual figure drops to $24,000, or 2.7 to 1, below the bar. The monthly figure drops to $8,500, under 1 to 1, meaning you spend a dollar to get back less than a dollar in margin.
Put the post-haircut miss in the deck with its fix attached. Leading with 3.7 and getting corrected in diligence costs you more than presenting 2.7 with a pricing plan.
The agency at $3.2M with 40 clients
An $8,000 monthly retainer at 45% delivery margin produces $3,600 of contribution a month, or $43,200 a year. At 70% annual renewal, expected life is 1 ÷ 0.30, about 3.3 years, so lifetime contribution is roughly $144,000. Cap it at the longest relationship observed, here 3 years, and you get $129,600. Use the capped number. The formula's extra three months are a hope, not a contract.
Project clients behave differently. A $40,000 project at 35% margin is a $14,000 lifetime on its own, plus $3,500 if the 25% second-project rate holds. Model repeat projects as a separate segment or you'll price the first engagement as if the second one is guaranteed. The profitability logic behind that split is covered in calculating true client ROI for an agency.
Every row in the sheet needs customer ID, start month, segment, revenue, delivery or hosting cost, contribution, status, months observed, and a mature-cohort flag. Color the immature cohorts so nobody quotes them by accident.
Here's a walkthrough to watch alongside your own file.
Brief the board on two segment LTVs, annual and monthly, or retainer and project. Never on the company average.
Red Flags That Break Lifetime Value Modeling
The most common misconception in this work is that a more complex model is a more honest one. It isn't. The honest model is the one that reconciles to your ledger, and a gradient-boosted forecast nobody can tie to booked revenue is a liability with better branding.
Here are the warning signs to block before a number reaches an investor, a lender, or a pricing decision.
| Red flag | What it hides | Fix before you publish |
|---|---|---|
| One LTV for the whole book | An unprofitable plan or client type | Report at least annual versus monthly, or retainer versus project |
| Churn from the latest quarter only | Survivor bias in young cohorts | Measure churn across full cohort history, weighted by starting logos |
| Revenue instead of contribution margin | Delivery, hosting, and support cost | Multiply by gross margin after those costs |
| Onboarding left out | A loss in month one | Deduct implementation cost from year-one margin |
| Blended CAC | A channel that never pays back | Pair each segment LTV with that segment's CAC |
| NRR pasted onto new logos | Expansion you have not observed | Apply expansion only inside cohorts that already expanded |
The churn window is the biggest liar in the table. Pull churn from the last three months and every customer who already left is gone from the denominator, so the survivors look loyal and your lifetime stretches. Measure across full cohort history, weighted by starting logos.
Two more, less obvious. First, one CAC mixing paid, outbound, and word of mouth makes every channel look equally efficient, which is never true and always expensive. Second, for SaaS, counting an annual prepayment as twelve months of extra customer value double counts cash already sitting in your bank account.
Fix the file before you buy a data science project: segment, margin, mature cohorts, and a written churn rule. Most companies that think they need machine learning need a clean join between billing and hosting cost.
The objection you'll hear: someone at the table wants one clean ratio. Answer with a range by segment and the share of ARR sitting in immature cohorts. That survives diligence. A single aggressive number doesn't survive one question about cohort age.
The discipline that keeps all of this honest is a churn definition you apply the same way every month. Start with how to calculate churn rate.
Report LTV with CAC Before You Fundraise
A lifetime value figure without its acquisition cost is a marketing claim. Build that cost on the same basis you'd use for calculating customer acquisition cost, fully loaded with sales comp and tooling. Pair every segment LTV with that segment's fully loaded CAC and its months to payback, then state plainly when the OpenView planning bar is missed and what changes to hit it.
Drive the forecast through cohort curves rather than multiplying this month's churn by ARR. If the retention chart and the lifetime value chart come from different surfaces, an investor will find the seam, and the rest of your package loses credibility with it.
Your investor package needs five things: base, low, and high LTV by segment; the share of ARR sitting in cohorts under 12 months; gross margin after delivery and support; the reconciliation to recognized revenue; and the assumptions page. Lead with the base case, not a point estimate from a model nobody in the room can explain.
Three actions, in order. Build the cohort sheet for the last 24 months this week, even if it's ugly. Publish segment LTV, CAC, and payback in the monthly finance pack, so the numbers get argued about internally before they get argued about externally. If the file, the margin definitions, or the board package are the bottleneck, book a complimentary ROI assessment with Jumpstart Partners, where a CPA-led team walks your ARR band, billing model, current finance setup, and the place the close feels messiest, then hands back a path for what to fix first, what stays with your team, and what can wait.
Your board deck doesn't need a bigger number. It needs a segment view with its assumptions attached, reconciled to your ledger, and a controller who can defend it under questioning. Jumpstart Partners runs controller-led finance operations for SaaS companies and agencies between $500K and $20M, including the cohort files, margin definitions, and board packages that turn a blended guess into a range you can stand behind. Visit Jumpstart Partners to see how a five-day close and investor-ready reporting package fit the way you already bill.