Financial Operations
Churn Rate Calculation: Formulas and Worked Examples
Master churn rate calculation for logo, gross and net revenue churn, and cohorts. Worked examples, benchmarks, and the pitfalls that distort your numbers.
ByJumpstart Partners, CPA, QuickBooks ProAdvisor
··17 min readYou closed January feeling calm. The board slide says monthly churn is 2%, and that single figure has carried your confidence for three months. Then a large account cancels, a newer group of customers looks thinner than last year's, and the same file produces a different rate after someone edits the customer list. At $500K to $20M in revenue, that percentage feeds the forecast you hire against, the diligence file an investor will reopen, and the cash plan that decides whether you extend runway or cut spend.
Table of Contents
- Why Churn Rate Calculation Decides Your Runway
- Calculating Logo Churn from a Fixed Starting Base
- Calculating Gross and Net Revenue Churn
- Annualizing Churn and Building Cohort Curves
- Red Flags That Distort Your Churn Numbers
- Comparing Churn Tracking Tools and Support Options
- Next Steps to Reduce Churn and Clean Your Reporting
Why Churn Rate Calculation Decides Your Runway
A founder treats 2% monthly churn as proof the product is healthy. It isn't, not by itself. A blended rate averages every logo into one bucket. Long-tenured accounts can offset a weak group you signed last quarter. The customer percentage can look steady while the dollars leaving the base get larger, because a few expensive accounts outweigh many cheap ones.
That gap hits cash. Logo loss and revenue loss do not move runway the same way. If high-value accounts leave, collections next quarter come in short of the plan you showed the board. Fundraising diligence will split the number. An investor will ask whether retention improved, or whether the snapshot, the exclusions, or the timing changed. A rate that moves because the method moved is not a retention win.
Churn rate calculation is the control that keeps those stories apart. You freeze who counted as a customer, or which recurring dollars counted, before the month starts. You refuse to mix a growth result into a loss result. You keep the same rules in February that you used in January, so a trend is a trend and not a definition change.
What a careful number is for
Use the rate for three decisions, and ignore it for everything else.
- Forecasting: Build next quarter's recurring revenue from the customers you already have, then layer new sales on top. Do not let a flattering blend replace that build.
- Diligence: Show the opening base, the losses, and the closing base as separate lines. A buyer will recreate the math.
- Cash planning: Tie retention to the same monthly close you use for burn rate and runway. A soft churn figure makes a 14-month runway look safer than the bank balance supports.
The working method is sequential. Count logos from a fixed start. Count dollars so durability and expansion stay in different metrics. Read cohorts over a year, not one blended month. Write the policy that makes the file defensible, then pick a system that will still reconcile next month.
Calculating Logo Churn from a Fixed Starting Base
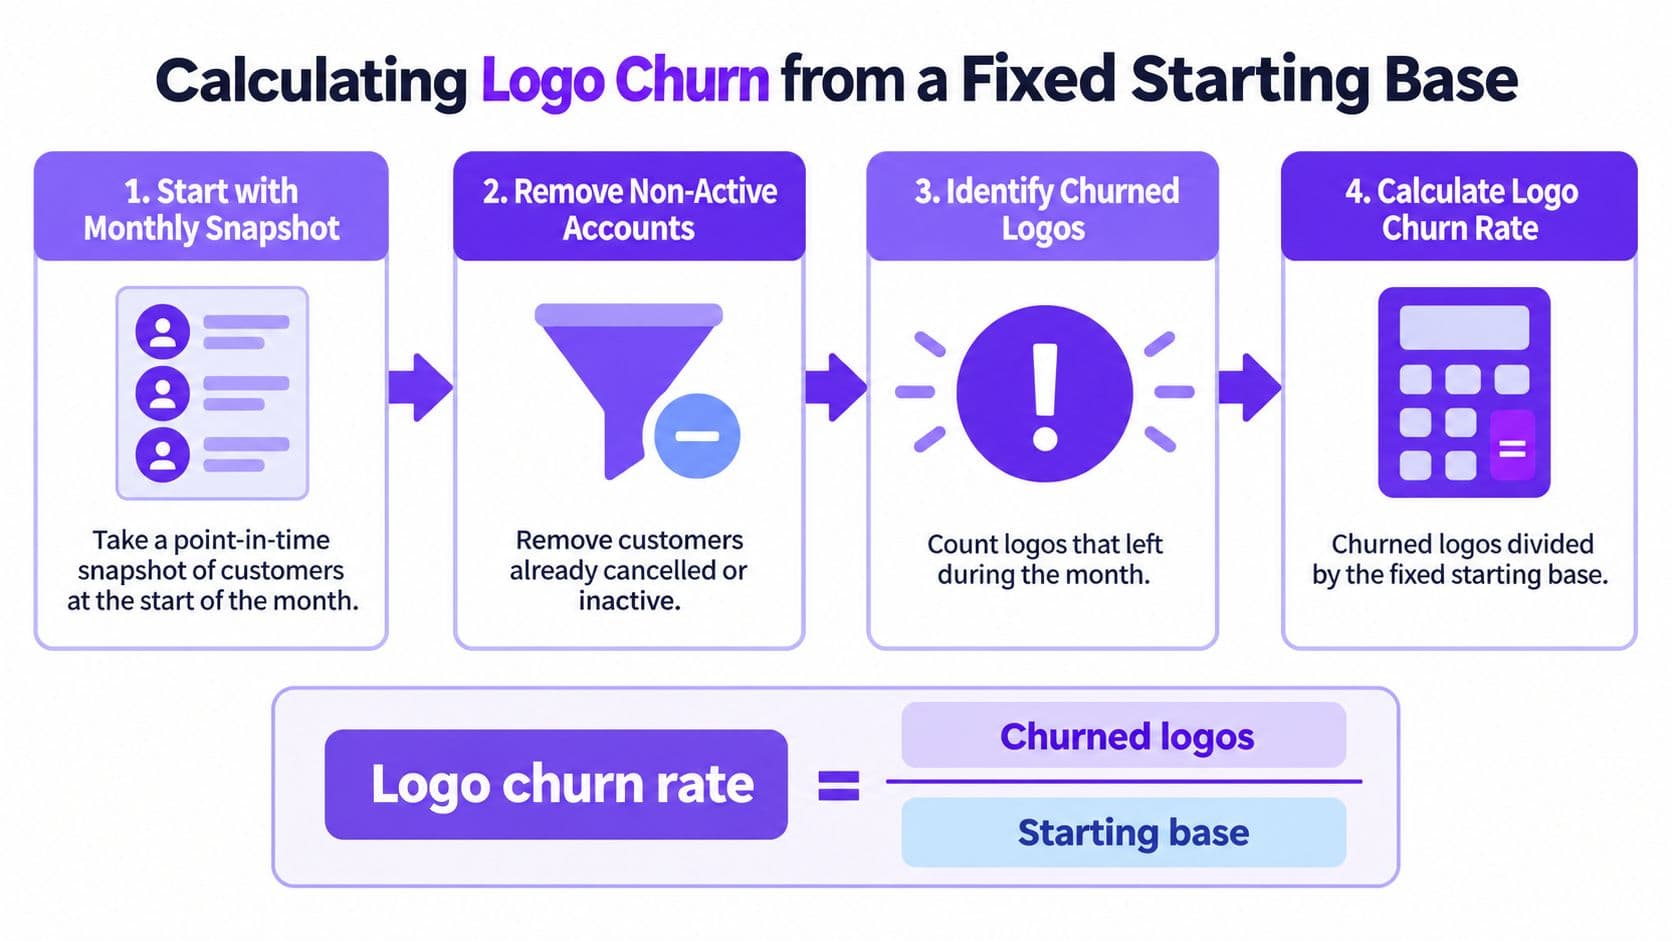
Logo churn is a count, not a financial statement. Customer or logo churn is customers lost divided by customers at the start of the period, multiplied by 100. Trust the opening snapshot. Ignore any average of the start count and the end count. An average lets customers who arrived mid-month dilute the losses, and it flatters the rate.
Run it in this order at month-end.
- Freeze the snapshot. Export every customer with an active paid subscription at the start of the month. That list is the denominator. Do not refresh it after the month ends.
- Drop people who were already gone. Remove customers already cancelled or inactive before the snapshot. They are not yours to lose this month.
- Mark terminations only. Count subscriptions that ended during the month. A downgrade that keeps the logo is not a logo loss.
- Divide. Losses divided by the frozen opening count, then times 100.
The January count
Start January with 200 customers. Eight cancel. Logo churn is 8 ÷ 200 × 100 = 4%. You can check that on a calculator in one pass. Planhat's retention guidance uses this same opening-base rule, and it is the only logo formula worth putting in a board pack.
Say sales closes 25 new customers in January and you end at 217. If someone divides 8 by 217, they report about 3.7% and calls it improvement. That is a growth measure wearing a churn label. New logos never enter the denominator. They also never offset the eight you lost.
Practical rule: If the denominator is not a saved export from the morning of day one, do not publish the rate.
Status rules you write once
Trial users are not customers until the first paid invoice. A paused account is still a customer unless your policy says a pause is a termination. A failed payment is involuntary churn only after your retry window closes and you cancel the subscription. Pick those rules, write them on the snapshot tab, and use them every month. Trends are comparable only when the definitions do not move.
Outside pure SaaS, the same opening-count logic shows up in membership businesses. Fitness GM's guide to calculating churn is a useful cross-check when your agency or services firm bills on retainers rather than seats.
Calculating Gross and Net Revenue Churn
Logo math cannot see contract size. Ten small cancellations and one large cancellation can post the same customer count and wreck the month in completely different ways. For a $500K to $20M SaaS or services business, report dollars beside logos. Trust the dollar line when you are judging whether the base you already sold will fund payroll.
Gross revenue churn is (churned MRR + contraction MRR) ÷ opening MRR. Do not subtract upgrades. Upgrades are not retained revenue you almost lost. They are new dollars from people who stayed, and they belong in net retention.
Gross revenue retention (GRR) isolates what you kept from the opening book. The formula is (starting recurring revenue − churned revenue − contraction revenue) ÷ starting recurring revenue × 100. Expansion is excluded, so GRR cannot exceed 100%.
A $100,000 month
January opening MRR is $100,000. Cancellations remove $7,000. Downgrades remove $3,000.
GRR = ($100,000 − $7,000 − $3,000) ÷ $100,000 = 90%.
Gross revenue churn on the same facts is ($7,000 + $3,000) ÷ $100,000 = 10%. That 10% is the hole. The 90% is what remains. They are one bridge read from opposite ends, which is why GRR versus NRR should sit on the same schedule instead of in rival slides.
Existing customers also upgrade by $12,000. Net revenue retention (NRR) = ($100,000 − $7,000 − $3,000 + $12,000) ÷ $100,000 = 102%. GRR stays at 90%. ScaleXP's retention definitions draw this line cleanly. Expansion did not repair the accounts that left or shrank. It covered them.
Expansion can push NRR over 100%. It cannot fix a weak GRR.
Use GRR when you want customer durability. Use NRR when you want to know whether the installed base grows without a single new logo. Ignore a "negative churn" headline that appears only because upgrades exceeded losses. You are still losing customers.
| Metric | Formula | Includes Expansion | Question It Answers |
|---|---|---|---|
| Logo churn | Customers lost ÷ opening customers | No | Did logos leave? |
| Gross revenue churn | (Churned MRR + contraction MRR) ÷ opening MRR | No | How much of the opening book disappeared? |
| GRR | (Opening MRR − churn − contraction) ÷ opening MRR | No | How durable is the base you started with? |
| NRR | (Opening MRR − churn − contraction + expansion) ÷ opening MRR | Yes | Does the installed base grow without new logos? |
Separate price increases, credits, and foreign-exchange movement from true contraction. If a currency swing sits inside "downgrade," you will manage a finance issue as if it were a product failure.
Annualizing Churn and Building Cohort Curves
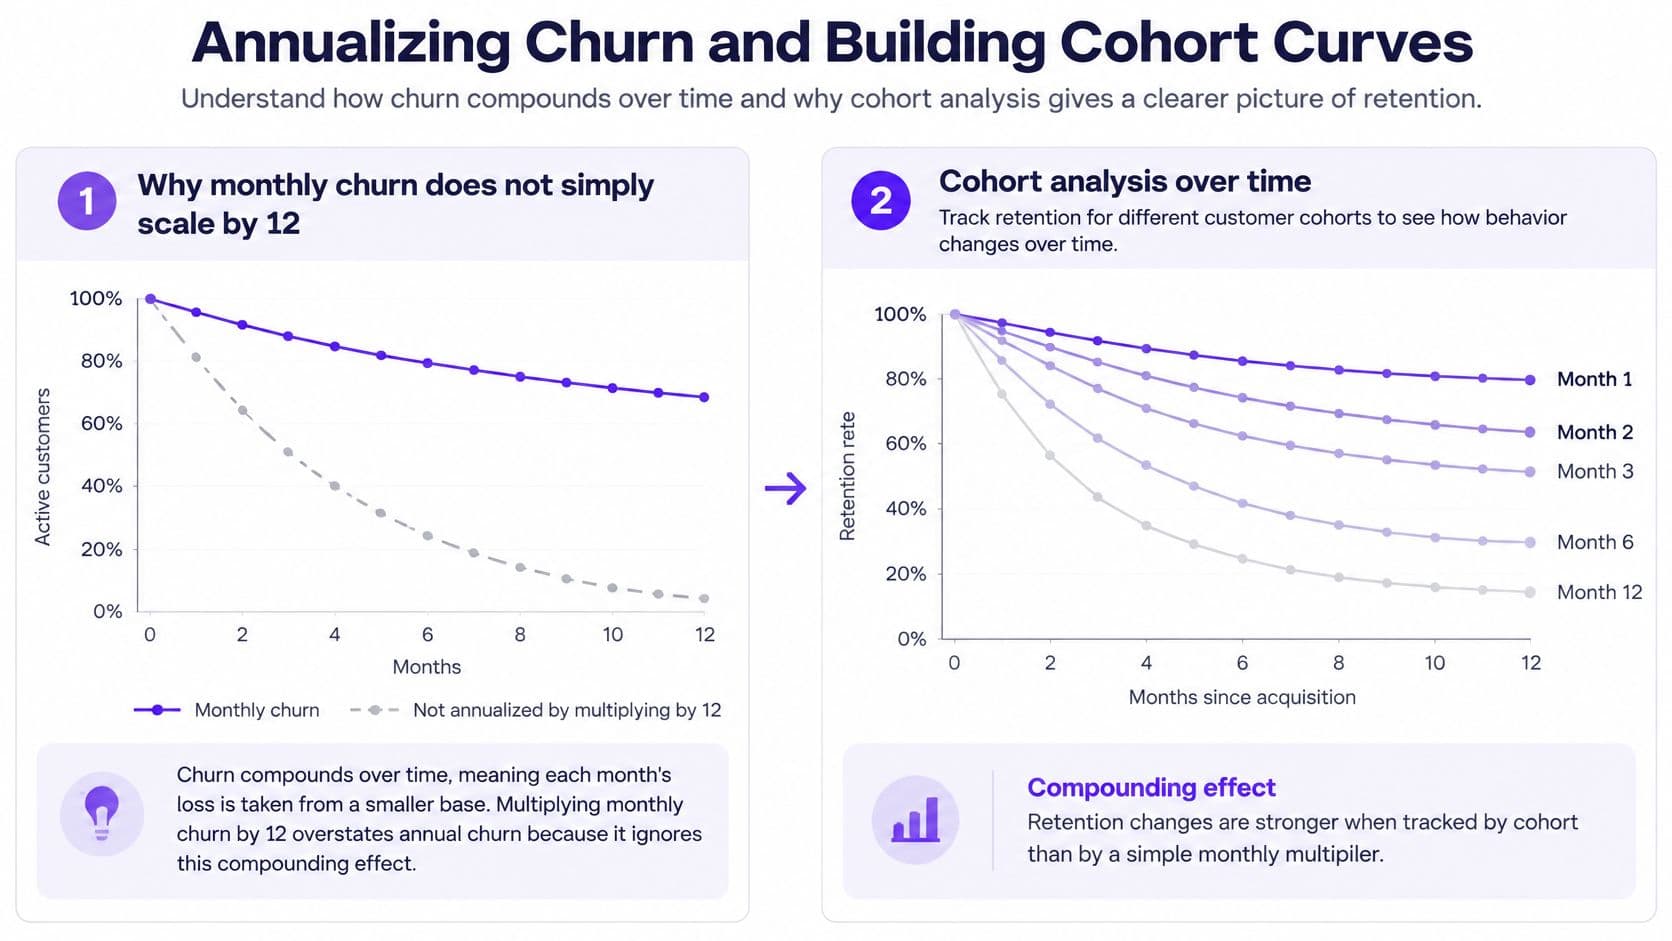
A monthly rate is not an annual rate with the decimal moved. Multiplying by 12 treats every lost customer as if the base never shrinks. It doesn't. Each month the survivors are a smaller group, and the same hazard applies again.
Take 3% monthly churn and hold it constant. Monthly retention is 0.97. Annual retention is 0.97^12 ≈ 69.4%. Annual churn is about 30.6%, not 36%. On a cohort of 100 customers, and with no new logos added to that cohort, about 69 remain after 12 months. Gaintrace's retention math is the version to put next to the monthly percentage so nobody treats 3% as a mild year.
Annualize only when you state a constant-hazard assumption. The formula is 1 − (1 − monthly churn)^12. If the rate is falling or rising, do not annualize. Show the months.
Read curves, not one company target
Group accounts by the month of first paid subscription. Measure the share of that original group still active at 30, 60, 90, 180, and 365 days. Compare curves. A flat blended month can hide a newer cohort that falls off a cliff at day 90 while a legacy cohort barely moves. That is Simpson's paradox in a retention file. The average looks fine because the old book is large.
Callix's churn calculation guide also shows why one company-wide target misleads. A cited benchmark puts median annual gross logo churn at 14%, with 5% for the top quartile and 26% for the bottom quartile. Segment by customer size and business model before you call 14% a pass or a fail. A services firm on annual retainers and a self-serve SaaS product should not share a target.
Traps that fake a trend
- Survivorship bias: Studying only customers still active tells you nothing about the ones who left.
- Denominator leakage: Ending headcount includes people you sold this period. That is not an opening base.
- Mixed denominators: A logo numerator over a revenue denominator is not a rate. It is a unit error.
- Small-number noise: A handful of cancellations can swing a thin month. Use a confidence range or a rolling average before you rewrite the roadmap.
Put the roll-forward beside the curve. Beginning logos, logos lost, ending logos, beginning MRR, churned MRR, contraction, expansion, ending MRR. The same schedule is what makes cohort analysis usable in a forecast instead of a one-off chart.
Red Flags That Distort Your Churn Numbers
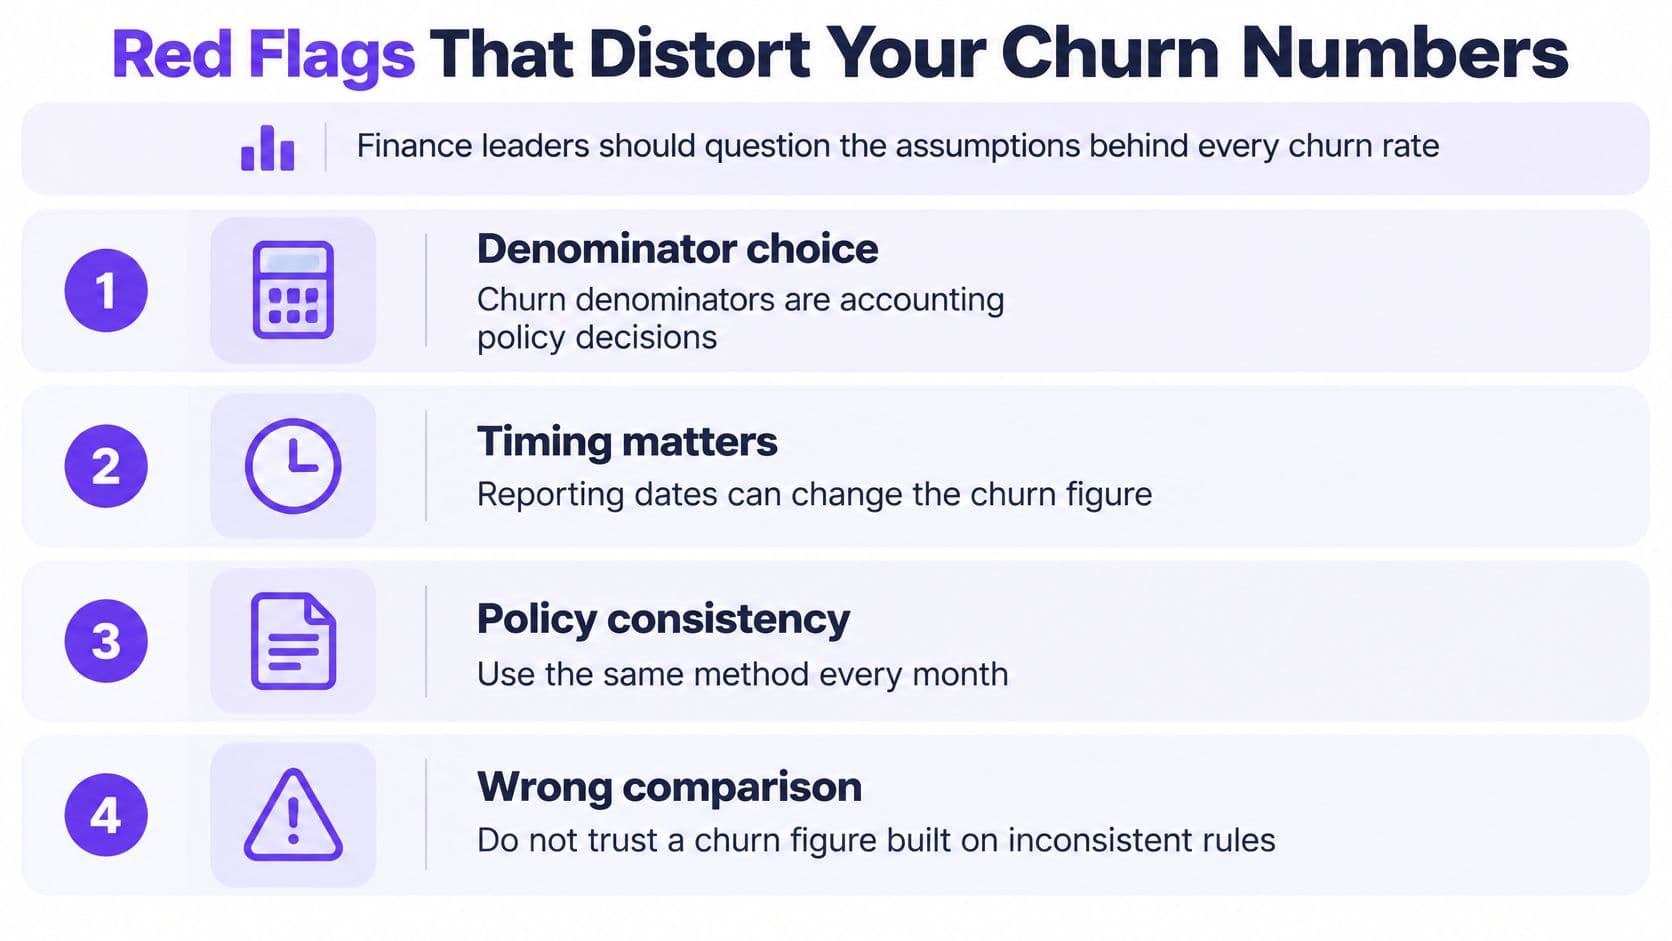
A churn figure is not trustworthy because it came out of a billing export. Denominator and timing are accounting-policy choices. Change the policy and you change the rate, even when not a single extra customer leaves.
Write the boundary cases down and freeze them.
- Pauses: State whether a temporary pause is churn in the month it starts, or only if it is still paused at a set day count.
- Failed payments: Separate involuntary churn from voluntary cancellation. A retry that later succeeds is not a lost logo if the policy says so.
- Trials: Unpaid trials stay out of both the opening base and the losses.
- Annual contracts: Do not mark churn in a quiet month when the subscription is still inside its term. Churn hits at the anniversary if they do not renew.
- Reactivations: A return is not negative churn. Book it on its own line so it cannot shrink the loss count.
- Downgrades: A smaller plan is contraction. The logo remains. Putting it in logo churn overstates customer loss and understates a pricing problem.
The Calcu's churn-rate notes make the reporting point that matters for investors. New sales stay out of the calculation, and revenue churn is measured against opening MRR. A company can still print "negative churn" while logos leave, if expansion is netted against cancellations. That headline is a presentation choice. It is not evidence the base got stickier.
The bridge that catches a bad file
Reconcile every month. Opening MRR minus cancellations and contractions, plus expansion, upgrades, and new business, equals closing MRR. If it does not, stop the commentary and fix the extract.
Gatilab's churn-rate method flags the usual breaks. Duplicated customer IDs double-count a logo in the base or in the losses. Backdated cancellations rewrite last month after you already reported it. Inconsistent MRR snapshots, one from the billing system and one from a spreadsheet saved mid-close, make the rate look better or worse for no operating reason.
Do not send a churn slide until the bridge ties to the penny you will defend in the general ledger.
Treat these as stop-signs, not style notes. Two IDs for one account. A cancellation dated in a closed month. A pause counted as churn in March and as active in April. NRR above 100% sitting next to a long list of lost logos with no gross line beside it. Any one of those means the percentage is a story, not a measurement. The same close discipline you apply to the rest of your SaaS financial metrics applies here. If the subledger does not tie, the KPI does not go to the board.
Comparing Churn Tracking Tools and Support Options
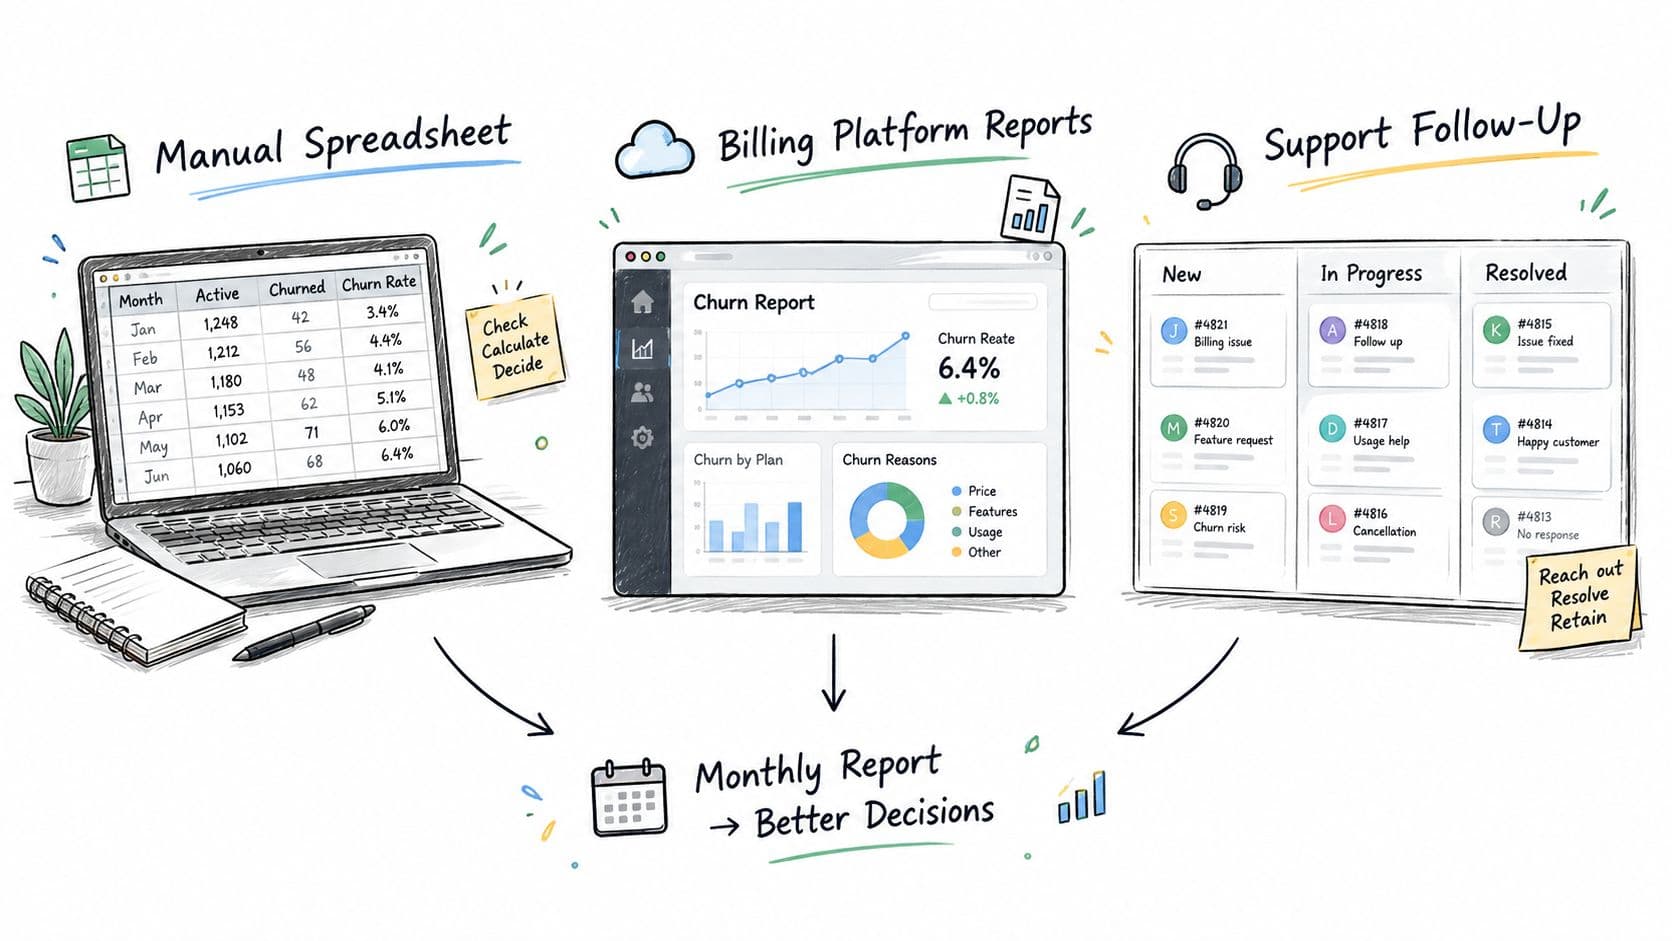
You have three realistic ways to run this every month. A workbook, reports from the billing platform, or an outsourced controller. Judge them on whether the billing extract ties to the general ledger, whether you can cut the base by plan, channel, term, geography, and size, and how many hours a small finance team spends chasing exceptions.
Workbook
A spreadsheet is the right instrument while the customer list is short enough that you can name the exceptions. You control the snapshot, the status flags, and the bridge. The failure mode is version drift. Someone pastes a fresh Stripe export over last month's tab and the opening base moves. Lock the opening tab after close. Color the cells that are inputs. If two people can edit the denominator, you do not have a policy. You have a shared file.
Billing-platform reports
Stripe and similar billing tools are the system of record for invoices, refunds, and subscription status. Their churn charts are a starting extract, not a board metric. They often blend logos, treat a failed card as an instant loss, or omit the contraction line your GL needs. Pull the raw subscription events. Rebuild logo churn, gross revenue churn, GRR, and NRR in your close file. Then match opening and closing MRR to deferred revenue and the income statement.
CustomerScore's cohort guidance is the standard for what the dashboard should show. A single blended tile hides deteriorating customer quality. You want logo churn, gross revenue churn, GRR, NRR, and cohort curves, cut by plan, channel, term, geography, and size. That cut tells you whether the pain sits in low-value logos, high-value accounts, or a channel you turned on recently. A pretty blended percentage does not.
Outsourced controller support
When the founder is still exporting CSVs at 11 p.m., the constraint is hours and review, not formulas. Jumpstart Partners is one option in that seat. It is a US-based, CPA-certified team that builds MRR and ARR dashboards, connects Stripe with QuickBooks, Xero, and NetSuite, supports ASC 606 revenue workflows, and runs a 5-day month-end close for companies in the $500K to $20M range. You still own the policy. They keep the bridge, the cohort file, and the ledger on the same definitions month after month.
Use the video below as a quick orientation to the metric set, then go back to your own opening snapshot and see which of the three setups can reproduce it without a manual patch.
Pick the workbook if you can reconcile it yourself in a day. Pick billing reports as the source extract, never as the finished KPI. Pick controller support when the bridge, the cohorts, and the audit trail need to survive a fundraise without you in the spreadsheet.
Next Steps to Reduce Churn and Clean Your Reporting
Start with a one-page churn policy, not a new tool. The policy names the opening population, the clock time of the snapshot, and the treatment of pauses, failed payments, trials, and annual renewals. It states how you classify voluntary and involuntary churn. It states that reactivations and new sales have their own lines and never reduce the numerator. Date the policy. If you change it, restate prior months or label a break in the series. Silent edits are how a "better" quarter gets manufactured.
Build the monthly roll-forward next, in the shape already set for the reporting pack. Beginning customers, churned logos, ending customers. Beginning MRR, churn MRR, contraction, expansion, ending MRR. Reconcile that schedule to billing events and to the general ledger before anyone graphs it. A chart of an untied number spreads the error faster. It does not make the error smaller.
Where to point the operating work
Once the schedule is trustworthy, aim retention work at the curve that is breaking. A day-90 drop in a new channel is an acquisition-quality problem. Contraction clustered in one plan is a packaging problem. Involuntary churn clustered on one card-retry setting is a collections problem. Do not launch a blanket "reduce churn" project against a blended percentage.
- This week: Save the opening customer export and the opening MRR export to a locked tab. Write the six boundary rules under the tab name.
- This close: Complete the roll-forward and tie it to the ledger. If it does not tie, the commentary waits.
- This quarter: Add cohort curves at 30, 60, 90, 180, and 365 days, split by the segment that signs your largest contracts.
Retention also feeds the value you claim for a customer. A churn series that is wrong will overstate lifetime value and make a weak payback look acceptable. Pair the schedule with a clean customer lifetime value calculation so the forecast and the acquisition budget use the same survival assumption.
For the accounts already wobbling, templates for tracking customer risk give the customer team a simple way to log the logos your bridge just flagged, without turning the finance file into a CRM.
Ignore industry targets until your own curves exist. Ignore NRR when someone uses it to claim the churn problem is solved. Trust GRR, the opening-base logo rate, and a bridge that ties. Those three are enough to brief a board and to decide where retention work belongs.
Jumpstart Partners sets up a defensible churn schedule, reconciles it to your general ledger, and delivers investor-ready reporting for SaaS, agencies, and professional services firms between $500K and $20M. If your logo rate, revenue bridge, and cohort curves do not tie out, put that work on a controller's desk before the next board meeting. Visit Jumpstart Partners to book a consultation, with month-to-month flexibility and a 30-day money-back guarantee.