Financial Operations
Cohort Analysis SaaS Guide to Drive Retention and LTV
Master cohort analysis SaaS finance teams use to diagnose retention, churn, and LTV. Includes worked examples, benchmarks, and a 30-day action plan.
ByJumpstart Partners, CPA, QuickBooks ProAdvisor
··18 min read110% net revenue retention is the 2024 public-SaaS median, and cohort analysis is the only tool that reveals whether your NRR is earned or masked by new bookings. If you can't see retention by starting cohort, your ARR forecast is built on an average that may be hiding deterioration.
A healthy company-wide metric can coexist with weak new-customer economics, shrinking logo counts, and a customer success team spending money to defend revenue that never becomes durable. That's why I treat cohort analysis SaaS reporting as a finance control, not a dashboard decoration. It tells you which customers stay, which accounts expand, when churn occurs, and what action belongs in the next budget.
Table of Contents
- Why Aggregate Retention Numbers Cost SaaS Companies Real Money
- What Cohort Analysis Actually Means for SaaS Finance Teams
- Choosing the Right Cohort Type for Each Decision
- Calculating Retention, Churn, LTV, and Expansion MRR from One Table
- Reading a Retention Curve and a Revenue Heatmap
- Red Flags That Distort Your Cohort Numbers
- Data Sources and Tooling for Audit-Ready Cohort Reports
- Your 30-Day Cohort Analysis Action Plan
Why Aggregate Retention Numbers Cost SaaS Companies Real Money
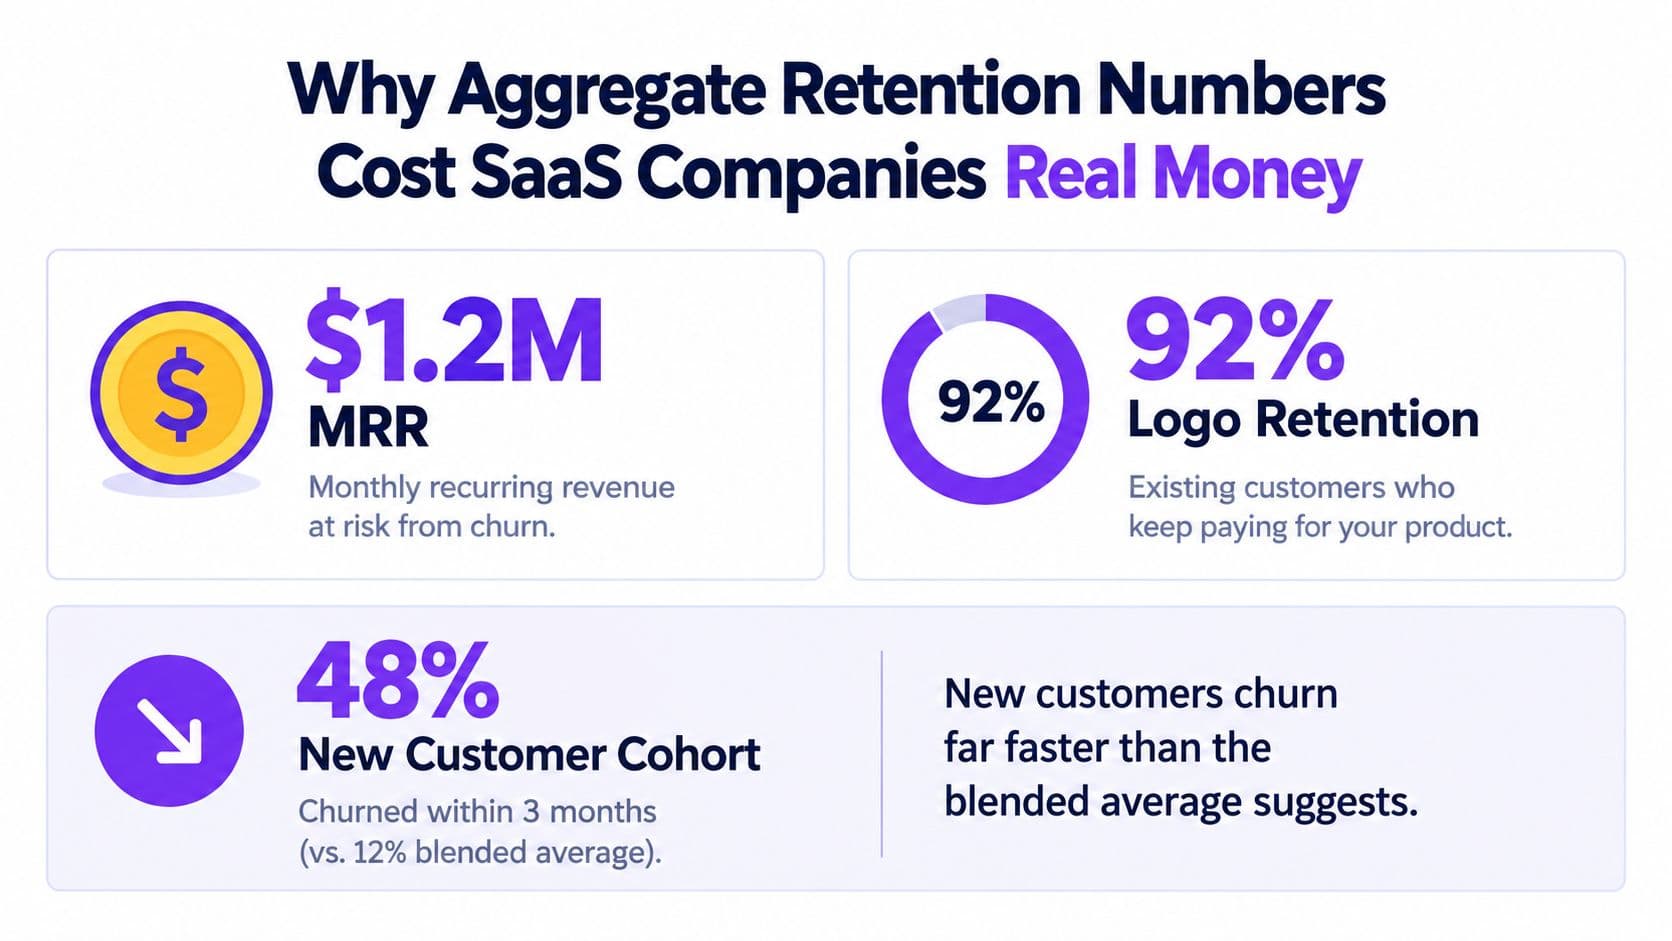
Consider a SaaS company reporting $1.2 million in MRR and 92% logo retention. Leadership sees a stable business. The board sees a credible renewal story. Sales receives another hiring request.
Then finance separates customers by starting month. The oldest cohort retains at 96%, while the most recent cohort retains at 71%. The blended figure looks acceptable because the established customer base is carrying newer customers that are leaving quickly. That isn't a minor reporting issue. It's a warning that acquisition quality, onboarding, pricing, or product value has changed.
The financial cost appears in several places:
- Lost ARR: Every customer who fails to renew removes recurring revenue from the forecast. The exact loss depends on each account's contract value, so calculate it from the affected cohort rather than applying the blended logo rate.
- Missed CAC payback: You may fund acquisition based on a customer lifetime that newer cohorts no longer achieve. Sales can look efficient while the payback period extends.
- A weaker investor forecast: A forecast based on old-cohort behavior overstates the value of current bookings. Investors and lenders will ask whether retention comes from recent customers or from accounts acquired under an older product and pricing model.
The decision your cohort table should force
A cohort table should tell you where to put the next dollar. If recent acquisition cohorts deteriorate before renewal, fund onboarding and customer success before increasing paid acquisition. If logo retention is stable but revenue retention is weak, investigate downgrades, seat reductions, and pricing. If logos contract but revenue expands, examine concentration risk before declaring victory.
ChartMogul's 2023 SaaS Retention Report found that businesses with NRR above 100% grew an average of 43.6% annually, while businesses with NRR below 60% grew 13.1%. The same report found that 2.7% of businesses with average revenue per account below $10 per month achieved NRR above 100%, compared with 41.1% of businesses above $500 per month. These figures show why revenue cohorts deserve the same attention as logo cohorts. ChartMogul's SaaS Retention Report separates growth from new sales and growth from renewals, upgrades, seats, and usage expansion.
You also need to keep gross retention visible beside NRR. A company can report attractive NRR while a broad base of smaller accounts contracts, because a few larger accounts expand enough to offset them. Use gross revenue retention versus net revenue retention when deciding whether a retention issue belongs to product, pricing, sales qualification, or customer success.
What Cohort Analysis Actually Means for SaaS Finance Teams
Cohort analysis groups customers by a shared starting event and tracks the same group through a defined observation window. For a finance team, that means three choices must be explicit: when the customer entered, how long you observe it, and what outcome you measure.
Take customers whose subscriptions began in January 2025. You can measure their logo retention after three, six, or twelve months. You can also track recurring revenue, churn, contraction, expansion, payment status, or completed workflows. The starting event must stay consistent. Mixing contract effective dates with first-payment dates creates a table that looks precise but compares different populations.
Logo cohorts and revenue cohorts answer different questions
A logo cohort counts customers. A revenue cohort follows the recurring revenue attached to those customers. They can move in opposite directions.
Suppose a cohort starts with 100 customers paying $500 per month, or $50,000 in starting MRR. If ten customers leave but the remaining accounts expand, logo retention declines while revenue retention can remain stable or rise. The logo table tells you that customer count is shrinking. The revenue table tells you whether the surviving accounts are becoming more valuable.
That distinction feeds finance decisions. Logo retention informs customer concentration and service capacity. Revenue retention informs ARR forecasting, pricing, expansion planning, and the quality of growth.
Decide what “active” means before you measure it
User, account, and contract cohorts aren't interchangeable. A user cohort asks whether an individual logged in or completed an action. An account cohort asks whether the customer organization received value. A contract cohort asks whether the commercial relationship remains active.
For low-frequency B2B products, login frequency can misclassify healthy customers as inactive. A reporting product used during a weekly review, a finance platform used during monthly close, or a compliance system used quarterly needs an activity definition based on workflow completion and account value. Separate user retention, account retention, workflow completion, and commercial retention instead of treating every missed login as churn.
Your cohort table ultimately feeds three reporting destinations:
- P&L: Churn and contraction inform recurring-revenue forecasts and the commercial explanation for changes in revenue.
- Cash flow statement: Deferred revenue runoff and collections depend on contract status, billing timing, and renewal behavior.
- Board reporting: Cohorts support clear commentary about whether growth comes from new bookings, renewals, or expansion.
For practical context on how subscription businesses think about infrastructure and data handling, review this cloud hosting guidance for law firms. Then connect the cohort outputs to the broader SaaS financial metrics your board already reviews.
Choosing the Right Cohort Type for Each Decision
Don't build every cohort because your analytics tool offers the option. Build the cohort that answers the decision in front of you.
| Cohort Type | Primary Decision | Sample Metric | Typical Segmentation |
|---|---|---|---|
| Acquisition cohort | Should you keep funding this channel or sales motion? | Retention and CAC payback by start month | Paid search, organic, referral, partner, outbound |
| Revenue cohort | Is ARR durable and expandable? | Gross revenue retention, NRR, contraction, expansion | Plan tier, contract size, geography, contract type |
| Behavior cohort | Which actions predict durable value? | Workflow completion, activation, account retention | Feature use, onboarding completion, role, account size |
Use acquisition cohorts for spend decisions
Acquisition cohorts group customers by when and how they entered. Finance should bring this view to budget meetings because it connects marketing and sales spend to the revenue that remains after the initial booking.
Compare paid search, organic, referral, and outbound cohorts by retention and realized revenue. A channel that produces more initial contracts isn't automatically better. The stronger channel is the one that produces customers who renew and expand at an acceptable payback.
Use revenue cohorts for ARR quality
Revenue cohorts belong in forecast reviews and investor materials. They expose whether a plan change, price increase, upsell motion, or seat expansion produces durable recurring revenue.
Track starting MRR, churn, downsell, contraction, expansion, and ending MRR. Separate price increases from genuine product expansion. A price change can lift revenue without proving that customers adopted more value.
Use behavior cohorts for product and onboarding decisions
Behavior cohorts group accounts by what they did, not just when they arrived. Compare customers who completed setup, invited the relevant team, connected a data source, or completed a core workflow with those who didn't.
The meeting question becomes concrete: which early action should product and customer success make easier? Don't confuse correlation with causation, but use the pattern to choose the next test. A behavior cohort is most useful when it ends in a specific intervention, not a presentation of interesting differences.
Hybrid cohorts belong in investor decks when they clarify a material pattern. Slice a revenue cohort by plan tier or geography, but stop when the cohort becomes too small to support a decision. The objective is not taxonomy. It's knowing which customer group deserves more acquisition spend, onboarding attention, product investment, or pricing scrutiny.
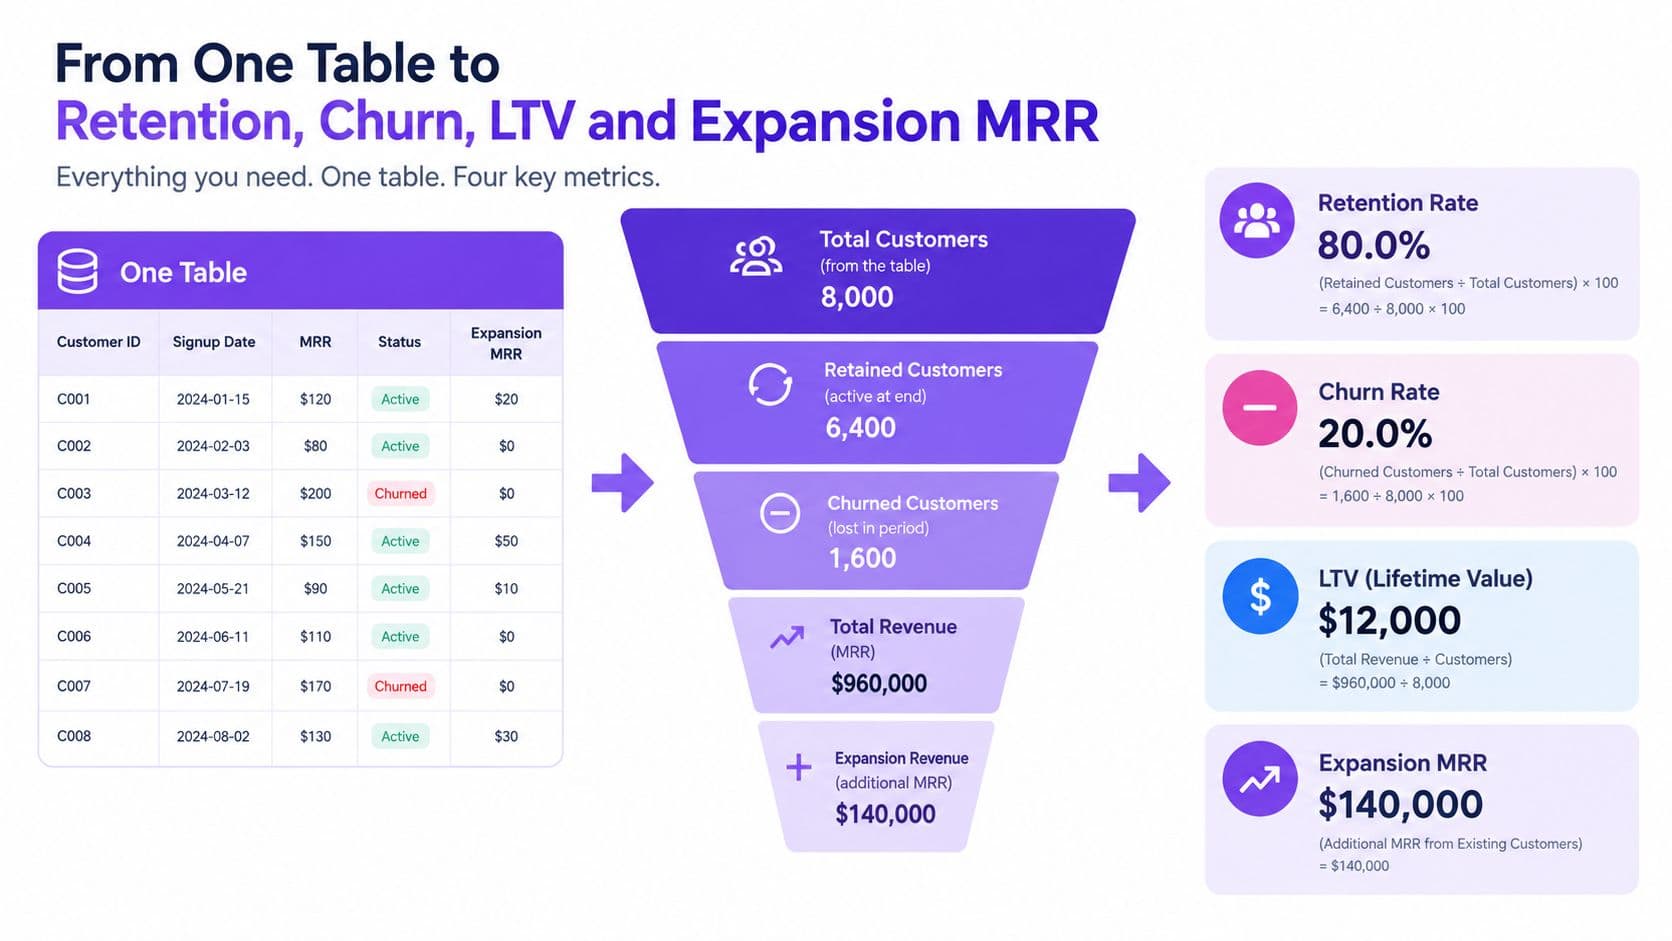
Calculating Retention, Churn, LTV, and Expansion MRR from One Table
Start with one cohort and keep the arithmetic visible. Assume 100 customers paying $500 per month, giving you $50,000 starting MRR.
| Measurement Point | Customers Remaining | MRR After Churn and Expansion |
|---|---|---|
| Start | 100 | $50,000 |
| Month 3 | 90 | $48,000 |
| Month 6 | 78 | $46,000 |
| Month 12 | 70 | $44,000 |
Calculate the core metrics
- Month-3 logo retention: 90 customers divided by 100 starting customers equals 90%.
- Month-6 logo retention: 78 divided by 100 equals 78%.
- Month-12 logo retention: 70 divided by 100 equals 70%.
- Month-12 gross dollar churn: If the cohort had no expansion and ending MRR after churn and downgrades is $35,000, gross dollar churn equals $15,000 divided by $50,000, or 30%. Keep expansion out of this measure.
- Month-12 net revenue retention: Ending cohort MRR of $44,000 divided by starting MRR of $50,000 equals 88%.
- Expansion MRR: If churn and downgrades reduce the cohort from $50,000 to $35,000, but upgrades add $9,000, ending MRR becomes $44,000. Expansion MRR is $9,000, and the bridge is $50,000 minus $15,000 plus $9,000 equals $44,000.
The benchmark test depends on the metric and segment. ChartMogul placed top-quartile NRR for companies with $1 million to $3 million in ARR at 94% in its 2023 report. GrowPanel summarized a 2023 practitioner survey that treated approximately 60% six-month customer retention as good and about 80% as great for SMB and mid-market SaaS. Its 12-month NRR reference points were near 90% for good and 110% for great for land-and-expand SMB and mid-market products, with higher enterprise reference points. Treat these as historical benchmarks, not universal targets. GrowPanel's cohort analysis guide provides the segment context.
Finance rule: Never label an 88% NRR cohort “healthy” without showing the gross retention, logo movement, cohort size, and expansion concentration behind it.
Work out LTV and payback
Use a simple margin-adjusted LTV formula:
LTV = average MRR per customer × gross margin ÷ monthly logo churn
For a repeatable example, assume $500 average MRR, 80% gross margin, and 5% monthly logo churn. The calculation is $500 × 0.80 ÷ 0.05, producing $8,000 LTV.
Then compare LTV with CAC. High Alpha's 2024 SaaS Benchmarks, produced with OpenView and based on data from more than 4,000 companies in aggregate, reported median NRR of about 110% for public SaaS companies, with revenue growth stabilizing around 17% to 18%. OpenView's commonly used gating tests in the requested framework are an LTV:CAC ratio above 3:1 and payback under 12 months. Use those tests as investment gates, not as a substitute for cohort evidence. High Alpha's 2024 SaaS Benchmarks gives the public-company benchmark context.
For a fuller finance walkthrough, use this guide to calculate LTV. For conversion experiments, Polish's approach to conversion testing is useful when a behavioral cohort identifies a specific activation failure.
Reading a Retention Curve and a Revenue Heatmap
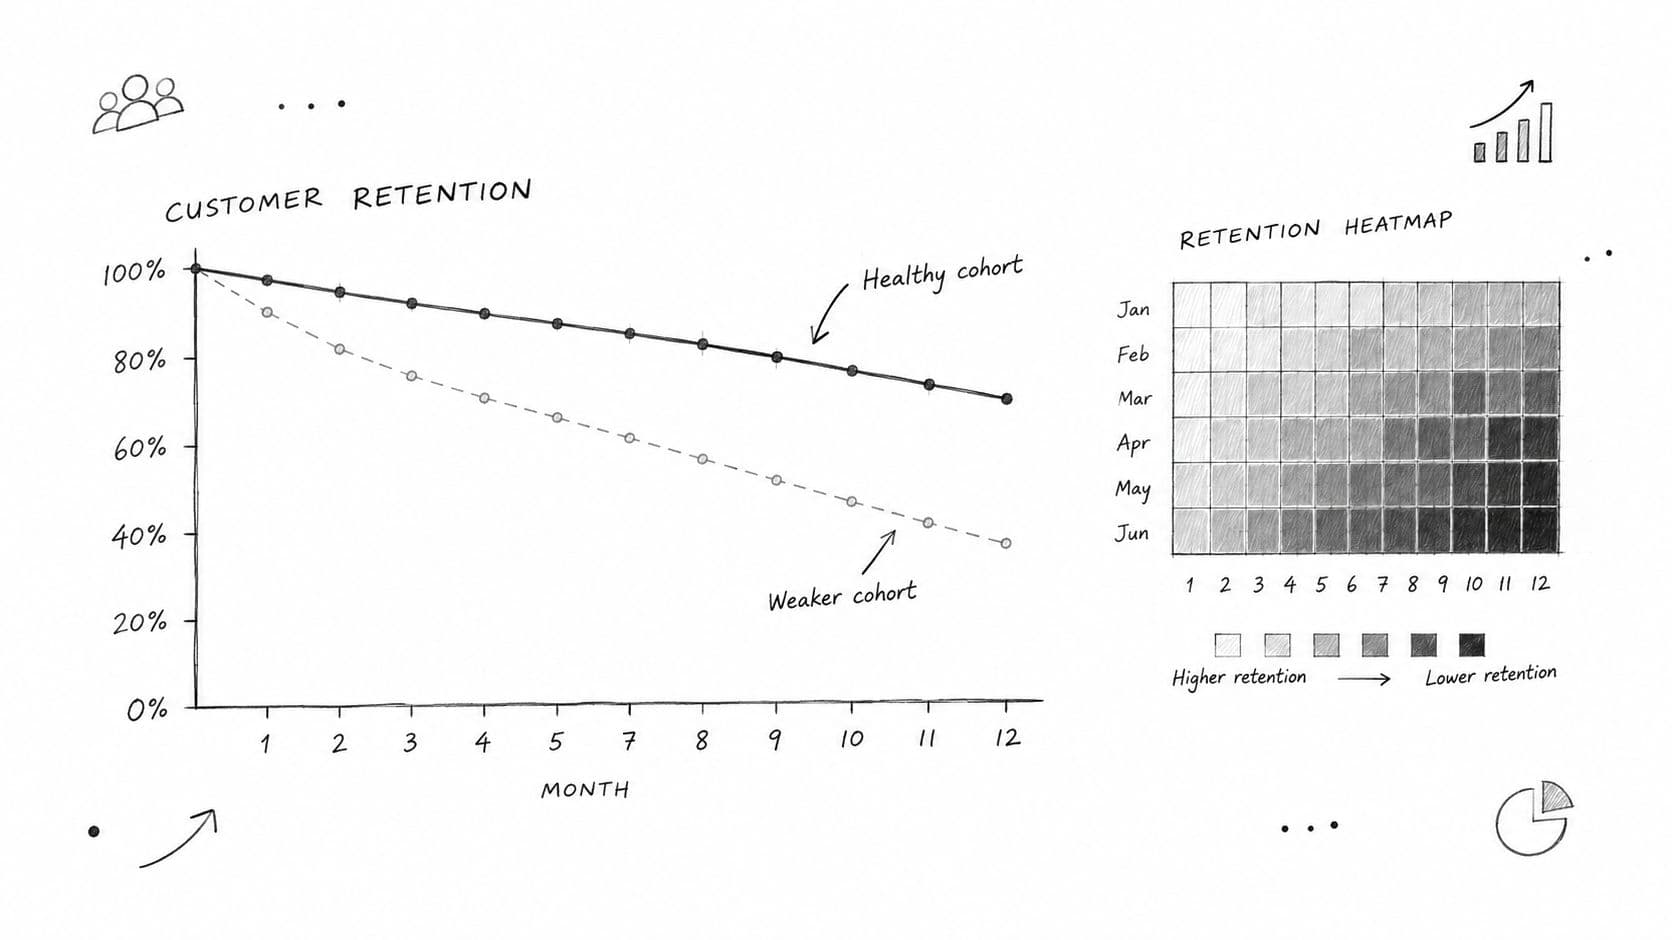
A retention curve should make deterioration obvious without a verbal explanation. Put months since acquisition on the horizontal axis and customer percentage on the vertical axis. Each line represents a starting cohort, and the shape tells you where customers leave and whether the remaining base stabilizes.
Use a triangular pattern as the basic visual. Newer cohorts have fewer observed months, so their lines end earlier. A horizontal reference line at 90% month-3 retention and 70% month-12 retention gives the chart a decision frame. Those reference points are useful internal guardrails for a chart, not universal benchmarks. Your actual target should reflect your segment, contract structure, usage cadence, and historical performance.
Read the curve before reading the color
A flat curve after an early decline means the remaining customers have reached a retention floor. That points to an activation or qualification problem if the early drop is steep. An upward revenue curve, even while the logo curve declines, indicates expansion among surviving accounts and requires a concentration check.
A curve that bends downward and accelerates deserves immediate investigation. Look for a product release, a pricing change, a renewal anniversary, a payment problem, or a customer segment with a different usage pattern. If newer lines sit below older lines at the same month since start, treat the change as a current operating problem rather than a historical curiosity.
Build the heatmap from actual MRR
Put cohort start month on the rows and months since start on the columns. Shade each cell according to retained MRR percentage, and keep the underlying dollar values available for review.
For example, a January cohort begins with $50,000 MRR and falls to $38,000 by month six. The retained MRR percentage in that cell is $38,000 divided by $50,000, or 76%. A darker color should indicate weaker retention, while an expansion cell should use a clearly different scale or annotation so growth isn't confused with stability.
A heatmap is most valuable when finance adds event markers. Label a pricing rollout, implementation change, or product migration on the relevant calendar dates. That lets the controller distinguish a cohort problem from a calendar-time problem affecting several cohorts at once.
Red Flags That Distort Your Cohort Numbers
NRR can look excellent while customer health worsens. Suppose two accounts each expand by $5,000 per month, adding $10,000. At the same time, fifteen SMB customers paying $300 per month leave, removing $4,500. The surviving accounts generate enough expansion to offset that contraction and create a $5,500 net increase in MRR. The revenue cohort can show 110% NRR even though the company lost fifteen logos.
That is why I never review NRR without logo retention, gross revenue retention, contraction, and expansion concentration. A few enterprise accounts can make a broad SMB problem invisible.
Red flag one is revenue masking logo decay
A recent benchmark cited for bootstrapped B2B SaaS companies with $3 million to $20 million ARR reports 91% median gross revenue retention and 103% median net revenue retention. The spread illustrates how modest expansion can coexist with meaningful contraction. ChurnTools' State of Churn provides that benchmark context.
Ask these questions before accepting the headline NRR:
- Who expanded: Did many accounts expand, or did one or two large customers create the result?
- What expanded: Was the increase a real usage or seat expansion, or only a price change?
- Which segment contracted: Are SMB, self-serve, or newer cohorts losing revenue faster than enterprise accounts?
- What is the median outcome: Does the median cohort behave like the company average?
- When does contraction occur: Does it cluster before renewal, after implementation, or after a product change?
For a practical treatment of cohort-driven churn diagnosis, use this SaaS churn analysis guide.
Red flag two is low-frequency usage misclassification
A finance or compliance product can deliver value during a weekly report, monthly close, quarterly filing, or annual planning cycle. Daily login retention will look weak even when accounts complete the intended workflow and renew commercially.
Define activity around the product's natural operating rhythm. Track user access for product adoption, account workflow completion for realized value, and contract status for commercial retention. Don't classify a customer as churned because the designated employee didn't log in yesterday.
Escalate to the controller or CFO when the table mixes activity definitions, cohort start dates, or revenue currencies. Also escalate when a healthy NRR depends on concentrated expansion, when gross retention falls while NRR rises, or when newer cohorts materially underperform older cohorts. Those are review triggers, not excuses to wait for the next quarter.
Data Sources and Tooling for Audit-Ready Cohort Reports
An audit-ready cohort report starts with a reliable data path, not a polished chart. Capture the customer's contract effective date, subscription start date, plan, MRR, churn date, downgrade date, expansion event, billing status, and renewal date. Keep the source field for every value.
Stripe usually provides subscription events, invoices, plan data, and billing changes. QuickBooks, Xero, or NetSuite holds the accounting entries and deferred revenue schedules. HubSpot provides opportunity, source, and sales-motion context. A warehouse such as BigQuery or Snowflake should become the controlled layer once data arrives from several systems.
Reconcile before you publish
A controller should run two checks before the board sees the table:
- Reconcile billing MRR to deferred revenue: Explain timing differences caused by invoicing, contract terms, credits, refunds, and revenue-recognition schedules.
- Reconcile cohort starts to contract effective dates: Confirm that the date used for cohort assignment matches the signed commercial agreement, not merely the first invoice or first login.
Baremetrics or ChartMogul can provide a practical starting point for companies under $2 million ARR. Above that level, a warehouse paired with Mode or Sigma gives finance more control over definitions, segment logic, and audit trails. These thresholds are tooling recommendations, not performance benchmarks.
Another dashboard won't repair inconsistent source data. An outsourced controller adds more value when reconciliations, ASC 606 schedules, close ownership, and management reporting are already consuming the team's capacity. Review revenue recognition automation when your cohort table needs to tie into the accounting workflow rather than sit beside it.
Your 30-Day Cohort Analysis Action Plan
Run the work as a finance project with a deliverable every week.
Week one builds the baseline
Pull subscription and accounting data from Stripe, QuickBooks, Xero, NetSuite, HubSpot, or your warehouse. Lock the cohort start definition, reconcile billing MRR to deferred revenue, and build the first logo retention curve. Don't add every possible segment. Start with monthly acquisition cohorts and one consistent activity definition.
Week two connects revenue to acquisition
Add revenue cohorts and bridge starting MRR to ending MRR through churn, downsell, contraction, expansion, and price changes. Calculate LTV and CAC payback by acquisition channel. Flag any channel whose customers book quickly but fail to retain through the relevant observation window.
Week three turns patterns into interventions
Compare newer and older cohorts against your chosen benchmarks. List the three clearest red flags in your own data, such as an early retention drop, concentrated expansion, or a mismatch between user activity and account value. Assign each red flag to an owner in product, sales, customer success, or finance, and define the action that will change the next cohort.
Week four makes the report recurring
Package the findings into a one-page board summary. For every metric, state the budget implication: increase onboarding capacity, tighten acquisition, redesign implementation, change packaging, or preserve the current investment. Schedule the monthly cohort review and keep a versioned definition sheet so the numbers remain comparable.
If you want outside execution, book a free diagnostic with Jumpstart Partners to have a US-based, CPA-certified controller build and maintain cohort dashboards inside a 5-day month-end close, backed by a 99.8% accuracy guarantee.
Jumpstart Partners provides outsourced controller and bookkeeping support for SaaS, agencies, and professional services businesses generating $500K to $20M in revenue, including cohort reporting, revenue recognition, reconciliations, and investor-ready financials. Visit Jumpstart Partners to connect your retention table to a dependable monthly close and a finance action plan.