Financial Operations
How to Calculate LTV That Actually Drives Decisions
Learn how to calculate LTV for SaaS and growing businesses with step-by-step formulas, worked examples, CAC ratio benchmarks, and dashboard setup tips.
ByJumpstart Partners, CPA, QuickBooks ProAdvisor
··14 min readIf you miscalculate LTV, you don't just get a bad metric, you get bad spending decisions. In SaaS, agency, and professional services businesses, that usually means you keep funding acquisition long after the math says to slow down, or you underinvest in growth because the number on the dashboard is stale, inflated, or built on the wrong formula.
The core mechanic is simple. For mortgage-style LTV, Fannie Mae defines it as loan amount divided by property value, multiplied by 100, and the denominator changes by transaction type, which is why the same loan can produce different LTVs in different contexts (Fannie Mae LTV ratios). Business LTV works the same way in spirit, the denominator has to match the way your revenue behaves, or the answer looks precise and still misleads you.
Table of Contents
- Why Most LTV Numbers Are Wrong and Expensive
- The Simple ARPU and Churn Formula
- Cohort-Based LTV for Real-World Customer Behavior
- DCF-Adjusted LTV for Long-Contract and High-Value Clients
- Choosing the Right LTV Method for Your Business
- Red Flags That Invalidate Your LTV Calculation
- Implementing LTV Tracking in Your Accounting Stack
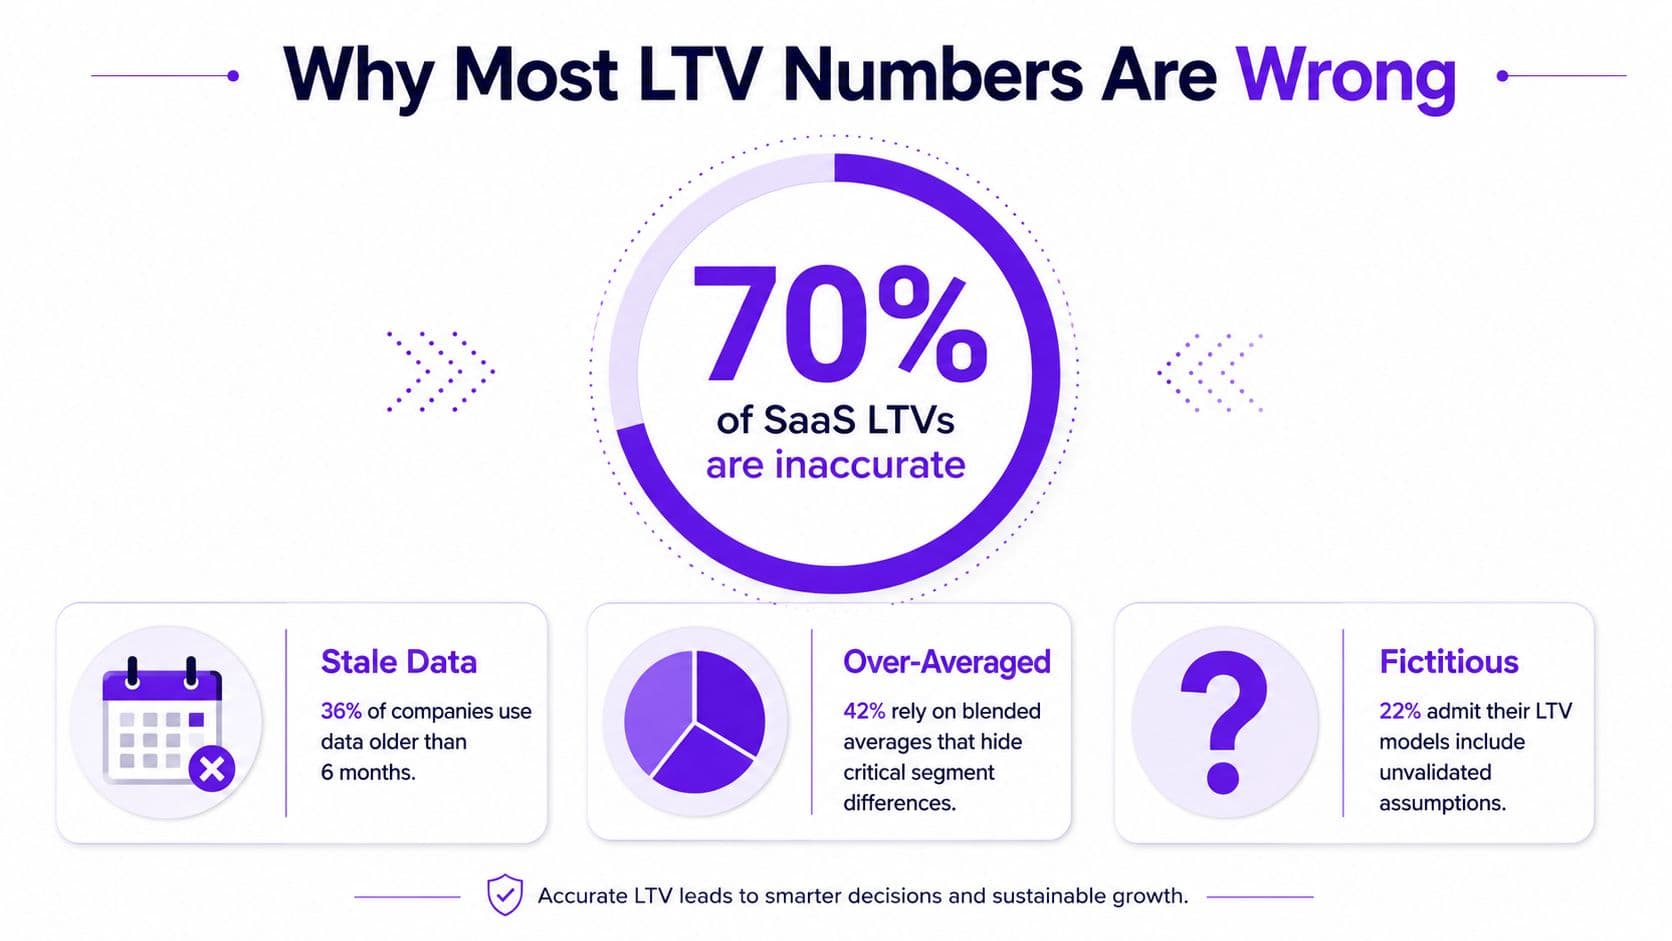
Why Most LTV Numbers Are Wrong and Expensive
A lot of founders are making acquisition decisions off an LTV number that's either fictitious, stale, or averaged into uselessness. That sounds harsh because it is harsh. If you're spending real money on ads, sales headcount, partnerships, and onboarding, a fake LTV doesn't just distort reporting, it changes the size of the bets you make.
The SaaS shortcut is the clearest place to see why this goes wrong. Baremetrics shows the basic logic as ARPU divided by monthly churn, and its worked example of $80 average monthly revenue and 4% monthly churn gives $2,000 LTV (Baremetrics SaaS LTV). If churn changes, your customer lifespan changes. A lower monthly churn rate means each customer lives longer, so your acquisition spend has more time to pay back.
The denominator matters more than the headline number
That's why two businesses with the same ARPU can have very different economics. If churn is lower, the same revenue stream becomes worth more because the customer survives longer. If churn rises, LTV collapses faster than most founders expect, and that usually shows up as a cash problem before it shows up in a board deck.
Practical rule: if your LTV isn't tied to a current churn rate or current cohort behavior, it's probably a storytelling number, not a finance number.
For SaaS businesses, Harvard Business School frames the strategic version in finance terms, lifetime value equals customer contribution margin times customer lifetime (Baremetrics summary of HBS logic). That's the right mental model for any recurring business. You're not asking what a customer buys once, you're asking what they contribute over time.
And the business impact gets real. LTV is the number that tells you whether growth is a cash-burning trap or a compounding engine. If you want the accounting side of that relationship, especially around revenue timing, read how ASC 606 shapes recurring revenue reporting.
The Simple ARPU and Churn Formula
A monthly LTV formula is only useful if it starts with current operating numbers, not stale assumptions. The simplest version is LTV = ARPU ÷ monthly churn. ARPU is your average monthly revenue per account, and monthly churn is the share of customers you lose each month. Divide the first by the second, and you get an estimate of how much revenue a customer produces before leaving. For a clean definition of the revenue side, it helps to keep monthly recurring revenue separate from one-time fees or implementation work.
The profit-aware version is the one I use for spend decisions. Multiply ARPU by gross margin first, then divide by churn. That gives you an LTV number based on profit contribution, not just topline revenue, which is the part you can spend against.
A worked SaaS example
Take a SaaS business with $120 ARPU, 3% monthly churn, and 72% gross margin. The revenue-based LTV is $4,000, because $120 ÷ 0.03 = $4,000. The gross-margin-adjusted version is $2,880, because $120 × 0.72 ÷ 0.03 = $2,880.
That gap matters in practice. A revenue-only LTV can make acquisition look much healthier than it really is. For founders running lean teams, the profit-adjusted number is the one that should set spend limits, hiring decisions, and channel tests.
The same logic works for recurring agencies and retainer-based firms. If a digital agency bills $4,500 per month per client with 2% monthly churn and 45% gross margin, the revenue-based LTV is $225,000, and the gross-margin-adjusted LTV is $101,250. The formula still works because the economics are recurring, but the number only becomes useful when you tie it to gross profit.
Why the simple formula breaks down
The weakness is constant churn. Real customer bases do not behave that neatly. Early customers, enterprise customers, and low-engagement customers often churn at different rates, and expansion revenue can offset losses. That is why the simple formula is a starting point, not the final answer.
Here's the source video if you want a quick visual refresher.
Cohort-Based LTV for Real-World Customer Behavior
Cohort analysis is the version of LTV that stops lying to you. A cohort is just a group of customers who started in the same month. Instead of assuming every customer behaves like the average customer, you track each cohort separately and compare how they spend, retain, and expand over time.
That matters because real businesses change. New customers may onboard faster, plans may improve, or a product may get stickier. A cohort view tells you whether newer customers are better than older ones, which a blended average hides.
Three cohorts, three different outcomes
Use the same structure every time. Start with the acquisition month, track retention at month 12, and multiply that by average revenue per customer.
| Cohort | Starting Customers | Month 12 Retention | Avg Revenue per Customer | Cohort LTV (12 mo) |
|---|---|---|---|---|
| January 2025 | 100 | 50% | $120 | $720 |
| April 2025 | 100 | 65% | $135 | $1,053 |
| July 2025 | 100 | 75% | $150 | $1,350 |
The math is simple. January's cohort generates $720 by month 12 because fewer customers remain and average revenue stays lower. April and July improve because retention and revenue per customer both move in the right direction. That's the signal you want to see in a healthy recurring business.
How to calculate the cohort number
Start with starting customers. Then measure month 12 retention for each cohort. Next, calculate average revenue per customer for that cohort over the period you care about. Multiply the retained customer count by average revenue per customer, and you have cohort LTV.
A cohort table beats a single LTV number because it shows trend direction, not just a snapshot.
This method is the best fit when expansion revenue matters, when seasonality distorts the monthly average, or when product-led growth makes customer behavior improve after onboarding. It also gives you a realistic way to compare acquisition channels, because not every channel attracts the same kind of customer.
If you want to go deeper on churn patterns and why cohorts expose them, this churn analysis guide is the right companion read.
DCF-Adjusted LTV for Long-Contract and High-Value Clients
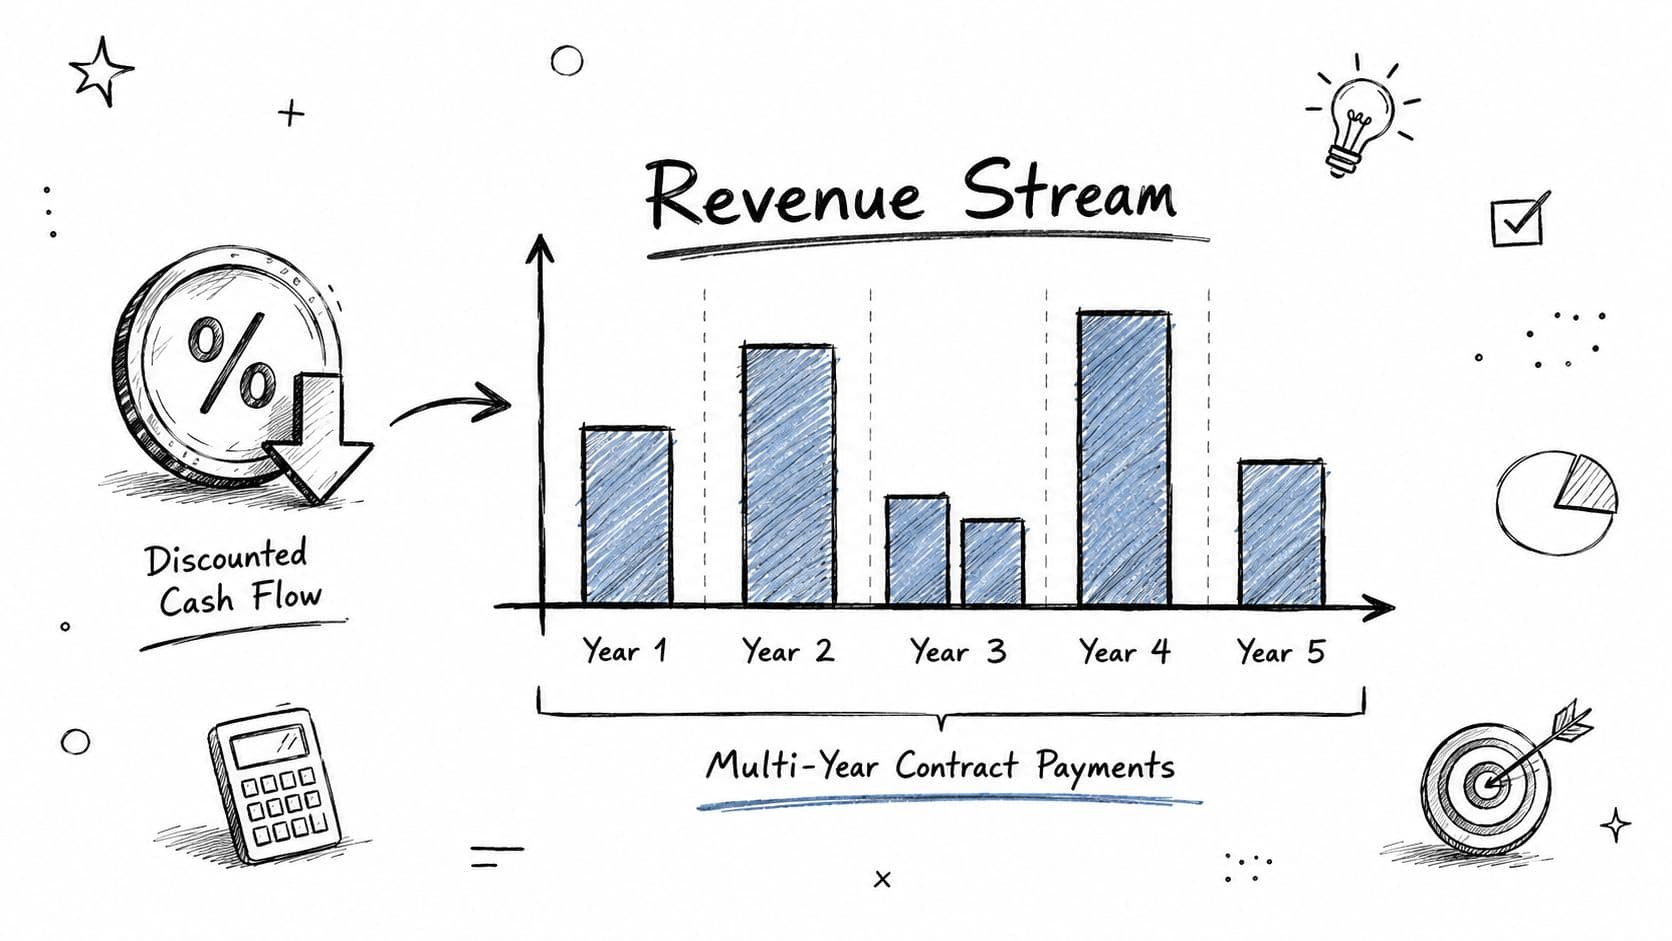
For long contracts and high-touch retainers, the simple formula still helps, but it ignores the time value of money. That's where discounted cash flow, or DCF, earns its place. You forecast the expected gross profit by period, discount each period back to present value, and sum the result.
This is the right model for multi-year agency retainers, enterprise SaaS contracts, and professional services relationships where revenue arrives unevenly. It's also the version investors take seriously when future cash flows matter more than short-term booking noise.
A worked retainer example
Take a $36,000 per year agency retainer, 4-year average retention, 40% gross margin, and a 12% discount rate. The nominal LTV is $57,600 because $36,000 × 4 × 40% = $57,600. After discounting those cash flows, the present value lands around $46,000.
That gap is the point. Revenue you collect later is worth less than revenue you collect now, and the farther out the cash flow sits, the more that discount matters. If you're comparing two long-term client segments, DCF helps you avoid overpaying for revenue that arrives too slowly.
When DCF is worth the effort
Use it when contract length is long, payment timing is uneven, or you're preparing investor-grade reporting. It's overkill when you're still trying to stabilize churn or clean up messy revenue recognition. In those cases, a gross-margin-adjusted cohort model is usually enough.
If you're valuing a business or preparing for diligence, startup company valuation mechanics become relevant quickly, because LTV feeds the broader picture of cash generation and risk.
Choosing the Right LTV Method for Your Business
Stop asking which formula is universally correct. Ask which formula matches your revenue model and data maturity. That's the only decision that matters, because the wrong method creates false confidence and the right one gives you spend limits you can defend.
A quick decision table
| Business model | Best starting method | Why it fits |
|---|---|---|
| Pure SaaS | ARPU ÷ churn | Stable recurring revenue, clean monthly data |
| Growth-stage SaaS with expansion | Cohort-based LTV | Captures retention changes and upsell behavior |
| Agencies and professional services | DCF-adjusted LTV | Handles retainer timing and long contracts |
| High-value enterprise accounts | DCF-adjusted or cohort-based | Reflects uneven revenue and longer sales cycles |
For most $500K to $20M businesses, the right sequence is simple. Start with the plain ARPU and churn formula. Validate it against one cohort analysis. Move to DCF only when you need board-ready or fundraising-grade precision.
That approach keeps you from overengineering too early. A finance team can burn weeks building a model that no one uses, while a simpler model updated monthly changes decisions. The winner is the version your leadership team will trust enough to act on.
LTV only matters when it meets CAC
LTV by itself is incomplete. You need the LTV:CAC ratio and the CAC payback period to know whether growth is healthy. LTV:CAC is calculated as LTV divided by customer acquisition cost. CAC payback is how long it takes gross profit from a customer to recover acquisition spend.
A $2,880 LTV against a $1,200 CAC gives you a 2.4:1 ratio. That is below the 3:1 rule of thumb most investors and operators use for healthy SaaS economics, and it's a warning that your acquisition spend is too aggressive for the value you're generating (LTV:CAC guidance).
Most operators expect LTV:CAC above 3:1 and CAC payback under 12 months for SaaS, because anything weaker leaves too little room for operating overhead and growth error.
If your monthly gross profit per customer is $90 and CAC is $1,200, payback is 13.3 months. That's too slow for a business trying to scale efficiently. If monthly gross profit is $150, payback drops to 8 months, and the same CAC becomes much easier to defend.
Red Flags That Invalidate Your LTV Calculation
The fastest way to break LTV is to make it look stable when it isn't. I see the same six mistakes over and over: churn annualized wrong, blended churn used instead of cohort churn, gross margin ignored, discounting skipped, revenue used where gross profit belongs, and a single point estimate treated as if it were the truth.
What to audit immediately
- Monthly churn treated as annual churn: If you plug a 3% monthly churn rate into an annual formula without converting it properly, you overstate lifespan and inflate LTV. The correction is to keep the time period aligned, then recalculate from current monthly data.
- Blended churn used for every segment: If enterprise churn is low and SMB churn is high, the blended number hides the decline in one group. The fix is cohort or segment churn, not a company-wide average.
- Gross margin ignored: Revenue-only LTV makes acquisition look stronger than it is. The corrected version uses profit contribution, not topline revenue.
- Discounting skipped for long-lived customers: If contracts last years, future cash isn't worth the same as current cash. Use DCF when the relationship spans multiple periods.
- Revenue used where gross profit belongs: If CAC is measured in cash and LTV in revenue, the ratio is not apples-to-apples. Use gross profit when you're deciding how much to spend.
- One point estimate treated as gospel: A single number hides uncertainty. A range is more honest and more useful for planning.
A good LTV model should survive a skeptical CFO review. If it can't explain why a cohort underperformed, or why a channel looked healthy last quarter and weak this quarter, it isn't ready for capital allocation.
The practical fix is simple. Recalculate by segment, compare revenue-based and profit-based values, and check whether the result still supports the CAC you're paying. If it doesn't, the model is wrong or the business is changing faster than the spreadsheet.
Implementing LTV Tracking in Your Accounting Stack
LTV becomes useful when it updates with your books, not when someone rebuilds it for a board meeting twice a year. The common failure mode is predictable. A founder asks for LTV, finance builds a slide, and the metric never gets touched again.
Wire it into the monthly close
Pull customer-level revenue from Stripe or QuickBooks, then reconcile it against your accounting system so the revenue base is clean. If you want the chart of accounts to support reporting instead of fighting it, this chart of accounts guide is the place to start.
From there, calculate ARPU, monthly churn, and cohort retention in a spreadsheet or BI tool. Surface LTV, CAC, and payback in the same dashboard so leaders can compare spend against value in one view. The numbers should be reviewed as part of the monthly close, not tucked away in an ad hoc model.
A practical monthly workflow
- Reconcile revenue first: Tie Stripe, QuickBooks, Xero, or NetSuite to customer-level records so your base data is accurate.
- Refresh cohorts monthly: Update retained customers, expansion revenue, and churn by acquisition month.
- Recompute LTV and CAC: Use the same methodology every month so the trend is meaningful.
- Review with leadership: Put the ratio and payback period in the monthly reporting pack.
- Flag exceptions: Any channel or segment that moves sharply gets investigated before the next spend decision.
If LTV only appears in a board deck, it's not a control metric. It's a presentation metric.
The goal is investor-ready reporting without manual heroics. For growing SaaS, agency, and professional services firms, that usually means a close process that's fast enough to keep the data current and structured enough to support real decision-making.
If you want your LTV model cleaned up, tied to your books, and reviewed every month instead of once a quarter, Jumpstart Partners can build the reporting, close process, and KPI stack that makes it happen. They work with growing SaaS, agencies, and service businesses that need investor-ready numbers, cleaner revenue recognition, and a finance function that doesn't live in spreadsheets.