Financial Operations
What Is a Chart of Accounts? Your 2026 Guide
Learn what is a chart of accounts and its business importance. This guide covers setup, industry examples (SaaS, e-comm), & best practices for growth.
ByJumpstart Partners, CPA, QuickBooks ProAdvisor
··26 min readA chart of accounts is the structured list of every account your business uses to record transactions, and for companies scaling from $500K to $20M, it needs a 4 to 6 digit hierarchy to produce reliable reporting. If your COA is poorly segmented, SaaS businesses can end up with 15% to 25% inaccuracies in ARR calculations, and that’s not an accounting problem. That’s a decision-making problem.
Most founders treat the COA like bookkeeping plumbing. That’s a mistake. Your chart of accounts is your company’s financial DNA. It determines whether your P&L tells the truth, whether your cash flow forecast is useful, and whether an investor or lender sees a disciplined company or a mess hidden behind top-line growth.
If you’re running a growing SaaS company, agency, or services business out of a default QuickBooks template, your reporting is probably flatter than your business model. You can’t see which revenue streams are healthy, which costs are bloated, or where margin is leaking. You’re looking at totals when you need drivers.
That’s why what is a chart of accounts isn’t a beginner accounting question. It’s a growth question. The right COA gives you clean financial statements, faster closes, better KPI reporting, and a finance stack that scales with you instead of slowing you down.
Why Your Business Is Flying Blind Without a Strategic COA
Founders usually notice the problem when the numbers stop agreeing.
Your bank balance says one thing. Your P&L says another. Your dashboard says CAC is fine, but cash keeps disappearing. Payroll lands, sales tax hits, a few vendor bills clear, and the “profitable” month suddenly feels tight. That is not a reporting inconvenience. It is a chart of accounts problem.
A weak COA hides the underlying economics of the business. If QuickBooks is still running on a generic setup with broad buckets like Sales, Marketing, and Software, you are managing a $500K to $20M company with small-business plumbing. That setup blocks clean visibility into margin, burn, working capital, and revenue quality.
Generic accounts produce generic decisions
A founder does not need more reports. A founder needs reports that answer useful questions.
Can you separate recurring SaaS revenue from implementation revenue? Can you see contractor costs apart from payroll? Can you isolate merchant fees, refunds, and shipping for e-commerce? Can your agency break out retainer revenue from project work and media pass-through? If the answer is no, your finance team is forced to guess, reclass, and explain away noise every month.
That is how businesses fly blind. They rely on totals instead of drivers.
For scaling companies, that creates expensive mistakes. You overhire because service revenue looks as healthy as recurring revenue. You underprice because fulfillment costs are mixed into overhead. You miss a cash squeeze because deferred revenue, prepaids, and debt payments are buried in the wrong places. If your books cannot separate what is repeatable, what is variable, and what is timing-related, your decisions will be late and your board materials will be weaker than they should be.
Practical rule: If revenue, gross margin, and burn require a spreadsheet cleanup before anyone trusts them, the COA is failing its job.
The bank balance is not a strategy
Founders over-trust cash in the account because it feels concrete. It is not enough.
Cash can look healthy while the business is stretched. Deferred revenue creates obligations. Payroll timing distorts reality. Inventory purchases, software annual prepayments, and loan payments all hit differently than founders expect. A disciplined 13-week cash flow forecast forces those timing issues into view, but that forecast only works if the underlying accounts are organized correctly.
Double-entry discipline matters here. If your team needs a refresher on the mechanics, this UK double entry accounting guide is a useful reference. The bigger issue for a scaling company is structure. Every transaction needs to land in the right place the first time, or your reporting stack turns into monthly cleanup work.
Signs your current COA is blocking growth
- Revenue is lumped together. You cannot separate subscription revenue, setup fees, project revenue, product sales, or discounts.
- Cost of goods sold is unclear. Gross margin is unreliable because fulfillment, delivery, contractor labor, or hosting costs sit in operating expenses.
- Balance sheet accounts are messy. Deferred revenue, prepaids, loan balances, and credit cards are grouped too broadly to manage cash with confidence.
- Month-end turns into rework. Your team spends closing week fixing coding errors instead of reviewing performance and making decisions.
- Investor questions trigger manual analysis. You cannot answer basic diligence requests without exporting data and rebuilding the story in Excel.
A strategic COA fixes that. It gives SaaS, agency, and e-commerce operators clean reporting by revenue stream, cost structure, and liability type. It gives lenders and investors confidence that your numbers can survive scrutiny. It gives management a finance system that explains what happened and supports what to do next.
The Financial DNA Your Accountant Never Explained
A chart of accounts is the master index for your accounting system. Every transaction in QuickBooks, Xero, or NetSuite gets assigned to one of those accounts. That’s why the COA shapes every report you rely on.
To use a simple comparison, picture a library catalog. The books are your transactions. The catalog is the chart of accounts. If the catalog is sloppy, you can still put books on the shelf, but nobody can find what they need.

The five account types you actually need to understand
Here’s the plain-English version.
| Account Type | What it means | Simple example |
|---|---|---|
| Assets | What you own | Cash, accounts receivable, prepaid software |
| Liabilities | What you owe | Credit cards, loans, deferred revenue |
| Equity | What’s left after liabilities are subtracted from assets | Owner equity, retained earnings |
| Revenue | What you earn | Subscription revenue, project revenue |
| Expenses | What you spend | Payroll, contractors, rent, ad spend |
That’s it. Everything in your accounting system rolls into one of those buckets.
Why the balance sheet matters more than founders think
Most founders obsess over the P&L and ignore the balance sheet. That’s backward.
The balance sheet is where accounting discipline shows up. If you collect annual SaaS contracts upfront and record all of it as current revenue, your P&L looks stronger than reality. A proper COA prevents that by assigning cash inflows to one account and deferred revenue to another until the revenue is earned.
The logic sits on the accounting equation:
Assets = Liabilities + Equity
That equation has to stay in balance. Every transaction hits at least two places. If you want a straightforward explanation of that system, this UK double entry accounting guide is a useful refresher.
When a founder says, “I just need the P&L,” what they usually mean is, “I don’t yet see how balance sheet mistakes are distorting the P&L.”
The COA and general ledger are not the same thing
Founders often mix these up.
The chart of accounts is the structure. The general ledger is the record of transactions posted into that structure. If your COA is bad, your general ledger gets filled with bad categorization at scale. That’s why cleanup gets expensive later.
If you want the distinction clearly laid out, read this general ledger explainer. It helps make sense of why “bookkeeping cleanup” is often really “COA redesign plus transaction remapping.”
What this looks like in practice
A software company gets paid upfront for a yearly contract. Cash goes up. That’s an asset. But the full amount isn’t earned yet, so part of it goes to deferred revenue. That’s a liability.
A services firm invoices a client. Accounts receivable goes up. That’s an asset. Revenue also goes up, assuming the work is earned under its accounting policy.
A clean COA makes those flows obvious. A messy one hides them inside generic accounts and forces your team to reconstruct the story later.
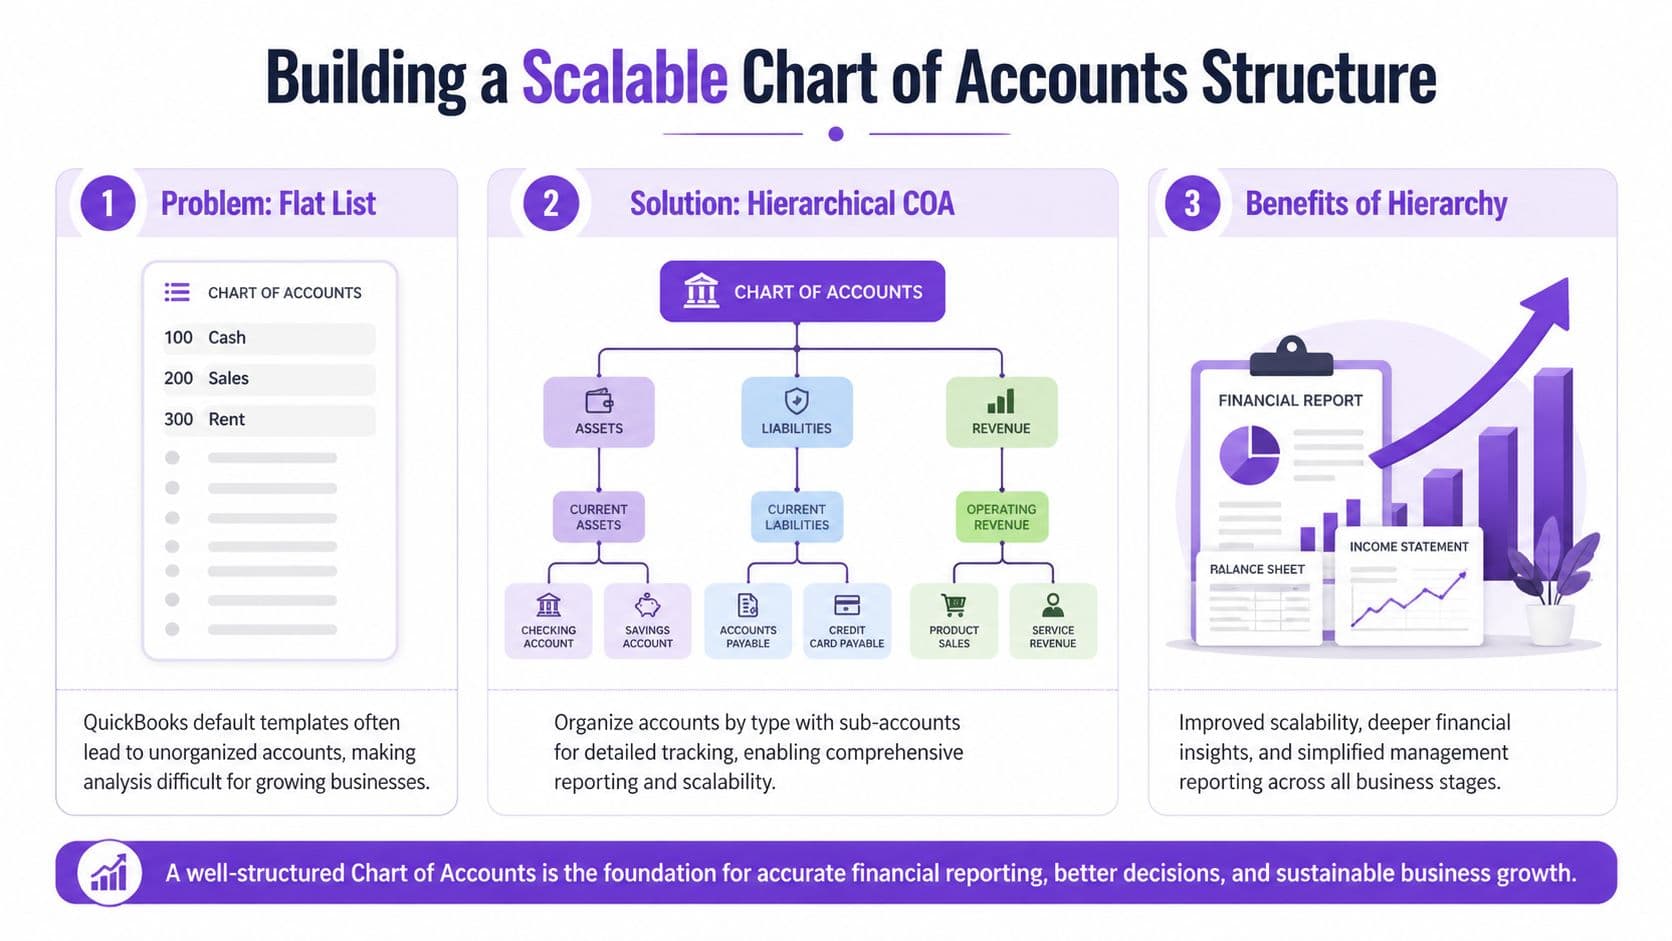
Building a Scalable COA Structure for Growth
A growth-stage company rarely fails because it lacks data. It fails because the data is trapped inside a bad chart of accounts.
The default COA in QuickBooks works at $200K in revenue. It starts breaking at $2M. By then, you have multiple revenue streams, payment processors, departments, sales channels, and investor questions your books cannot answer cleanly. If your COA still looks like a flat list of generic accounts, finance is rebuilding reality in spreadsheets every month.
Use account numbers that make reporting obvious
Start with a numbering system your team can read without a decoder ring:
- 1000s for assets
- 2000s for liabilities
- 3000s for equity
- 4000s for revenue
- 5000s and above for expenses
For a company planning to scale, use a hierarchical structure with 4 to 6 digits. That gives you room to group accounts logically, add detail where management needs it, and avoid a rebuild every time the business adds a product line or channel.
Here is a simple SaaS example:
| Account Number | Account Name | Why it exists |
|---|---|---|
| 1010 | Operating Cash | Main bank account tracking |
| 1200 | Accounts Receivable | Customer invoices due |
| 2510 | Deferred Revenue | Cash collected but not yet earned |
| 4100 | New MRR | New subscriptions added |
| 4200 | Expansion MRR | Upsells and seat growth |
| 4300 | Churn | Lost recurring revenue |
| 6100 | Paid Search | Channel-specific CAC tracking |
| 6200 | Content Marketing | Non-paid acquisition spend |
That structure gives management usable information fast. You can see whether growth came from new logos, expansions, or marketing spend without dumping transactions into Excel and rebuilding the P&L by hand.
Build for scale, not cleanup
Founders usually wait too long to redesign the COA. They keep adding accounts reactively, then wonder why the month-end close drags and KPI reporting keeps changing. A better approach is to design the COA around the decisions management needs to make every month.
For a SaaS company between $500K and $20M, that usually means separating recurring revenue categories, deferred revenue, direct delivery costs, sales and marketing spend by function, and payroll by department. For an agency, it means seeing labor, contractors, pass-through spend, and delivery margin clearly. For e-commerce, it means inventory, refunds, merchant fees, fulfillment, and contribution margin are visible without manual rework.
As noted earlier, larger SaaS finance teams often end up with far more active accounts than founders expect. That is not a problem if the structure is clean. The problem is randomness.
My recommendation: Build the COA around board questions, lender questions, and margin questions. If the structure cannot answer those three, fix it now.
Parent accounts and sub-accounts beat account sprawl
More detail does not mean creating 40 versions of the same expense account.
Use parent accounts for reporting totals and sub-accounts for operating insight. For example, 4000 Subscription Revenue can roll up 4110 New Business, 4120 Expansion, and 4130 Reactivation. A parent marketing account can hold channel-level sub-accounts. Payroll can break into sales, customer success, product, and G&A.
That keeps reporting clean while preserving detail. It also prevents one of the most common founder mistakes in QuickBooks. Creating a new account every time someone wants to track a team, region, or product. Use classes, locations, or departments for dimensional reporting. Use the COA for financial structure.
If your books are already messy, start with a remapping exercise and a monthly close process that enforces the new logic. This startup bookkeeping cleanup process is a practical place to begin.
A worked example with deferred revenue
Here is the practical consequence of getting this wrong.
A SaaS customer prepays $12,000 for a 12-month contract. If your team books the full $12,000 to revenue in January, the P&L looks great for one month and wrong for the next eleven. A structured COA routes the cash to 1010 Operating Cash, records the unearned portion in 2510 Deferred Revenue, and recognizes revenue monthly as the service is delivered.
That one setup choice affects revenue accuracy, board reporting, ARR credibility, and investor trust. A sloppy COA does not just create accounting noise. It distorts the numbers you use to run the company.
Industry Specific COA Templates and Key Metrics
A $5M company with a generic chart of accounts usually gets one outcome: management reports that look clean and answer the wrong questions.
That is a significant problem with industry-agnostic COA templates. They satisfy bookkeeping. They do not give a founder usable visibility into margin, cash conversion, or the drivers an investor will ask about in diligence. If you plan to scale from $500K to $20M, your COA has to reflect how your business makes money.
SaaS companies need revenue categories that match board metrics
For SaaS, the COA should mirror the metrics you discuss in board meetings and fundraising updates. If your accounting system cannot separate new subscription revenue from expansion activity and churn impact, your team ends up rebuilding basic SaaS reporting in spreadsheets every month. That is a control problem, not just an efficiency problem.
Here is a sample framework I would use for a SaaS business.
| Account Number | Account Name | Account Type | Description/Purpose |
|---|---|---|---|
| 1010 | Operating Cash | Asset | Primary bank account |
| 1200 | Accounts Receivable | Asset | Open customer invoices |
| 2510 | Deferred Revenue | Liability | Cash collected before revenue is earned |
| 4100 | New MRR | Revenue | New subscription revenue added |
| 4200 | Expansion MRR | Revenue | Upsell and cross-sell growth |
| 4300 | Churn | Revenue | Lost recurring revenue tracked separately |
| 5100 | Cost of Service Delivery | Expense | Hosting or direct platform costs |
| 6100 | Paid Acquisition | Expense | Direct customer acquisition spend |
| 6200 | Sales Payroll | Expense | Sales team compensation |
| 6300 | Customer Success Payroll | Expense | Retention and support labor |
With this setup, a founder can answer questions that matter:
- Is growth coming from new logos or account expansion?
- Is churn erasing sales productivity?
- Is CAC rising because media spend increased or because sales payroll got heavier?
- Are onboarding and implementation costs visible enough to price services correctly?
If those answers live outside the ledger, your KPI stack is weaker than you think.
Agencies and services firms need direct cost separation
The average agency does not have a revenue problem. It has a visibility problem.
Revenue looks fine at the top line, but delivery margin gets buried because payroll, contractors, software, and pass-through costs are mixed together. Then the founder cannot tell whether poor profitability comes from bad pricing, over-servicing, weak utilization, or a client that should have been fired six months ago.
A useful agency COA usually separates:
- Retainer revenue
- Project revenue
- Pass-through revenue
- Employee delivery payroll
- Contractor delivery costs
- Software tied to fulfillment
- Sales and admin overhead
Here is the standard I recommend. If your agency is between $1M and $10M, you should be able to pull client or service-line gross margin without asking the bookkeeper for a custom export. If you cannot, your COA is too shallow.
For Xero users that also need reporting dimensions by team or client type, this Xero tracking categories UK guide is useful for setting up the dimensional layer without bloating the chart itself.
E-commerce brands need tighter inventory and fee structure
E-commerce founders often focus on revenue accounts and ignore the balance sheet. That is a mistake. Once you are above roughly $1M in annual sales, inventory structure, fulfillment liabilities, and payment fees start shaping gross margin accuracy and cash planning.
The Procurify guide to chart of accounts structure, citing PwC’s 2024 retail audit data, notes that lumping inventory together can create 10% to 18% overstatement or understatement of COGS. Procurify also reports that firms using location-specific liability sub-accounts cut DPO by 12 days, which can free meaningful working capital at the $10M scale.
That is why I want inventory accounts designed with intent.
| Account Number | Account Name | Why it matters |
|---|---|---|
| 1500 | Inventory Control | Parent inventory account |
| 1510 | Finished Goods | Core on-hand product value |
| 1550 | FBA Inventory | Inventory sitting in Amazon channels |
| 2100 | Accounts Payable | Standard vendor obligations |
| 2150 | AP Fulfillment Vendors | Separate logistics obligations |
| 5100 | Fulfillment Costs | Pick, pack, and shipping costs |
| 5200 | Payment Processing Fees | Stripe and Shopify fee visibility |
The payoff is immediate. You get cleaner gross margin, better reorder planning, and a more accurate view of channel economics.
Worked calculation for an e-commerce brand
Assume you sell $100,000 in a month.
Your books lump inventory movements together, and COGS is understated by 10% because inventory is not segmented properly. If real COGS should be $60,000, your books might show $54,000. Reported gross profit becomes $46,000 instead of $40,000.
That error changes decisions fast.
- Gross margin looks better than reality
- Cash forecasts look safer than reality
- Purchase orders get approved on bad unit economics
Now add fees. If $3,000 of Stripe and Shopify charges sit in generic overhead, your finance team loses visibility into transaction cost trends by channel and by payment mix. At scale, that hurts pricing, promotion planning, and channel selection.
One template does not fit every company
A nonprofit should not force a SaaS or agency structure into fund accounting. Use a nonprofit chart of accounts template built for restrictions, classes, and reporting by fund.
The broader point is simple. Your COA should match the economics of your business model. If it does not, your financials may still close on time, but they will not help you scale, defend margins, or look investor-ready.
Advanced Applications Mapping Your COA to KPIs
A strong COA doesn’t stop at financial statements. It becomes the raw material for your KPI dashboard.
That’s the difference between accounting and finance. Accounting records transactions. Finance turns those transactions into decisions. If your chart of accounts is designed well, you don’t need to rebuild metrics manually every month. The system already captures the categories that feed them.
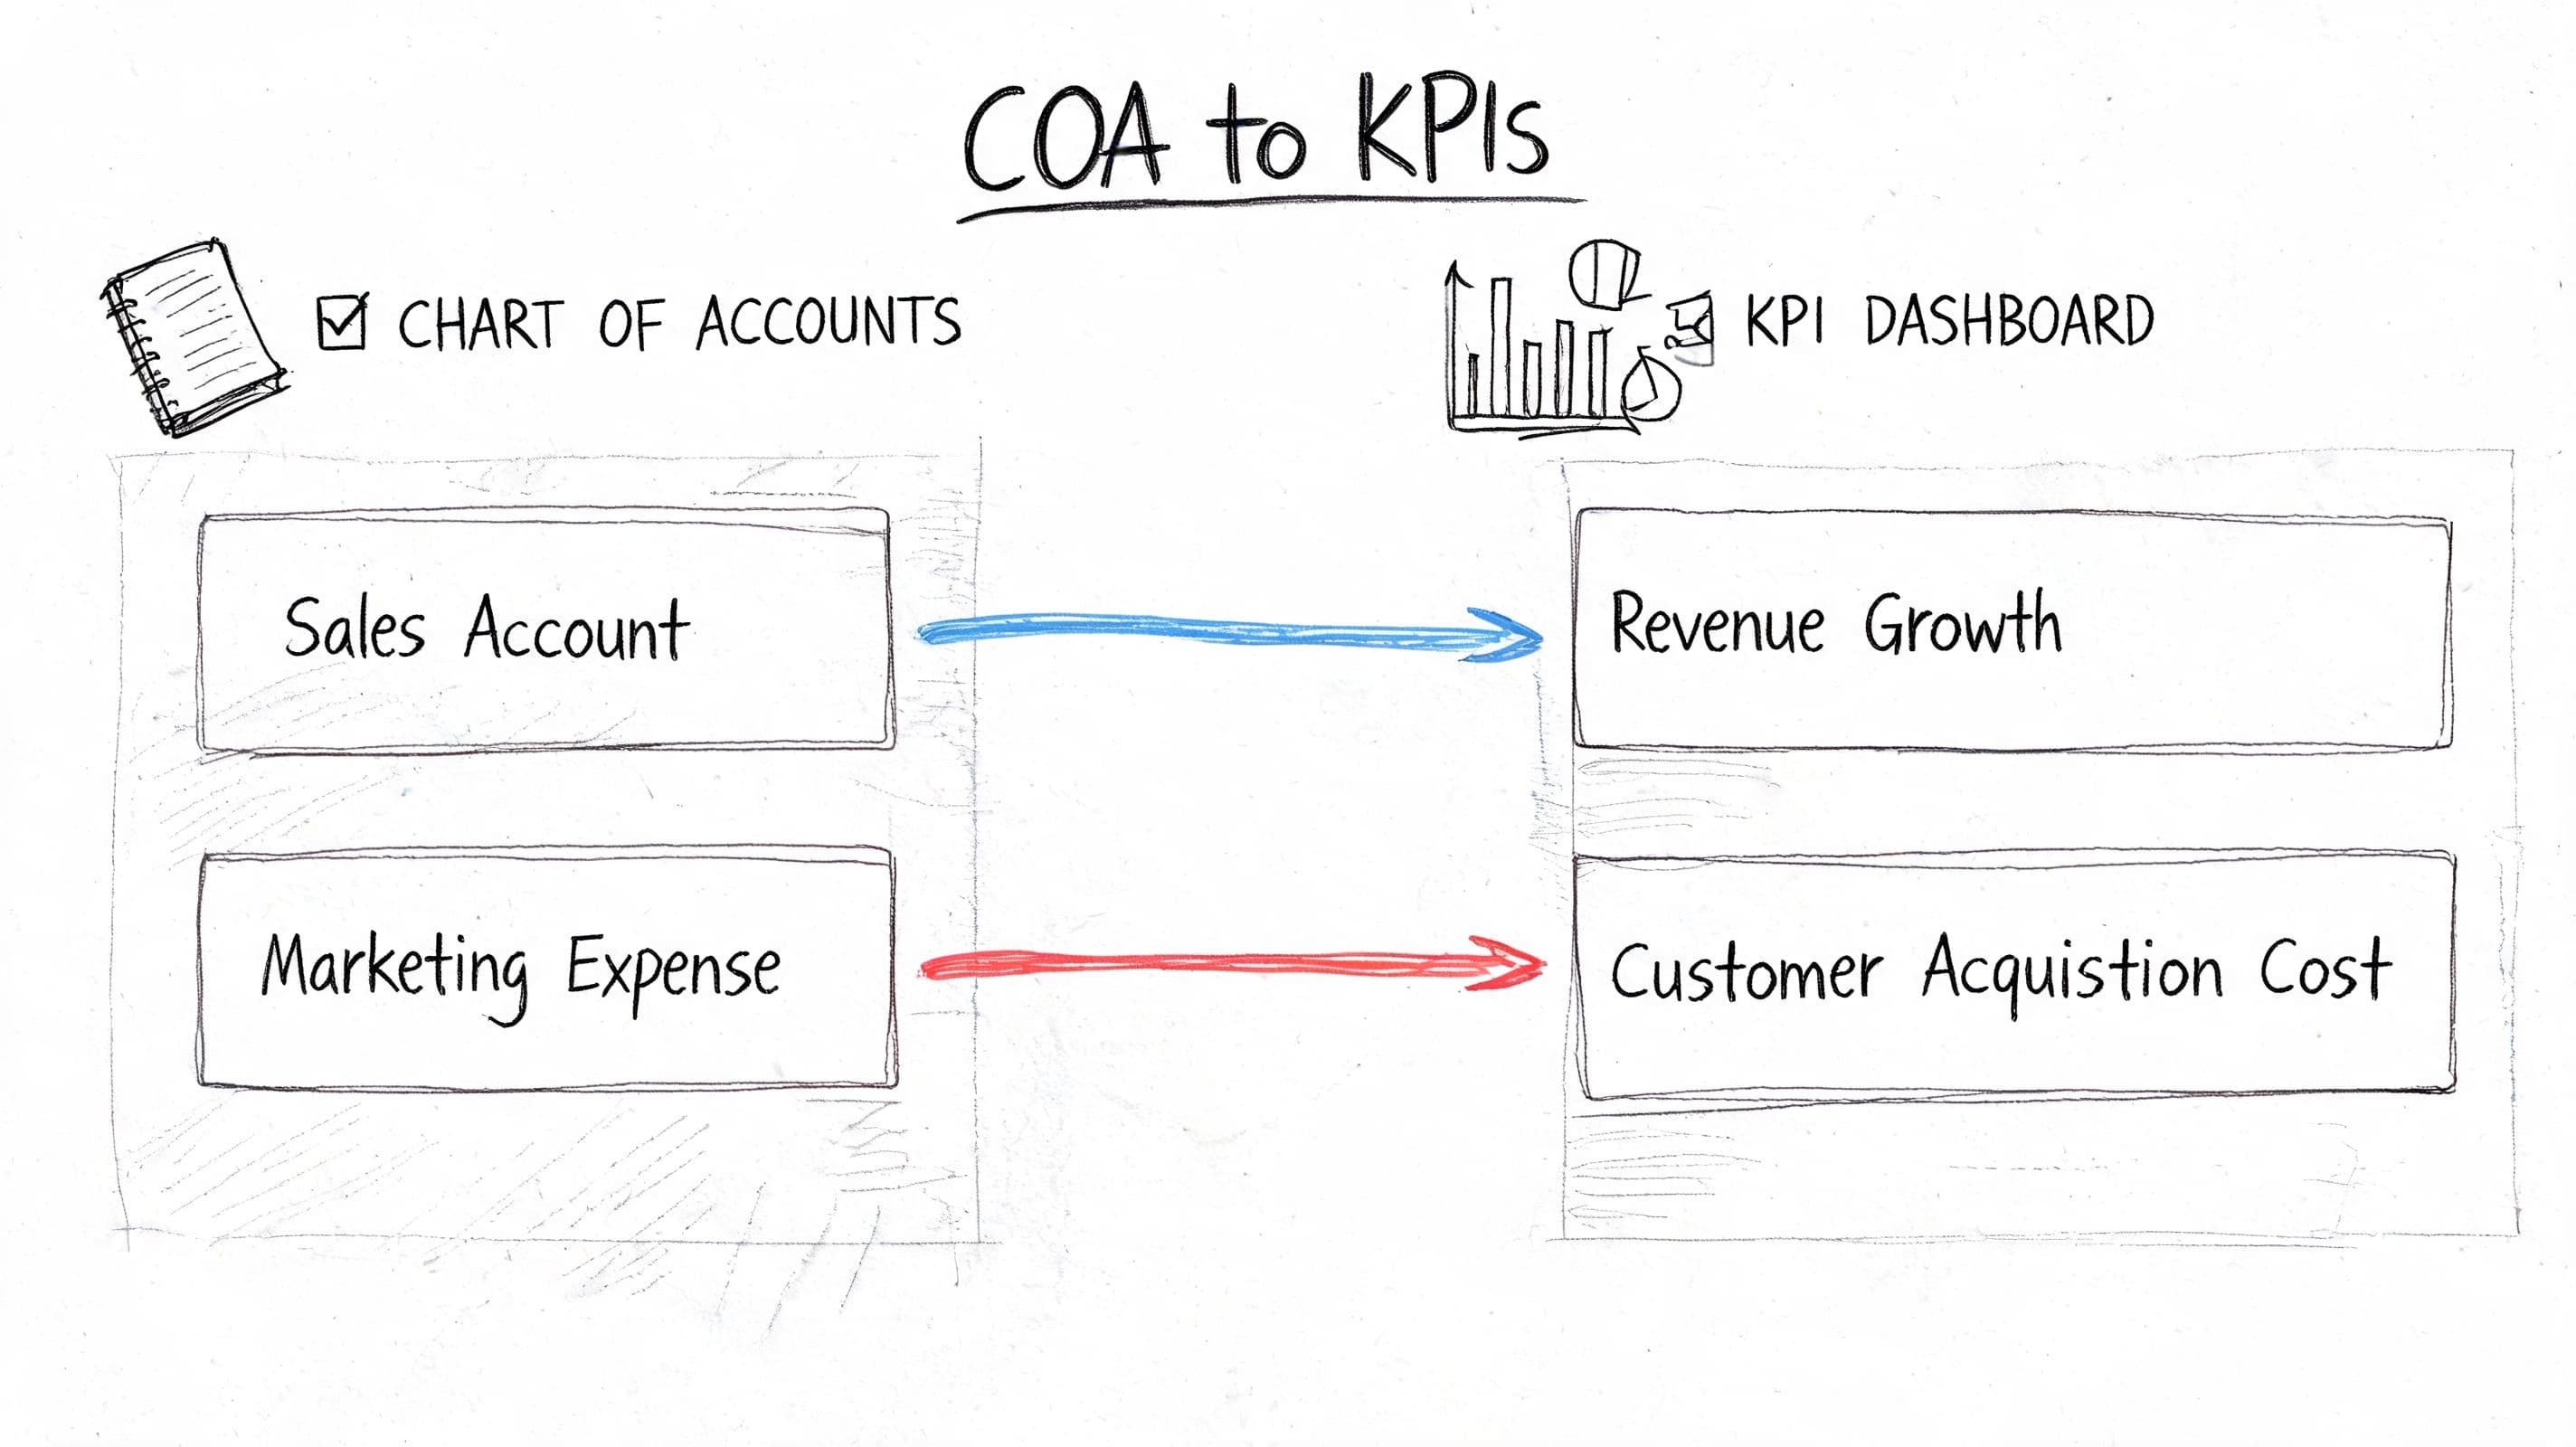
Map accounts directly to management metrics
For example, if your marketing spend is split into meaningful accounts, you can roll those lines directly into CAC reporting.
A simple setup might look like this:
| COA account | KPI use |
|---|---|
| 6100 Paid Search | CAC by paid search |
| 6110 Paid Social | CAC by paid social |
| 6120 Content Marketing | CAC by content |
| 6200 Sales Payroll | Total acquisition cost input |
| 4100 New MRR | New customer value created |
| 4200 Expansion MRR | Net revenue retention support |
Now finance can answer questions without a spreadsheet rescue mission.
- Which channels are acquiring customers efficiently?
- Is acquisition spend rising faster than new recurring revenue?
- Are expansion motions carrying growth while new logo growth weakens?
- Is payroll supporting revenue generation or bloating overhead?
If you use dimensions outside the COA, keep them disciplined too. Xero users, for example, often get better reporting by combining a clean COA with tracking dimensions rather than opening endless new accounts. This Xero tracking categories UK guide gives a practical look at when categories are smarter than account expansion.
A worked KPI example
Let’s say this month you have:
- $20,000 in paid search expense
- $10,000 in paid social expense
- $15,000 in sales payroll tied to acquisition
- $45,000 total acquisition cost
- $30,000 in new MRR booked to your new customer revenue accounts
Your finance team can now see that acquisition spending and new recurring revenue are directly traceable to the underlying ledger categories. Even if you calculate CAC and LTV in a dashboard tool, the source data is clean because the COA is clean.
That matters. When metrics live only in spreadsheets, every board meeting starts with “Which version is correct?” A disciplined COA eliminates that argument.
Clean KPI reporting starts in the ledger, not in the dashboard.
Red flags that signal COA bloat
A better COA is not the same as a bigger COA.
Too many accounts create noise. You lose consistency, people post to the wrong places, and reporting gets harder instead of better.
Watch for these signs:
- Tiny accounts everywhere: You have lots of low-activity accounts that exist because one person wanted more detail once.
- Duplicate intent: “Software,” “SaaS Tools,” and “Subscriptions” all mean nearly the same thing.
- Department tracking in account names: You’re using the COA to do the job that classes or locations should handle.
- Reporting requires manual regrouping: Your month-end package always includes spreadsheet remapping because the COA itself doesn’t roll up cleanly.
- New accounts get added without governance: Anyone can create one, so nobody trusts consistency.
If you want a clean set of outputs from your ledger, start with accurate statements. This guide on how to prepare financial statements is useful once your accounts are mapped correctly.
How to Set Up Your COA in QuickBooks Xero and NetSuite
The mechanics differ by platform. The process doesn’t.
If your current COA is messy, don’t start editing accounts live inside the software on instinct. Design the structure outside the system first. Then map and migrate with intent.
The setup process that actually works
Use this sequence.
-
Export your current COA
Pull the full list of accounts from QuickBooks, Xero, or NetSuite into a spreadsheet. Include account numbers, names, types, and whether each account is active. -
Mark what stays, merges, or gets archived
Most companies have duplicates, vague accounts, or accounts that were created for one-off situations and never cleaned up. -
Design the future-state structure in a spreadsheet
Build the hierarchy before touching the accounting system. Include parent accounts, sub-accounts, numbering logic, and notes on intended use. -
Map old accounts to new accounts
Here, cleanup succeeds or fails. Every old account needs a clear destination. -
Test reporting before full rollout
Run sample P&Ls and balance sheets. If leadership still can’t answer the basic operating questions, the structure isn’t finished. -
Train the people posting transactions
A well-designed COA still breaks if the team uses it inconsistently.
Platform-specific advice
| Platform | What to watch |
|---|---|
| QuickBooks | Use classes and locations for extra segmentation instead of adding endless accounts |
| Xero | Keep account names clean and rely on tracking categories where they add reporting value |
| NetSuite | Take advantage of stronger hierarchy and segmentation features, but don’t over-engineer them |
QuickBooks usually breaks first because founders let the default template hang around too long. Xero tends to stay cleaner if you’re disciplined. NetSuite gives you more structure, but that also means more ways to make the system too complex.
Don’t let integrations wreck your structure
Your COA also has to survive app integrations. Shopify, Stripe, payroll tools, AP tools, and billing systems all push data into the ledger. If those mappings are loose, your clean design falls apart.
That’s why I want founders to review app-level posting rules during setup. If you’re evaluating how accounting systems connect with adjacent tools, this overview of Zoho Books accounting integration is a useful example of how integration design affects downstream bookkeeping quality.
Implementation rule: Don’t rebuild the COA in production first. Prototype it in a spreadsheet, map it, then deploy it.
One practical option is to have an outside finance team handle the cleanup and migration. Jumpstart Partners provides COA cleanup, bookkeeping, and controller support for growing companies using QuickBooks, Xero, and NetSuite. That kind of support is useful when the redesign touches reporting, revenue recognition, and board-level metrics at the same time.
Common COA Pitfalls and Frequently Asked Questions
A bad chart of accounts usually fails in a predictable way. The business grows, new products or channels get added, and the finance team keeps creating accounts to patch reporting gaps. Six months later, QuickBooks is full of near-duplicate accounts, month-end closes take longer, and leadership still cannot get a clean answer on gross margin, burn, or cash conversion.
That is not a bookkeeping problem. It is a decision-making problem.
The biggest mistake is COA bloat
Founders often assume more detail creates better insight. In practice, extra accounts usually create noise. You do not need five versions of software expense, seven buckets for payment processor fees, or a separate revenue account every time a customer contract looks slightly different. You need a structure that supports reporting, keeps posting rules clear, and stays stable as the business scales from $500K to $20M.
At Jumpstart Partners, we regularly find material reporting errors tied to bloated or poorly structured COAs, often because transactions are posted inconsistently across too many overlapping accounts.
A bloated COA creates three real costs:
- Bad KPI reporting: Gross margin, CAC payback, contribution margin, and operating burn get distorted when expenses are scattered across inconsistent accounts.
- Longer closes: The controller spends time reclassing transactions instead of reviewing results.
- Harder diligence: Investors and lenders want clean trends. If every month requires spreadsheet regrouping, your numbers look weak even when the business is strong.
“A clean, scalable chart of accounts makes fundraising and audits easier because the financial story is already organized before anyone asks for backup.”
Jumpstart Partners CPA team
Red flags you should fix now
- You have multiple accounts that mean almost the same thing
- No one has a rule for when a new account should be created
- Month-end includes repeated reclasses from one expense bucket to another
- Board reporting depends on manual remapping outside the accounting system
- Year-over-year comparisons break because account names and categories changed
- Your SaaS, agency, or e-commerce KPIs require spreadsheet work to calculate
Frequently asked questions
How many accounts should I have
Use the minimum number of accounts needed to answer management questions accurately.
For many companies in the $500K to $20M range, that means keeping the general ledger tighter than founders expect and using classes, departments, locations, or tags for added detail. A SaaS company may need separate accounts for subscription revenue, implementation revenue, and cost of service delivery. It usually does not need a different expense account for every software tool. An agency may need labor separated from pass-through media and contractors. It usually does not need ten flavors of client delivery expense. An e-commerce brand may need clean buckets for product revenue, discounts, returns, shipping income, merchant fees, and fulfillment costs. It does not need a new account every time a channel launches a promo.
If your team cannot explain why an account exists, merge it.
When should you overhaul your COA
Overhaul it as soon as reporting stops matching how the business is run.
The common triggers are predictable. You launched a second revenue stream. You added inventory. You started selling across Shopify, Amazon, and wholesale. Your board now asks for department-level spend. Your investors want recurring revenue, gross margin by line, or burn multiple, and your accounting system cannot produce those numbers cleanly.
Do it before fundraising, before an audit, and before a system migration. Cleanup gets slower and more expensive once bad history piles up.
Can you use a generic online template
Use a template as a starting point only.
Generic COAs are built for basic bookkeeping. They are not designed for SaaS revenue recognition, agency utilization and delivery margin, or e-commerce clearing accounts for Shopify, Stripe, refunds, and payouts. If you stop at the template stage, your reporting will stay generic too.
Should you use account numbers or just names
Use account numbers.
They keep the ledger organized, make hierarchy easier to manage, and reduce the odds that someone creates duplicate accounts with slightly different names. That matters more once you have multiple people posting entries or you are preparing to move beyond a starter QuickBooks file.
Should you keep adding sub-accounts for every new need
Usually no.
First decide whether the detail belongs in the COA or in a dimension like class, department, location, customer, or product line. If leadership wants to compare sales and marketing spend by function, use departments. If they want margin by service line, use a reporting structure that supports that analysis consistently. Keep the COA stable enough that period comparisons stay clean.
Is this a set-it-and-forget-it project
No.
Review the COA at least annually, and review it faster during periods of change such as new product launches, acquisitions, inventory expansion, or fundraising prep. A strong COA should evolve on purpose, not drift through a year of ad hoc edits.
Your Next Step Toward Investor Ready Financials
Your chart of accounts is not an administrative checklist. It’s the framework that decides whether your numbers are usable.
If your COA is structured well, you get cleaner revenue reporting, better cash visibility, tighter KPI dashboards, and financial statements that hold up under diligence. If it’s structured poorly, every report downstream becomes harder to trust.
What you should do next
- Export your current COA today: Don’t guess. Look at the actual account list.
- Flag the obvious problems: Generic revenue buckets, unclear expense groupings, duplicated accounts, and weak balance sheet structure.
- Design a future-state version in a spreadsheet: Start with reporting needs, not software defaults.
- Map the COA to leadership questions: Revenue drivers, margin, burn, and cash should all tie back to the ledger.
- Clean up before fundraising or audit prep: Waiting makes the project slower, riskier, and more expensive.
My advice as a fractional CFO
If you’re between $500K and $20M in revenue and still relying on a starter COA, fix it now. Don’t wait for your next board meeting, tax deadline, or diligence request to expose the problem.
Good companies outgrow bad accounting structures all the time. Strong finance teams catch that early and rebuild the foundation before growth turns the mess into a liability.
If you want help turning a messy QuickBooks, Xero, or NetSuite setup into investor-ready reporting, talk to Jumpstart Partners. They work with growing SaaS, agency, and service businesses to clean up books, redesign chart of accounts structures, and build reporting that leadership can use.