Financial Operations
Monthly Financial Reporting: Guide to Investor-Ready Finance
Master your finances with our guide to monthly financial reporting. Get processes, KPIs, and tools to build an investor-ready finance function.
ByJumpstart Partners, CPA, QuickBooks ProAdvisor
··20 min readYou're probably feeling this already. Revenue looks healthy, invoices are going out, and your checking account still makes you nervous. One month you feel flush. The next month payroll, tax payments, software renewals, and a few slow-paying customers make cash feel tighter than it should.
That's what weak monthly financial reporting looks like in a growing business. You have activity, but not clarity. Founders at $500K to $20M in revenue don't lose sleep because they lack transactions. They lose sleep because they can't reliably turn those transactions into decisions about hiring, pricing, client delivery, runway, and fundraising.
Professional reporting fixes that. Not by producing more spreadsheets, but by giving you a repeatable system that closes the books, reconciles the balances, explains the variances, and surfaces the handful of metrics that matter.
Table of Contents
- Why Your Bank Balance Is Lying to You
- Anatomy of an Investor-Ready Financial Package
- Your 5-Day Month-End Close Playbook
- The KPI Dashboard That Actually Drives Growth
- Red Flags Your Monthly Reporting Is Broken
- Build a Financial Engine Not a Manual Checklist
- Take Control of Your Financial Future
Why Your Bank Balance Is Lying to You
It is the 3rd of the month. The bank account shows $420,000, so the team feels fine. Then payroll clears for $95,000, annual insurance hits for $24,000, sales tax is due, and $140,000 of that cash came from prepaid customer contracts you have not earned yet. The number in the bank was real. The conclusion you drew from it was wrong.
Bank balances are useful for one job: checking near-term liquidity. They are weak at showing operating performance. They do not tell you whether cash is tied to deferred revenue, whether expenses belong to this month or the next, whether receivables are aging badly, or whether margin slipped while collections happened to be strong.
That gap creates expensive mistakes. Founders approve hires after a wave of annual renewals. They raise ad spend because deposits came in. They assume the business is profitable because cash went up, even though implementation costs, payroll accruals, and credit card liabilities have not been fully recorded.
For a growing SaaS or services firm, that is the difference between bookkeeping and a reporting system. Amateurs watch the checking account. Professionals separate cash timing from economic reality, then close the books fast enough to use the result.
What your bank account misses
- Revenue timing: A customer can pay $36,000 upfront in January for a 12-month contract. Cash arrives once. Revenue is recognized over the service period.
- Expense timing: An annual software invoice may hit cash in one month, but the cost should be spread across the year to show the monthly operating picture.
- Obligations: Payroll taxes, contractor bills, credit card balances, accrued bonuses, and deferred revenue can sit below the surface while the bank balance still looks healthy.
- Collection risk: A solid top-line month on the P&L means little if receivables are slow and cash conversion is getting worse.
Practical rule: If your monthly review starts and ends with online banking, you are monitoring cash, not managing the business.
Small reconciliation errors make this worse. A duplicated deposit inflates revenue. An uncategorized fee distorts margin. A transfer posted as income makes performance look stronger than it is. After a few months, leadership is making decisions off numbers that are directionally wrong. If your team is still handling bank statement discrepancies, fix that before you trust any dashboard. For a cleaner close process, set a standard method for reconciling bank accounts properly.
What reliable monthly financial reporting changes
A disciplined monthly close gives management a repeatable answer to four questions: what happened, why it happened, whether it matched plan, and what needs to change next. That is the system founders need once the business has enough volume, contracts, headcount, and complexity to make cash timing misleading.
The payoff is judgment. You stop asking, "Do we have money?" and start asking:
- Are we producing cash from operations or living on prepayments?
- Which variances were timing issues, and which signal a real margin problem?
- Is hiring ahead of revenue capacity?
- Can we fund growth without compressing runway?
Professional reporting does not produce more spreadsheets. It produces decision-useful intelligence on a fixed cadence, with enough speed to act and enough accuracy to trust.
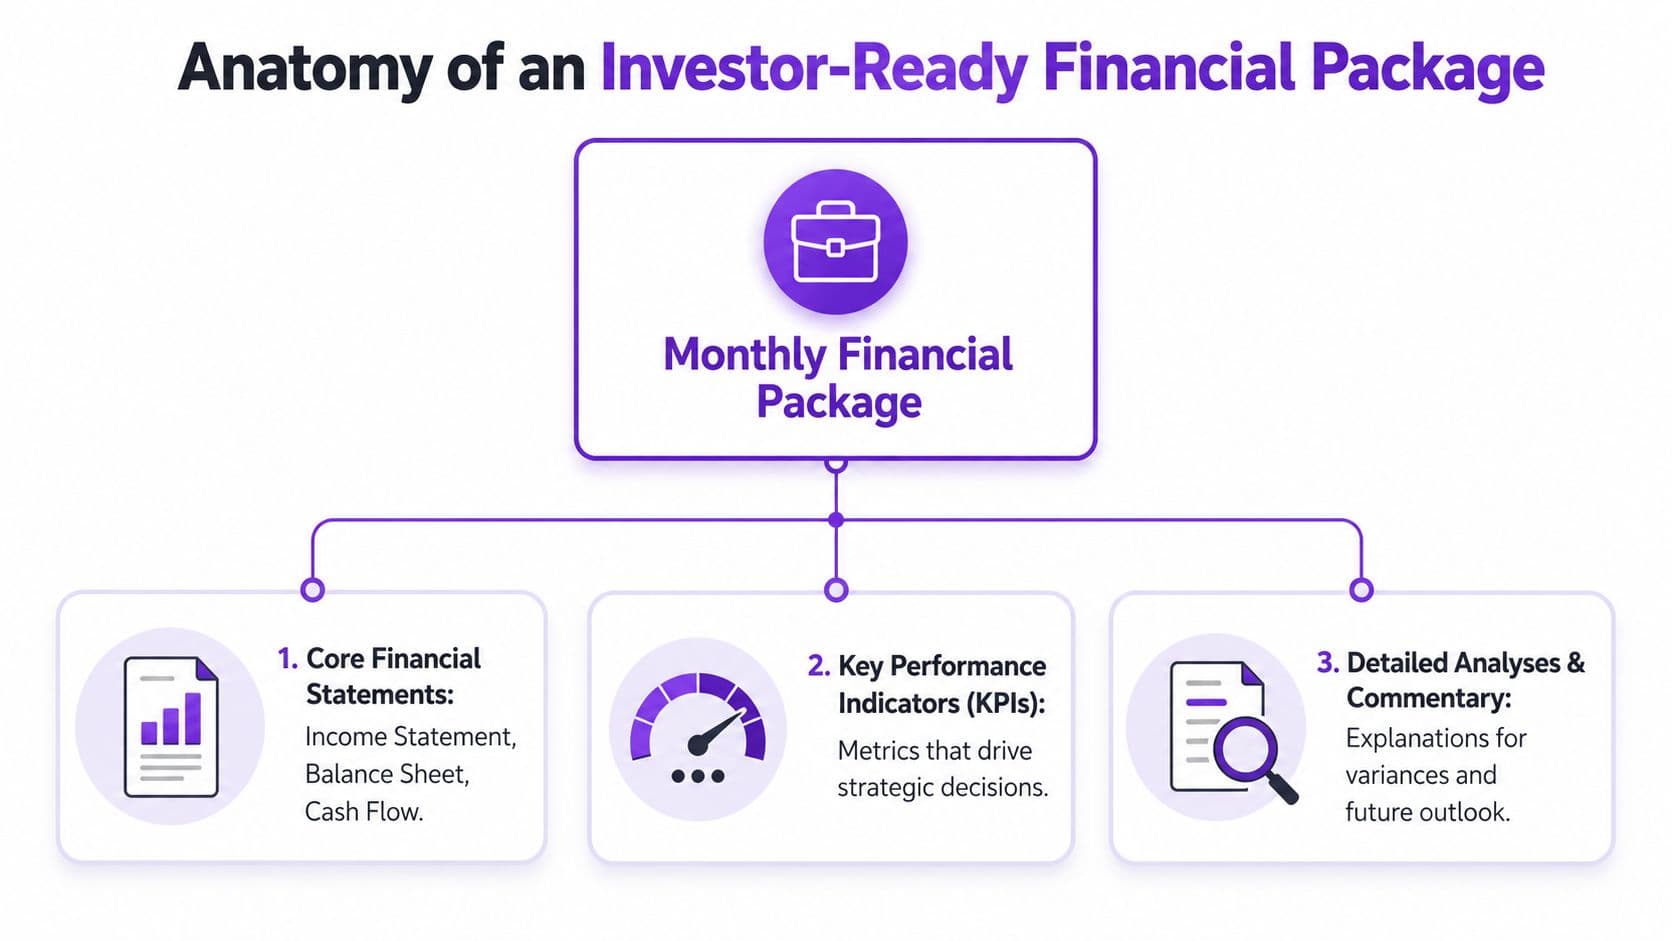
Anatomy of an Investor-Ready Financial Package
An investor-ready package is not a lonely P&L emailed at the end of the month. It is a reporting set that shows performance, financial position, cash movement, and management judgment in one place.
A robust monthly reporting package must include three core financial statements, Budget vs. Actual comparisons, key financial KPIs, and bank reconciliations. It also needs an Executive Summary, a single-page view highlighting cash positions and operational headcount, as outlined in Jirav's monthly reporting package best practices.
The five pieces you actually need
| Component | What it shows | Why leadership needs it |
|---|---|---|
| Income Statement | Revenue, cost of revenue, operating expenses, profit or loss | Shows whether the business model is working this month and year to date |
| Balance Sheet | Assets, liabilities, equity | Shows what you own, what you owe, and whether the structure is healthy |
| Cash Flow Statement | Cash inflows and outflows | Explains why cash changed, which the P&L never does on its own |
| Budget vs. Actual | Planned vs. real performance | Forces accountability and reveals execution gaps |
| Executive Summary | Cash, KPIs, key movements, headcount | Lets founders and investors understand the month in one page |
A professional package also includes commentary. Numbers without explanation waste leadership time. If revenue missed plan, the report should say whether the issue came from churn, delayed implementation, pricing pressure, lower utilization, or slower sales conversion.
Amateur package versus professional package
| Amateur reporting | Professional reporting |
|---|---|
| Sends a P&L only | Delivers linked statements plus KPIs and commentary |
| Focuses on totals | Explains variances and operational drivers |
| Uses accounting labels only | Translates finance into business decisions |
| Arrives late | Arrives on a predictable cadence |
| Leaves questions open | Anticipates the questions leadership will ask |
Investors and lenders don't just evaluate your numbers. They evaluate whether you understand your numbers.
That matters if you're raising capital or preparing for debt. If financing is part of your plan, understanding the capital side matters too. Founders who are evaluating debt options should also understand choosing an SBA loan broker because reporting quality directly affects lender confidence and underwriting readiness.
The document most teams skip
The Executive Summary is where management reporting becomes useful. It should fit on one page and answer, at minimum:
- What happened this month
- What changed from budget
- What changed from the prior period
- What risks need attention now
- What decisions leadership should make next
If you want a practical layout, these financial reporting package examples are a good model for what a real management package should contain.
A founder should be able to read the first page and know whether the company is on plan, off plan, or hiding a problem.
Your 5-Day Month-End Close Playbook
It is the third business day of the month. The founder wants last month's numbers before the board packet goes out. Sales says bookings were strong. Operations says margins slipped. The controller is still chasing missing invoices and an unreconciled credit card account. That is what a weak close looks like. The issue is not effort. The issue is the absence of a system that balances speed, accuracy, and review discipline.
A reliable close produces the same result every month. Inputs arrive on schedule, judgment calls happen before day five, and leadership gets a package they can use for decisions instead of a stack of reports they have to decode. If the process depends on memory, heroics, or one person staying online late, it will break as volume grows.
What happens on each day
| Day | Key Tasks | Objective |
|---|---|---|
| Day 1 | Lock prior-period operational inputs, import bank and card activity, confirm invoicing and billing completion | Confirm the month is complete before accounting starts |
| Day 2 | Post accruals, review payroll, record prepaid and deferred items, reconcile cash and credit cards | Build an accurate general ledger |
| Day 3 | Reconcile accounts receivable, accounts payable, loans, and other balance sheet accounts | Remove unsupported balances and catch posting errors |
| Day 4 | Generate P&L, balance sheet, and cash flow statement. Run budget and prior-period variance review | Convert booked activity into management reporting |
| Day 5 | Final review, management commentary, executive summary, distribution to leadership | Deliver a package leadership can trust |
The sequence matters.
Teams that skip straight to the P&L usually end up discussing noise. A professional close starts with completeness, then accuracy, then analysis. If billing is incomplete on day one, accruals are sloppy on day two, or deferred revenue is wrong on day three, every metric discussed on day four is suspect.
The operating rules that keep the close clean
A checklist helps. Clear accountability matters more.
- Assign one owner per task: "Finance team" is not an owner. Use a name.
- Set a hard cutoff for inputs: Late invoices, payroll corrections, and contract changes need a documented rule for whether they hit this month or next.
- Require support for every balance sheet account: If prepaid expenses, accrued liabilities, or deferred revenue cannot be tied to detail, the close is still open.
- Review unusual variances before leadership sees the package: The meeting should focus on decisions, not basic error detection.
- Use a second reviewer: Someone should challenge accrual logic, revenue cutoffs, classifications, and reconciliations before release.
I see the same trade-off every month. Founders want numbers fast, and finance wants numbers right. The answer is not to pick one. The answer is to design a close where repetitive work happens during the month, so the five-day window is reserved for judgment, reconciliation, and review. A more detailed set of month-end close best practices for finance teams can help formalize that cadence.
One more point gets missed in growing companies. Your reporting system should align with how leadership runs the business. If department heads manage to OKRs while finance reports only on budget lines, meetings get messy and accountability gets fuzzy. Teams that need to understand OKRs and KPIs effectively should make that alignment part of the close design, not an afterthought in the board deck.
The revenue timing error that distorts SaaS reporting
SaaS companies trip over one issue more than any other. They treat collected cash as earned revenue.
If a customer pays $12,000 upfront for a 12-month subscription, the cash hits now, but the revenue is earned over the service period. The monthly close needs to reflect that reality or the financial package becomes misleading.
Here's the worked example:
| Item | Month 1 | Months 2-12 |
|---|---|---|
| Cash received | $12,000 | $0 |
| Revenue recognized | $1,000 | $1,000 each month |
| Deferred revenue liability | $11,000 after Month 1 | Declines by $1,000 each month |
Book the full $12,000 to revenue in month one and the damage is immediate. Gross margin looks better than it is. Sales efficiency appears stronger because revenue is overstated. The next eleven months look weaker, even if customer performance is steady. That affects compensation plans, hiring decisions, pricing analysis, and board credibility.
Amateur reporting treats this as an accounting technicality. Professional reporting treats it as a control point. The close should catch timing errors before they flow into KPI discussions, forecast updates, or lender conversations.
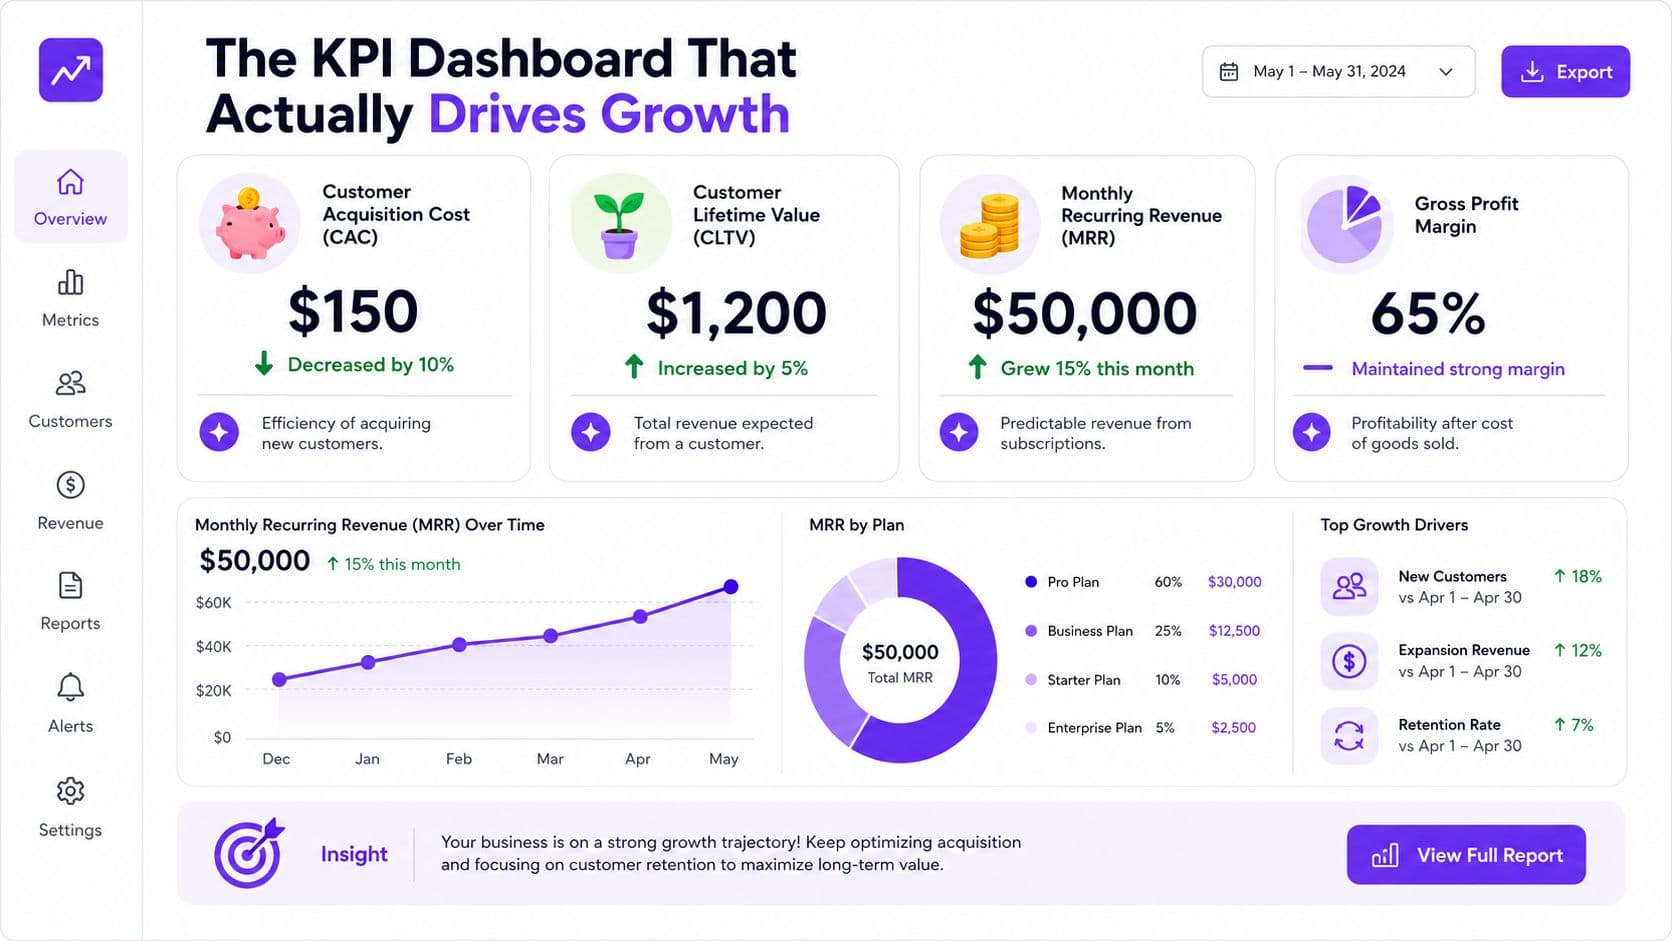
The KPI Dashboard That Actually Drives Growth
A founder reviews the month, sees revenue up, cash still tight, and asks the team to push harder on sales. Two months later, churn rises, services margins slip, and collections lag. The problem was not effort. The problem was a dashboard that reported totals without showing which operating levers were working and which were failing.
Financial statements show results. A KPI dashboard should explain what management needs to change next, and what trade-off comes with that choice.
For SaaS companies
A useful SaaS dashboard ties the accounting close to unit economics. That means monthly recurring revenue, gross margin, retention, customer acquisition efficiency, burn, and runway, with clear definitions that do not change every quarter.
Start with revenue quality, not just revenue volume.
Worked example 1. MRR from an annual contract
Using the ASC 606 example above, a $12,000 annual contract contributes $1,000 of recognized revenue per month. If you sign five contracts on the same terms in one month, those contracts contribute:
- 5 × $1,000 = $5,000 of monthly recognized revenue
That does not mean your MRR metric should blindly mirror revenue recognition. In many SaaS businesses, MRR is tracked from contracted recurring value while GAAP revenue is recognized over the service period. Both numbers matter. One helps run the business. The other keeps the financial package accurate. Amateur reporting mixes them together. Professional reporting defines both, reconciles them, and explains the gap.
The same discipline applies to retention. High Alpha's SaaS Benchmarks analysis referenced by Kayako highlights why Net Revenue Retention deserves a permanent spot on the dashboard. If NRR falls from 108% to 96%, the issue is not a small percentage change. It usually means expansion has slowed, churn has increased, or discounting is covering up weak product adoption. Each cause leads to a different operating response.
A SaaS dashboard should answer questions like these every month:
- Is new ARR growth coming from efficient channels or expensive ones?
- Is gross retention stable by cohort?
- Are expansion dollars offsetting churn, or are you buying growth with sales spend?
- How many months of runway remain at the current burn rate?
- Which metric moved because of one-time timing noise, and which moved because the business changed?
If your leadership team still blends company health metrics with project goals, it helps to understand OKRs and KPIs effectively. KPIs monitor operating performance. OKRs define the changes the team is trying to produce.
For agencies and professional services
Services firms need a different reporting lens because revenue can rise while delivery margin falls. A clean P&L rarely shows that fast enough on its own.
Track operating metrics next to the statements:
- Client-level profitability: Revenue minus direct labor, contractor costs, and delivery-specific expenses by account
- Utilization: Percentage of available team hours spent on billable work
- Realization: Percentage of delivered work that is invoiced and collected at the expected rate
- Revenue concentration: Share of revenue tied to the top three or five clients
- Cash conversion: Time from work performed to invoice sent to cash received
Here is the trade-off founders often miss. Higher utilization can improve short-term margin, but if it stays too high for too long, delivery quality drops and churn follows. Lower utilization can be acceptable if it reflects deliberate bench capacity ahead of signed work. Context matters. The dashboard should make that visible.
Leading indicators belong on the same page as lagging ones. Revenue and EBITDA are lagging. Pipeline conversion, backlog quality, delivery delays, scope creep, DSO, and churn signals are leading. If the dashboard only shows last month's totals, leadership reacts late.
For CEOs who want a clearer operating view, these financial dashboards for CEOs and key metrics show how to connect finance data to decisions instead of reporting totals alone.
Red Flags Your Monthly Reporting Is Broken
Monday, 9:00 a.m. The leadership team is reviewing last month's numbers. Revenue looks strong, cash feels tight, and two executives are using different versions of the same metric. That is not a presentation problem. It is a reporting system problem.

The most dangerous reporting package is the one that looks polished but falls apart under routine questions. If leadership asks why gross margin dropped 4 points, why deferred revenue moved, or why cash missed forecast by $180,000, the finance team should have a clear answer the same day. If it takes a week of Slack threads and spreadsheet edits to get there, the close is producing output, not decision-ready reporting.
Broken reporting usually shows up in a few repeatable ways:
- Reports are consistently late: The team is finding issues during the close instead of preventing them before month-end.
- Cash and the P&L tell different stories: Revenue may be booked correctly while collections, prepaids, accruals, or deferred revenue are not being handled with discipline.
- Variance explanations are weak or missing: “We need to look into it” is not an acceptable answer for a material movement.
- Balance sheet accounts lack support: If AR, deferred revenue, payroll liabilities, or accrued expenses do not tie to schedules, the numbers are exposed.
- “One-time” cleanup entries happen every month: Recurring fixes point to a bad upstream process, not bad luck.
- The package depends on one person's memory: If only one controller or bookkeeper knows how the numbers come together, the process will break under growth or turnover.
Professional reporting is not defined by clean formatting. It is defined by whether the package can survive scrutiny. A founder should be able to ask, “Why did EBITDA beat plan by $60,000 but operating cash miss by $90,000?” and get a plain-English answer that ties back to working capital, billing timing, or expense accruals.
One of the most expensive founder mistakes is asking for “directionally correct” reporting. That standard sounds efficient. It usually creates rework, bad hiring decisions, and false confidence. If a services firm capitalizes expenses inconsistently, margin looks better than reality. If a SaaS company misses a revenue cutoff, MRR trends can look healthier than they are. Small classification and timing errors turn into large operating mistakes when leaders use them to set headcount, commission plans, and burn targets.
The trade-off is real. Faster reporting matters. So does accuracy. But speed without controls creates noise, and accuracy without useful commentary creates delay. The goal is a reporting system that closes fast enough to be useful and clean enough to support decisions. That usually means standard reconciliations, named owners, review checkpoints, and a package built from the same logic every month. Teams that want to reduce manual failure points should tighten the process before the close starts with financial reporting automation workflows and controls.
A short video overview can also help your team spot weak close habits before they become routine:
Bad reporting rarely fails all at once. It fails in smaller ways first. A board deck gets revised the night before the meeting. Forecast accuracy slips. Cash surprises show up two weeks too late. By the time everyone agrees the process is broken, the company has already made decisions on numbers it should not have trusted.
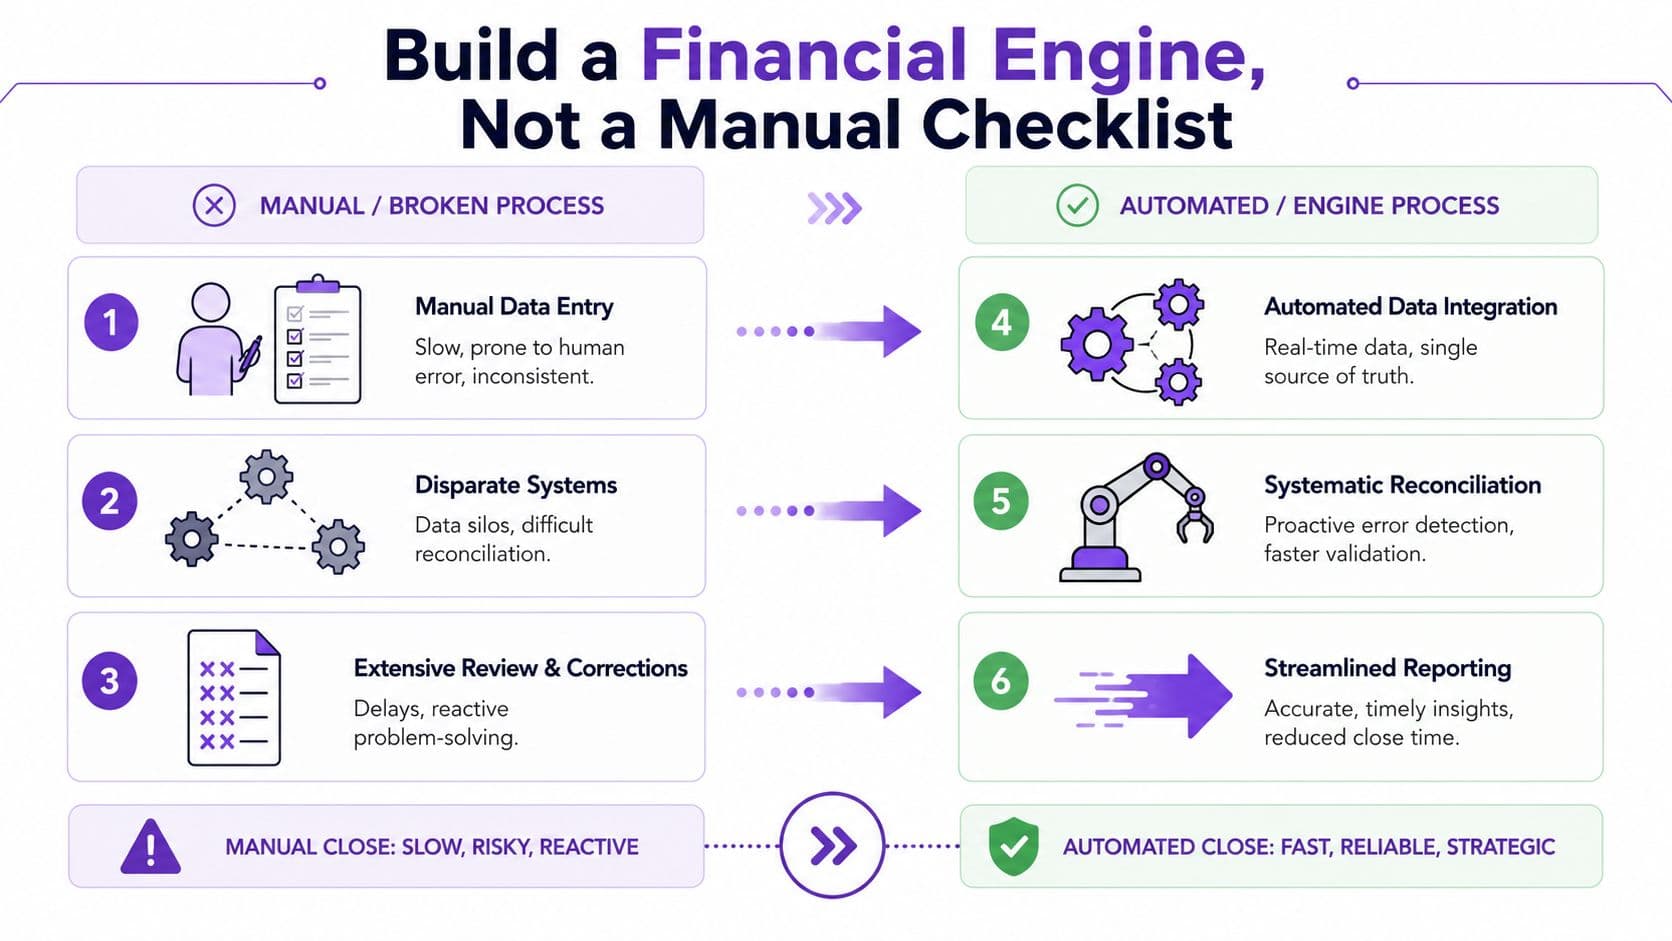
Build a Financial Engine Not a Manual Checklist
A checklist is necessary. It is not sufficient.
Manual closes break when volume rises, systems multiply, and one person becomes the keeper of all the tribal knowledge. That's exactly when founders start pushing for a five-day close and finance teams start cutting corners to keep up.
Why fast closes fail
Data shows 55% of firms attempting a 5-day close without automated reconciliation report a 20% increase in month-end errors, and speed without SOC 2-aligned automation leads to a 40% higher risk of audit findings. That trade-off gets ignored when leaders chase speed as the headline metric.
The answer isn't to slow everything down. The answer is to build a reporting engine that reduces manual handling before the close begins.
A broken setup usually looks like this:
| Broken process | What happens |
|---|---|
| Data sits in Stripe, Shopify, Gusto, spreadsheets, and the bank | Finance spends time collecting instead of reviewing |
| Transactions are posted manually | Errors creep in through classification and timing |
| Reconciliations happen at month-end only | Problems stack up until the close window |
| Reporting depends on one person's memory | The process becomes fragile and hard to scale |
What an actual reporting engine looks like
A stronger model connects source systems to the accounting platform and standardizes review.
- Integrate core platforms: Stripe, Shopify, Gusto, QuickBooks, Xero, and NetSuite should not live in separate worlds.
- Reconcile continuously: Don't wait until month-end to discover missing deposits or duplicated expenses.
- Use controlled templates: Executive summaries, variance reviews, and balance sheet support should follow the same structure every month.
- Run a post-mortem after close: Note what broke, what delayed the process, and which accounts caused rework.
One practical option for teams that need help building that system is financial reporting automation. Firms such as Jumpstart Partners use integrated workflows across accounting, payroll, billing, and reporting systems to reduce manual close work and tighten control over reconciliations.
The best close process is boring. Data flows in predictably, exceptions get flagged early, and finance spends its time reviewing instead of rebuilding.
That's the distinction between a manual checklist and a financial engine. One depends on effort. The other depends on design.
Take Control of Your Financial Future
If you're still managing from the bank balance, you're operating with partial information. That works for a while. It stops working when revenue grows, teams expand, and outside stakeholders start asking harder questions.
Strong monthly financial reporting gives you a reliable close, an investor-ready package, and a dashboard that tells you what to do next. Build the system now, before the next hire, raise, audit, or cash squeeze forces the issue.
If you want help building a reporting system that closes cleanly, produces decision-useful numbers, and supports fundraising, audits, and cash planning, talk to Jumpstart Partners. They work with growing SaaS, agency, and service businesses that need outsourced controller and bookkeeping support without building a full in-house finance team first.