Financial Operations
The CEO's Guide to a Credible Projection of Sales
Learn to build a reliable projection of sales and forecast revenue with confidence—attract investors and accelerate growth.
ByJumpstart Partners, CPA, QuickBooks ProAdvisor
··20 min readAn accurate projection of sales should be your financial roadmap for growth. Yet, for most founders, it's a source of constant anxiety. When a projection is wrong, it’s not a minor miscalculation. It’s the kind of strategic error that leads to cash flow crises, missed hiring opportunities, and a complete loss of investor confidence. You can't run a multi-million dollar business on wishful thinking. You need a defensible model that connects your team's daily activities to your top-line revenue goals.
Why Your Sales Projection Is Probably Wrong (And How to Fix It)
If you're a founder or CEO in the $500K-$20M revenue range, you've lived this scenario: you build a sales projection that looks perfect on a spreadsheet, only to watch it fall apart by the second quarter. This isn't a personal failing—it's a structural one. Most growing businesses treat forecasting as a high-level financial exercise instead of what it really is: your single most critical operational tool.
An inaccurate forecast isn't just about missing a number. The consequences are real and painful:
- Cash Flow Crises: You hire three new account executives based on projected revenue, but when a few key deals slip, you suddenly can't make payroll.
- Wasted Marketing Spend: Marketing hits its lead targets, but the sales team can't convert them, exposing a massive disconnect between your model and reality.
- Lost Credibility: You present a "hockey stick" growth curve to your board and then miss the targets badly. That erodes the trust you need to lead effectively.
The Misconception: Top-Down "Wishcasting"
The fundamental mistake we see almost every time is a reliance on a purely top-down forecast. This is the method where you start with a huge market size (your Total Addressable Market), assume you'll capture a tiny percentage, and work down to a revenue number. It's great for a big-picture vision in a pitch deck, but it’s operationally useless for running your company.
A top-down forecast tells you what you want to achieve but says absolutely nothing about how you'll get there.
The solution is to ground your projections in reality with a bottom-up approach. This method builds your forecast from the ground up, based on controllable inputs: the number of reps you have, their quotas, their historical conversion rates, and your average deal size.
By shifting your perspective, your sales projection becomes more than a guess—it becomes a plan. It forces you to scrutinize every stage of your sales process and align your sales, marketing, and finance teams around a single, measurable objective. This alignment is what separates businesses that react to problems from those that proactively drive growth.
Understanding the gap between your planned forecast and actual results is the first step. For more on this, check out our guide on analyzing your actuals vs. budget performance.
Top-Down vs. Bottom-Up: Building a Projection You Can Trust
Every founder has a big revenue number in their head. But the accuracy of your sales projection—and its usefulness for running the business—comes down to how you arrive at that number. You have two choices: top-down or bottom-up. One is a great vision for a pitch deck; the other is the only way to build an operational plan you can actually execute.
The Problem with Top-Down Forecasting
The top-down model is the classic “big idea” forecast. It starts with a massive Total Addressable Market (TAM), assumes you’ll capture a tiny sliver of it, and works down to a revenue target.
For instance, if the global market for your product is $10 billion, you might project capturing just 0.1% of it. Voilà, you have a $10 million revenue goal.
While this looks great on a slide, it’s fundamentally useless for running your business. It’s a vision, not a plan. It tells you what you want to achieve but offers zero guidance on how you’ll get there. Who is going to sell this? How many leads do you need? What’s your cost to acquire each customer? A top-down forecast ignores every single one of these operational questions. It’s built on hope, not reality.
Why Bottom-Up Projections Are The Only Credible Model
For any business with actual revenue and a sales team, the bottom-up approach is the only credible way forward. Instead of starting with an abstract market size, you build your forecast from the ground up, using the real-world constraints and capabilities of your sales engine.
A bottom-up forecast is built from concrete, measurable inputs you already have:
- Sales Team Capacity: How many quota-carrying account executives (AEs) do you have?
- Individual Quotas: What is the annual or quarterly target for each AE?
- Historical Performance: What’s the average quota attainment rate across your team?
- Ramp-Up Time: How long does it take a new sales hire to become fully productive?
This method forces an honest conversation about your sales capacity. If your revenue goal requires more deals than your team can physically close, the model will expose that gap immediately.
"A bottom-up forecast is the litmus test for your strategy. If the math doesn't work on the spreadsheet, it’s not going to work in the market. It forces an honest conversation about what’s actually achievable with the resources you have." — Jason Lemkin, Founder of SaaStr
Worked Example: A Bottom-Up SaaS Forecast
Imagine you run a SaaS company aiming for $1M in new Annual Recurring Revenue (ARR) next quarter. Your team consists of 5 account executives.
Here are your key inputs, based on historical data from your CRM:
- AE Quarterly Quota: $250,000 in new ARR
- Historical Quota Attainment: Your team consistently hits 80% of their quota on average. Some reps hit 120% and others 60%, but the team-wide average is a reliable 80%.
Now, let's do the math.
-
Calculate Total Team Quota:
5 AEs × $250,000/AE = $1,250,000in total team quota for the quarter. -
Apply Historical Attainment:
$1,250,000 (Total Quota) × 80% (Attainment Rate) = $1,000,000in projected new ARR.
In this scenario, your bottom-up projection lines up perfectly with your $1M quarterly goal. It’s a defensible forecast because it’s grounded in the proven capacity of your sales team. If the projection had come out to $800,000, you would know instantly that hitting your goal requires action. You either need to improve your attainment rate, generate more qualified leads for the team, or hire another rep to close the gap.
This is the real power of a bottom-up model: it transforms your sales projection from a guess into an invaluable management tool.
Comparing Top-Down vs. Bottom-Up Sales Projection Methods
| Attribute | Top-Down Forecasting | Bottom-Up Forecasting |
|---|---|---|
| Starting Point | Total Addressable Market (TAM) | Sales team capacity & historical performance |
| Approach | "What if we capture X% of the market?" | "What can our team realistically sell?" |
| Primary Use Case | Investor pitch decks, market sizing | Operational planning, budgeting, quota setting |
| Pros | - Shows big-picture potential - Quick to calculate - Good for early-stage vision setting | - Highly accurate and defensible - Tied to operational reality - Identifies resource gaps - Creates accountability |
| Cons | - Divorced from operational reality - Ignores execution constraints - Often wildly optimistic | - Requires clean historical data - More time-intensive to build - Can be overly conservative if not forward-looking |
| Best For | Pre-revenue startups, market research | Any business with a sales team ($500K+ revenue) |
Ultimately, investors and boards want to see both. The top-down number shows the size of the prize, but the bottom-up forecast proves you have a credible plan to win it. For running your company day-to-day, only the bottom-up model gives you the clarity you need.
To dive deeper into the nuances of these approaches, you can explore more on different sales forecasting methods and how they apply to various business models.
Building Your Bottom-Up Sales Model with Real Numbers
A bottom-up forecast is where your sales projections stop being aspirational and become a real operational tool. It’s how you translate your team’s daily grind—the calls, demos, and proposals—into a revenue number you can actually stand behind.
This isn’t about guesswork. It’s about building a mathematical model of your sales engine, piece by piece. Your model is only as good as the data you feed it, which is why strong sales pipeline management best practices are a non-negotiable starting point.
Gathering Your Core Inputs
Before you open a spreadsheet, you must pull specific, historical data that drives your sales engine. Your first job is to get this right.
Here are the most critical inputs:
- Historical Sales Data: Go beyond just top-line revenue. You need sales broken down by rep, product or service line, and customer segment for the last 12-24 months.
- Pipeline Velocity: How fast do deals actually move from one stage to the next? Your average sales cycle length is a crucial reality check.
- Lead-to-Close Conversion Rate: What percentage of qualified leads really become paying customers? This metric connects your marketing spend directly to revenue.
These numbers are the foundation of a credible forecast. If your CRM is a disaster, your first task is to clean it up.
Worked Example: A Professional Services Firm
Let’s build a projection for a digital agency with 10 billable consultants. The goal is to forecast revenue for the next quarter, focusing on resource utilization.
Here are your inputs:
- Total Billable Consultants: 10
- Standard Billable Hours Per Week: 40
- Target Utilization Rate: 85% (the real-world percentage of time consultants spend on client work)
- Average Blended Billable Rate: $175/hour
First, calculate the total potential hours your team has available for the quarter.
10 consultants × 40 hours/week × 13 weeks/quarter = 5,200 total available hours
Next, apply your utilization target. No one is 100% billable. 85% is a healthy, realistic target.
5,200 available hours × 85% utilization rate = 4,420 target billable hours
Finally, multiply those billable hours by your average rate to get your baseline revenue projection.
4,420 billable hours × $175/hour = $773,500 in projected quarterly revenue
This $773,500 is now your baseline forecast. From here, you can layer in new projects from the sales pipeline by estimating their required hours and adding that to your total. It gives you a clear, utilization-driven target that the whole team can understand.
"The most common forecasting mistake I see is a failure to pressure-test assumptions. A founder will say, 'We'll increase our close rate by 5%,' but can’t explain how. A strong forecast models the why behind the numbers—more leads, a new pricing tier, shorter ramp time—not just the outcome." — David Skok, General Partner at Matrix Partners
Advanced Modeling for SaaS MRR
For a SaaS business, the entire forecast revolves around Monthly Recurring Revenue (MRR). The gold standard here is a cohort-based model because it tracks groups of customers over time and directly accounts for the unique dynamics of a subscription business: new sales, upgrades, and cancellations.
Building this model requires a few extra inputs:
- New MRR: The firehose of new revenue from customers acquired each month.
- Expansion MRR: The additional MRR from existing customers upgrading plans or adding seats. This is your most efficient growth lever.
- Churned MRR: The revenue you lose from customers who cancel.
Here’s a simplified cohort model for a SaaS company starting the quarter with $100,000 in MRR.
| Metric | Month 1 | Month 2 | Month 3 |
|---|---|---|---|
| Beginning MRR | $100,000 | $106,000 | $112,500 |
| New MRR | +$10,000 | +$11,000 | +$12,000 |
| Expansion MRR | +$2,000 | +$2,500 | +$3,000 |
| Churned MRR | -$6,000 | -$7,000 | -$7,500 |
| Ending MRR | $106,000 | $112,500 | $120,000 |
This table clearly lays out all the moving parts of your revenue engine. You can now build defensible assumptions for each driver. For example, you can model New MRR based on the number of account executives and their quotas, and model churn based on historical cohort data.
To get a head start, you can grab our dynamic Excel sales projection template and plug in your own numbers.
Connecting Your Projection to The Metrics That Drive Value
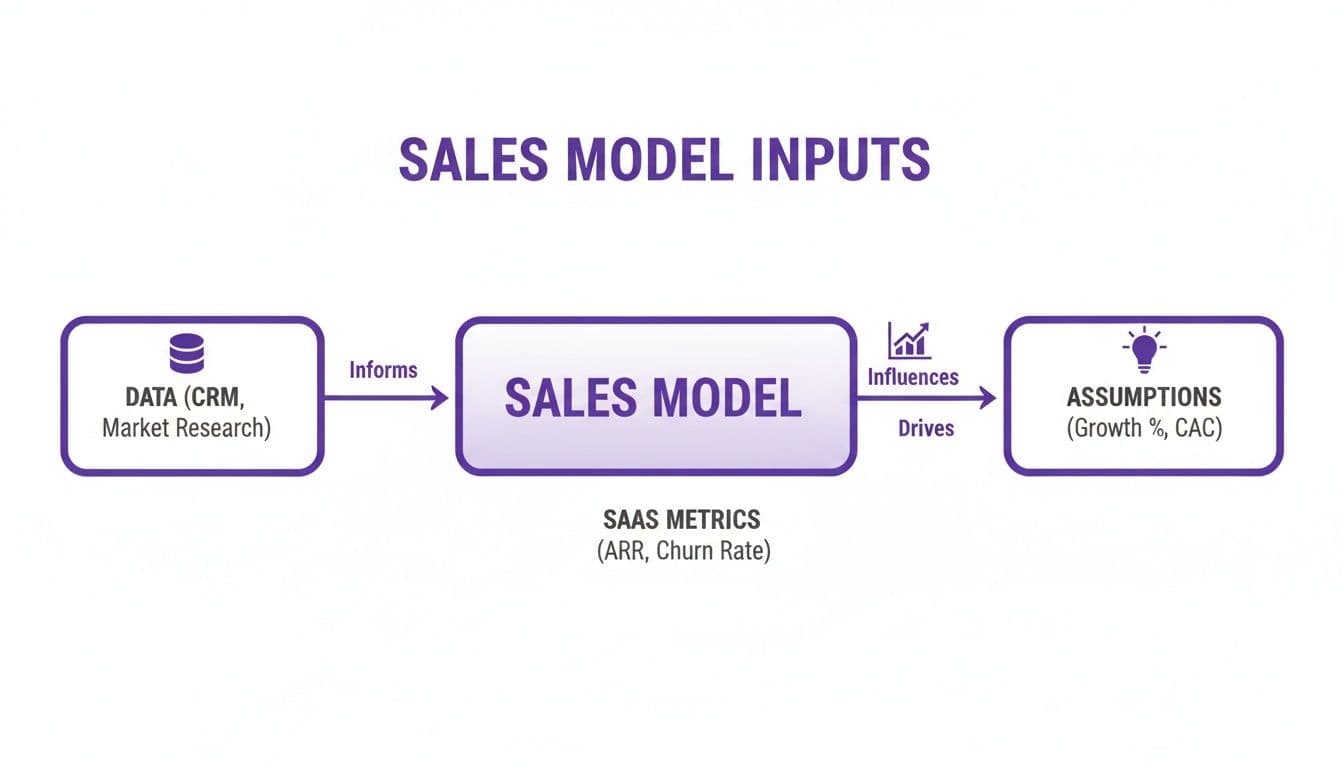
A sales projection built in a vacuum is just an academic exercise. For any SaaS or subscription business, your forecast only becomes a strategic tool when you connect it to the metrics that actually define your company's health: churn, Customer Acquisition Cost (CAC), and Lifetime Value (LTV).
Without these, your revenue model is completely blind. It doesn't see the forces that can either supercharge your growth or quietly bleed your company dry. Think of it like this: your CRM data is what happened, your SaaS metrics explain why it happened, and your assumptions predict what happens next. Fusing them together is what creates a reliable financial model.
Modeling Churn's Financial Impact
Churn is the quiet killer of SaaS growth. Even a tiny, seemingly insignificant increase in your revenue churn rate can completely blow up your projections over a year. Building it into your forecast isn't optional—it's essential for accuracy.
Let's see just how big the impact is. Imagine your company starts the year with $2,000,000 in Annual Recurring Revenue (ARR) and you're adding a solid $100,000 in new ARR every month.
Now, let’s see what happens with 1% monthly revenue churn versus 2%.
| Month | Scenario 1 (1% Churn) - Net New ARR | Scenario 2 (2% Churn) - Net New ARR |
|---|---|---|
| January | $80,000 | $60,000 |
| February | $80,800 | $61,200 |
| March | $81,608 | $62,424 |
| ... | ... | ... |
| Year-End ARR | $3,006,530 | $2,821,205 |
| Difference | -$185,325 |
That single percentage point difference costs you $185,325 in year-end ARR. This is exactly why your sales model needs a dynamic input for churn. A static growth number is a fantasy; real growth is a constant battle between new sales and the drag of lost customers.
Connecting CAC and LTV to Your Forecast
Your sales projection is also the driver behind the two most important metrics for proving scalability: Customer Acquisition Cost (CAC) and Lifetime Value (LTV). CAC tells you what you spend to get a customer, while LTV tells you how much profit you'll make from them.
A healthy LTV to CAC ratio is the ultimate signal of a sustainable business. According to OpenView's 2024 SaaS Benchmarks, a ratio of 3:1 is considered good, and anything 5:1 or higher is exceptional.
To model this, you must link your sales forecast directly to your expense budget.
-
Calculate Your CAC: Take your total sales and marketing spend for a quarter (salaries, commissions, ad spend, tools) and divide it by the number of new customers you won in that quarter.
- Example: You spend $150,000 on S&M and get 50 new customers. That’s a $3,000 CAC.
-
Calculate Your LTV: Divide your Average Revenue Per Account (ARPA) by your monthly revenue churn rate.
- Example: Your average customer pays $500 ARPA and your monthly churn is 1.5%. That gives you a $33,333 LTV.
In this scenario, your LTV/CAC ratio is an outstanding 11:1 ($33,333 / $3,000). By modeling these metrics, you can make much smarter calls about how much you can afford to spend on growth. For a deeper look, check out our guide to the SaaS financial metrics that matter.
Common Pitfalls and Red Flags in Sales Projections
A credible forecast isn't just about building the model; it's about pressure-testing it for the hidden flaws that can turn confidence into a cash-flow crisis. The most dangerous pitfall is unchecked optimism—assuming every deal closes on time, every new hire is a superstar from day one, and market conditions are always perfect. That's not a strategy. It’s a recipe for missing targets and losing credibility with your board, your team, and your bank.
Red Flags: Warning Signs of a Flawed Projection
When you present your forecast, your audience is actively hunting for signs of weakness. Here are the red flags that immediately erode their confidence:
| Red Flag | Why It's a Problem | How to Fix It |
|---|---|---|
| The Unexplained "Hockey Stick" | A sudden, sharp upward curve in revenue without a clear driver signals a forecast based on hope, not reality. | Tie your growth inflection directly to a funded initiative: a larger sales team, a new marketing channel, or a product launch. |
| Ignoring Sales Rep Ramp Time | Assuming a new hire will be fully productive from day one is a classic rookie mistake. | Build a 3-6 month ramp-up period into your model for each new AE, with quota attainment increasing gradually over that time. |
| Confusing Bookings with Revenue | Booking a $120K annual deal doesn't mean you have $120K in the bank. This confusion is a direct path to a cash flow crisis. | Maintain separate forecasts for bookings (sales performance) and recognized revenue (GAAP accounting) to manage cash flow accurately. Learn more about understanding ASC 606 revenue recognition. |
| Forgetting Seasonality | Most businesses have predictable peaks and valleys. Ignoring them guarantees you'll miss quarterly targets. | Analyze your last 24 months of sales data to identify seasonal trends and apply a seasonal index or multiplier to your baseline forecast. |
| Disconnect Between Revenue and Headcount | Projecting revenue to double while your sales and support headcount stays flat is not a credible plan. | Ensure your hiring plan and operational budget can support your revenue goals. If growth requires more people, that cost must be in the model. |
"Investors and boards are trained to spot lazy forecasting. They look for the 'hockey stick' growth that isn't tied to a specific, funded initiative like a new marketing channel or a sales team expansion. A projection without drivers is just a drawing." — Experienced SaaS Board Member
Actionable Next Steps: Turning Your Projection Into a Plan
A sales projection isn't a static document you build once and file away. It's a living, breathing management tool that should drive your entire business strategy—from hiring plans and marketing budgets to your next product launch.
Your next steps are clear:
- Build Your Bottom-Up Model: Use the worked examples in this guide as a template. Pull your historical data from your CRM and accounting system. Start with your sales team's capacity and build from there.
- Pressure-Test Your Assumptions: Go through the "Red Flags" table above. Does your forecast make any of these mistakes? Be brutally honest. It's better to correct a flawed assumption now than to explain a missed quarter to your board later.
- Set Departmental KPIs: Break down your top-line revenue target into operational metrics for each team.
- Sales: Set quotas based on the model's rep capacity and historical attainment.
- Marketing: Calculate the exact number of qualified leads needed to hit the sales team's quota. This is now their primary KPI.
- Finance: Create a parallel cash flow forecast based on your revenue projection and payment terms to manage liquidity.
- Establish a Monthly Review Cadence: Your forecast is only useful if it's current. Set a recurring meeting after your monthly financial close to compare actuals to your forecast and make adjustments.
Your sales projection is the single most important document for strategic planning. But building and maintaining an accurate, action-oriented forecast takes time and expertise that most founders simply don’t have.
Stop wrestling with spreadsheets and get the investor-ready financials you need to scale confidently. Our team of fractional CFOs can take this entire process off your plate. Schedule a consultation today to get the cash flow visibility required for your next stage of growth.
Frequently Asked Questions About Sales Projections
Even with a perfect model, the real work starts when you try to use it to run your business. Here are the straight answers to the questions founders and finance leaders always ask.
How Often Should I Update My Sales Projection?
For most businesses in the $500K-$20M range, the right rhythm is a monthly review and a quarterly re-forecast.
Your monthly financial close is the perfect time for a quick-glance update. See how you're tracking against the plan. This allows for small, immediate course corrections.
The full re-forecast happens quarterly. This is where you don't just tweak the numbers—you rebuild your projections for the rest of the year with everything you've learned. A major competitor launched, a key hire started late, a big deal slipped—all of this gets baked into the new forecast. Anything less frequent, and your forecast becomes a stale, irrelevant document.
What Are the Best Tools for a Growing Business?
You don't need a complex, six-figure enterprise forecasting platform. For the vast majority of businesses under $20M in revenue, the best tools are Microsoft Excel or Google Sheets.
The flexibility is the entire point. A spreadsheet lets you model the unique drivers of your business—your specific sales stages, your seasonality, your channel mix—without being boxed in by a rigid software's opinion of how a forecast should work.
The tool itself is far less important than the data you feed it. A well-structured spreadsheet running on clean, validated data from your CRM and accounting system will beat a fancy software platform running on garbage inputs every single time.
My sales cycle is long and unpredictable. How do I forecast?
For businesses with long or lumpy sales cycles (common in enterprise SaaS or professional services), a simple quota-based forecast is insufficient. You need to use a pipeline-based forecast.
This method involves assigning a probability to each deal in your pipeline based on its stage. For example:
- Deals in "Initial Discovery": 10% probability
- Deals in "Proposal Sent": 50% probability
- Deals in "Contract Negotiation": 90% probability
You then multiply the value of each deal by its probability to get a weighted forecast. This provides a more realistic picture of what's likely to close, smoothing out the lumps from a few large, unpredictable deals.
Building and maintaining an accurate sales projection takes time, focus, and expertise. Jumpstart Partners can take this entire process off your plate, delivering the investor-ready financials and cash flow visibility you need to scale with confidence. Get your custom finance plan today.