Financial Operations
A Founder-Approved Sales Projections Template
Download our founder-approved sales projections template to forecast revenue with confidence. Built for SaaS, agencies, and e-commerce.
ByJumpstart Partners, CPA, QuickBooks ProAdvisor
··20 min readFor founders, CEOs, and finance leaders running businesses between $500K and $20M in revenue, an ambiguous sales projection isn't a minor headache—it's a critical business risk. Without a reliable forecast, you can't hire with confidence, manage cash flow effectively, or make a compelling case for your next funding round. This isn't about gazing into a crystal ball; it's about building a predictable revenue machine.
Stop Guessing. Start Forecasting.

If your current sales forecast feels more like a wish than a plan, you’re not alone. Too many leaders rely on top-down goals handed down from a board meeting—numbers completely disconnected from the realities of their sales and marketing teams. This creates a massive gap between the financial plan and what your team can actually deliver, putting your targets and your credibility at risk.
A proper sales projection isn't just a number on a spreadsheet. It's a living model of your entire revenue engine. It must directly connect your marketing spend to lead volume, your sales activities to pipeline velocity, and your team’s capacity to your revenue targets.
"A great forecast tells a story backed by math. I don't just want to see your revenue goal; I want to see the assumptions that get you there—your lead velocity, conversion rates, and sales cycle. That's the difference between a plan and a prayer." - Ray Rike, Founder & CEO, RevOps
Your Forecast Must Answer Critical Business Questions
A powerful sales projections template isn’t a static document you create once a year. It’s the strategic tool you use to make confident decisions. It must answer the tough questions that determine your company’s future:
- Can we actually afford to hire two more account executives next quarter?
- Do we have enough pipeline coverage to hit our annual target, or are we in trouble?
- What happens to our cash runway if our lead conversion rate drops by 10%?
To get these answers, you need to go beyond simple guesswork and commit to a data-driven approach. This guide is your blueprint for turning your forecast from a document into your most valuable financial tool.
Getting the numbers down is just step one. The real insights come from comparing your forecast against actual performance. This is where you run a budget vs. actuals analysis. We’ll show you the exact inputs, formulas, and assumptions required to build a forecast that investors will trust—one backed by data, not just ambition.
Building Your Forecast from the Ground Up (Bottoms-Up)
The best sales forecasts aren’t handed down from on high—they’re built from the ground up. A bottoms-up, lead-based model is the engine room of a reliable forecast because it directly connects your marketing and sales activities to actual revenue. This approach transforms your sales projection from an abstract goal into a tangible operating plan.
You start with the inputs you can actually control, or at least influence, like website traffic, lead volume, and your sales team’s activity. This process forces a critical conversation between marketing, sales, and finance, making everyone accountable for the numbers that ultimately feed into the revenue projection.
For SaaS companies, digital agencies, and professional services firms scaling from $500K to $20M in revenue, this structured approach is a game-changer. It’s the difference between guessing and operating.
How to Build a Lead-Based SaaS Forecast
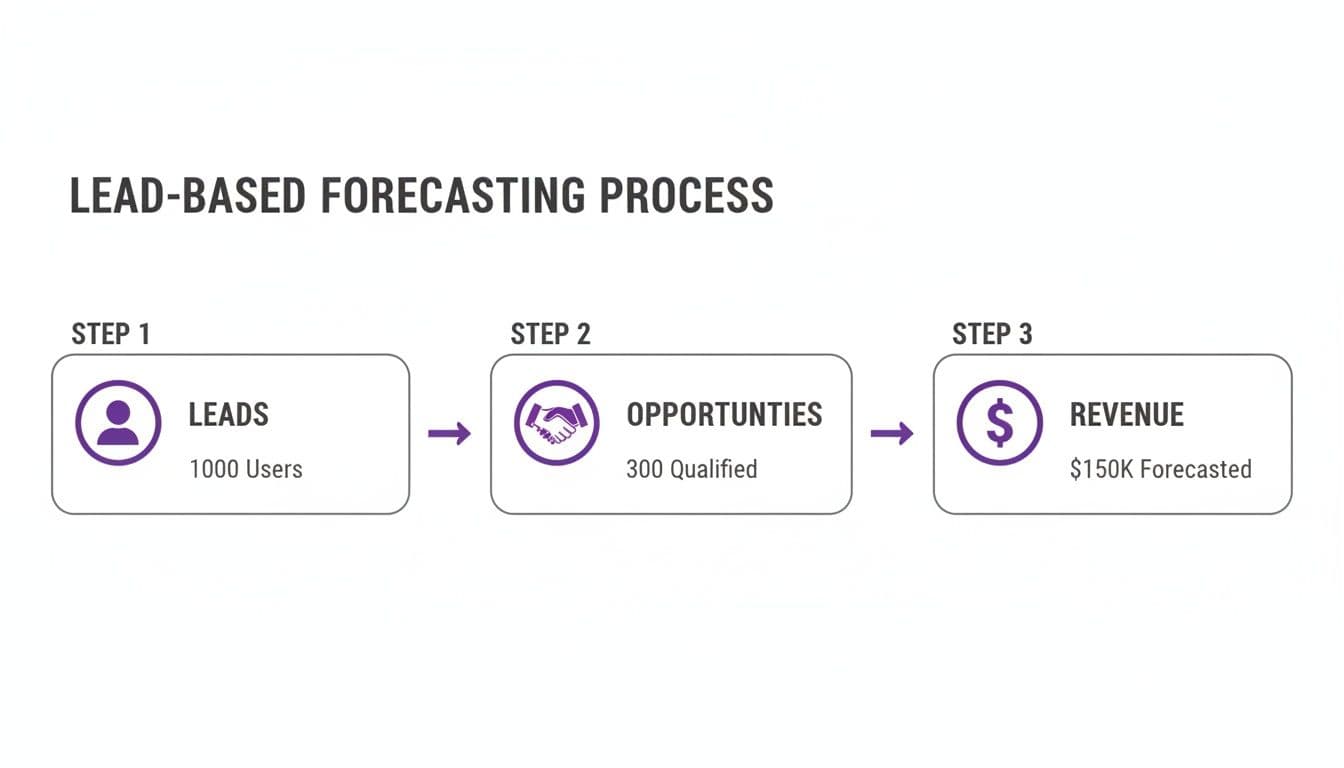
Let's walk through a concrete example for a B2B SaaS company. The goal here is to translate your marketing funnel metrics into a hard revenue number. Don't guess these numbers; pull them directly from your CRM (like HubSpot or Salesforce) and marketing automation platform. Your historical performance is your best guide.
Inputs for our example:
- Monthly Website Leads: 1,000
- Lead-to-Opportunity Conversion Rate: 5%
- Opportunity-to-Close Rate: 25%
- Average Contract Value (ACV): $50,000
With these inputs, we can build out a quarterly forecast.
Step 1: Calculate Monthly Opportunities
First, figure out how many qualified sales opportunities your leads actually produce each month.
1,000 Leads * 5% Conversion Rate = 50 Opportunities per month
Step 2: Calculate Monthly New Deals
Next, apply your sales team's historical close rate to those opportunities to see how many deals you can expect to win.
50 Opportunities * 25% Close Rate = 12.5 New Deals per month
Step 3: Calculate Quarterly New Bookings
Finally, multiply the number of new deals by your average contract value to get your new bookings for the quarter.
12.5 Deals/month * 3 months * $50,000 ACV = $1,875,000 in New Bookings per quarter
This calculation gets you to a projected $1.875M in new bookings, all derived from your frontline sales and marketing data. Your sales projection now has a solid, defensible foundation.
Adapting the Model for a Digital Agency or Services Firm
This bottoms-up model works just as well for professional services firms and digital agencies, but the inputs look a little different. Instead of focusing only on website leads, you'll track various lead sources that feed into different types of revenue. An agency’s revenue is typically a mix of one-off project work and recurring monthly retainers. Your forecast must mirror that reality.
Your lead sources might include:
- LinkedIn Outreach Campaigns: Projecting a certain number of discovery calls from a set number of connection requests.
- Referral Partners: Estimating new clients based on historical referral win rates.
- Website Inquiries: Tracking contact form submissions that could turn into either project or retainer work.
Your projection should then split into two streams. For project-based revenue, you'd model the sales pipeline much like the SaaS example. For retainer-based revenue, you’ll calculate the new Monthly Recurring Revenue (MRR) and add it to your existing MRR base, while also factoring in client churn. A robust three-year forecast must carefully model both these income streams, which is a core part of building a comprehensive financial model for your small business.
This granular approach ensures your sales forecast isn't just an academic exercise but a true reflection of your business's unique revenue dynamics.
Refining Your Forecast With a Weighted Pipeline
A raw pipeline total is a vanity metric. Saying “we have $10M in the pipeline” feels great, but it’s a number you can’t use for hiring, cash flow planning, or board reporting. You don't close 100% of your opportunities, so your forecast shouldn't pretend you do.
This is where a weighted pipeline comes in. It injects a dose of reality by applying a close probability to each stage of your sales process. This simple refinement shifts your forecast from a hopeful guess to a data-backed projection you can actually run your business on. It's the difference between saying, "We have $10M in the pipeline" and "We realistically expect to close $3.8M from that pipeline." The second number is the one that matters.
Calculating Your Weighted Forecast
To build this, you first need to clearly define your sales stages. Then, you assign a close probability to each stage based on historical data, not gut feelings. Dig into your CRM: what percentage of deals that reached the "Proposal Sent" stage actually closed? That's your probability.
Let's walk through an example using a sample $10,000,000 pipeline for a professional services firm.
Weighted Pipeline Forecast Calculation Example
This table shows how the math works. By applying historical close rates to the value of deals at each stage, we can calculate a much more realistic weighted forecast value.
| Sales Stage | Pipeline Value | Close Probability | Weighted Forecast Value |
|---|---|---|---|
| Discovery | $3,000,000 | 10% | $300,000 |
| Demo Scheduled | $2,500,000 | 25% | $625,000 |
| Proposal Sent | $2,000,000 | 50% | $1,000,000 |
| Contract Negotiation | $2,500,000 | 75% | $1,875,000 |
| Total | $10,000,000 | $3,800,000 |
As you can see, the raw $10M pipeline translates to a far more sober $3.8M weighted forecast. This is the number you should use to manage cash, set hiring plans, and report to your board. It’s defensible because it’s built on your actual performance data.
Uncovering Benchmarks and Bottlenecks
Once you have this model, it becomes a powerful diagnostic tool. You can start comparing your stage-to-stage conversion rates against industry benchmarks to spot where you’re lagging.
For instance, OpenView's 2024 SaaS Benchmarks report shows a median win rate from a qualified opportunity is around 27%. If your opportunity-to-close rate is only 15%, you have a clear problem in the later stages of your sales cycle. That insight tells you exactly where to focus coaching or process improvements to get the biggest lift.
This diagram shows how leads move through the sales funnel, eventually converting into revenue. It visualizes why applying probabilities is so crucial—not every lead becomes an opportunity, and not every opportunity closes.
Warning Signs in Your Weighted Pipeline
A weighted forecast is only as good as the data and assumptions powering it. Watch out for these common red flags that will throw your numbers off.
- Overly Optimistic Probabilities: If your sales team sets stage probabilities based on "good feelings" instead of historical data, your forecast is pure fiction. Always ground your percentages in what your CRM data says about past deals.
- Stale Pipeline: Deals that have been sitting in the same stage for months shouldn't carry the same weight as active ones. Implement "pipeline hygiene" rules to automatically flag or close out deals that have gone cold to avoid artificially inflating your forecast.
- Ignoring Deal Velocity: Is your average sales cycle getting longer? If deals are slowing down, your revenue will be delayed, even if the total weighted pipeline value looks good. This is a critical metric to track alongside your forecast.
By understanding the different sales forecasting methods available, you can build a more robust and reliable financial outlook for your business.
Validating Projections With a Top-Down Market View
Your bottoms-up forecast shows what your team can achieve. It's the operational plan. But investors and your board also need to know if that plan is grounded in a larger market reality. A top-down view shows the ultimate size of the prize and provides a critical sanity check for your ambition.
Combining a market-based reality check with your operational forecast is what gives your sales projections template real strategic power.
How a Top-Down Forecast Works
The logic here is a simple funnel: TAM > SAM > SOM. You start with the entire universe and narrow your focus to the part you can actually win.
- Total Addressable Market (TAM): The entire global demand for a product or service. Think of the worldwide market for all CRM software.
- Serviceable Addressable Market (SAM): The slice of the TAM you can actually serve with your product, geography, and business model. For example, CRM software for law firms in the United States.
- Serviceable Obtainable Market (SOM): The portion of your SAM you can realistically capture in the next few years. This is your target market share.
This method forces you to anchor ambitious growth targets in hard, market-based evidence. Projections rooted in this kind of market-share realism improve investor alignment on Asana.com because they show you've done your homework.
From TAM to a Defensible Revenue Target
Let's make this real. Imagine you run a SaaS company in the project management space. Your research shows your specific segment (your SAM) is worth $1 billion annually.
Your bottoms-up model, based on your team's capacity and marketing pipeline, says you can hit $15 million in ARR next year. Now, you need to see if that number passes the sniff test from a market-share perspective.
$15,000,000 ARR Target / $1,000,000,000 SAM = 1.5% Market Share
The question is: can you credibly capture 1.5% of your entire serviceable market in just one year? This is the gut-check a top-down view provides. To defend this number, you must show a clear strategy for winning that share, backed by your historical growth, team strength, and any industry tailwinds.
“When a founder shows me a forecast, I immediately do this math in my head. If they’re projecting they’ll capture 10% of a massive market in year two with a three-person sales team, I know their plan isn’t credible. I want to see a reasonable market share assumption backed by a clear strategy to win those customers.” – A Venture Capitalist at a Series A Fund
Building a Credible Multi-Year Forecast
The true power of this analysis shines when you build out your multi-year forecast. It’s not about hitting one number in one year; it's about showing a believable growth story over time.
Let's take a professional services firm that grew from $6M to $10M in revenue last year—an impressive 67% growth rate. The industry as a whole is growing at a healthy 25% annually. Your forecast needs to reflect both your company’s specific momentum and the market’s rising tide.
Here’s how you can layer these assumptions into a three-year forecast:
| Year | Starting Revenue | Your Growth Assumption | Market Growth Tailwind | Projected Revenue | Market Share (of $1B SAM) |
|---|---|---|---|---|---|
| Year 1 | $10.0M | 40% | 25% | $16.5M | 1.65% |
| Year 2 | $16.5M | 35% | 25% | $27.8M | 2.78% |
| Year 3 | $27.8M | 30% | 25% | $45.2M | 4.52% |
Notice how your internal growth assumptions temper over time (from 40% down to 30%). This is realistic—it gets harder to grow at the same percentage as your revenue base gets larger. However, the market’s underlying 25% growth continues to provide a powerful lift.
This table tells a story: not only is the company growing, but it's actively taking market share every single year. Showing this foresight in your own model is crucial for a successful valuation of your startup company.
From Spreadsheet to Strategy: Activating Your Sales Forecast
A sales projection template is a beautiful lie until you connect it to reality. If your forecast just sits in a folder, updated once a quarter, it’s not a strategic tool—it’s a historical document. To make it work for you, you have to activate it.
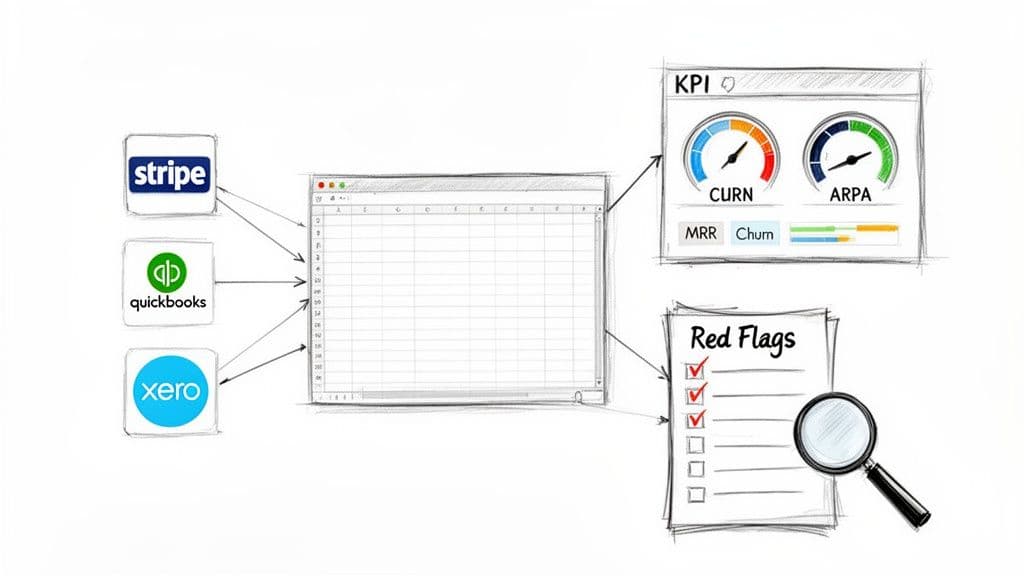
Activating your forecast means moving beyond manual data entry. It’s about creating a live feed from the platforms where your financial life happens: revenue data from Stripe, expenses from QuickBooks or Xero, and pipeline metrics from your CRM. This is how you build a rolling forecast and get the visibility needed for a fast, 5-day month-end close.
Building Your Live Financial Dashboard
Once your forecast is hooked into these real-time data streams, you can build a KPI dashboard that becomes your single source of truth. This isn’t just about tracking a top-line revenue number; it's about monitoring the specific drivers behind it so you can understand why things are happening.
For a SaaS business, your dashboard absolutely must include:
- MRR/ARR Growth: Are you hitting your monthly and annual recurring revenue targets?
- Customer Churn: How many logos are you losing (logo churn) and how much MRR is walking out the door (revenue churn)?
- Average Revenue Per Account (ARPA): Is your team successfully upselling or cross-selling to increase account value, or are deal sizes shrinking?
- Sales Cycle Length: Is it taking longer to close deals? This directly impacts when cash actually hits your bank.
Seeing these numbers update automatically means you can spot and react to a negative trend in days, not get blindsided by it at the end of the quarter. That’s the level of control you need to manage a high-growth business.
"Your forecast spreadsheet should be the most-visited file in your company. If your leadership team isn't reviewing actuals vs. forecast weekly, you're flying blind. The goal is to close the gap between your financial model and operational reality." – A Fractional CFO for SaaS Companies
A Checklist for Identifying Red Flags
An integrated forecast model does more than track progress—it’s your early warning system. You need to define clear trigger points that scream "something is wrong" so you can take action before a small problem becomes a full-blown crisis.
Here are the critical warning signs every founder should be monitoring:
- Pipeline Coverage Drops Below 3x: If your weighted pipeline isn't at least three times your quarterly sales quota, you are in immediate danger of missing your target. This is a non-negotiable metric.
- Sales Cycle Lengthens by More Than 15%: A sudden jump in your average sales cycle means revenue you were counting on this quarter might slip to the next, creating a painful cash flow gap.
- Lead-to-Opportunity Conversion Rate Declines: This is often the canary in the coal mine. A drop here signals a problem at the top of the funnel—either lead quality is down or your sales development process is broken.
- Customer Acquisition Cost (CAC) Spikes: Are you spending more to land new customers? If that isn't matched by a corresponding rise in ARPA, your profitability is silently eroding.
Setting up automated alerts for these red flags transforms your sales projections template from a static planning document into a dynamic management tool. A report from monday.com found that 66% of sales leaders struggle with inaccurate forecasts specifically because their reporting systems can't access live CRM data. Direct integration solves that problem.
You don't have to be a spreadsheet wizard to do this. A practical guide to Excel AI can show you how to automate much of the data cleaning, analysis, and reporting, which cuts down on manual error and frees your team to think about strategy. Ultimately, connecting your forecast to live data is the core of effective financial reporting automation.
Common Questions and Misconceptions
Even the best sales projection template will spark questions once you start plugging in your own numbers. This is a sign you’re using it correctly. A forecast isn't a static document you build once and forget; it's a living tool that has to evolve with your business.
Here are the most common questions and objections we hear from founders and finance leaders.
Objection: "My Projections Are Always Wrong Anyway, So Why Bother?"
This is a common frustration, but it misses the point of forecasting. The goal is not to be perfectly accurate. The goal is to be directionally correct and, more importantly, to understand why your forecast was off. The real value comes from the variance analysis.
Start by running a forecast vs. actuals analysis every single month. Dig into the variances. Where did reality diverge from the plan?
| Metric | Forecast | Actual | Variance | Root Cause Analysis |
|---|---|---|---|---|
| Lead Volume | 500 | 450 | -10% | Did a planned marketing campaign get delayed? |
| Close Rate | 25% | 18% | -7% | Did a competitor launch a new feature or promo? |
| Deal Size (ACV) | $40,000 | $45,000 | +12.5% | Did the team successfully upsell or land a larger deal? |
In this example, the lower close rate is a problem, but the higher average contract value (ACV) might cushion the blow. Your next step is to talk to your team. Was it a month with terrible lead quality? Did a new salesperson struggle? This process—analyzing variances and feeding the insights back into your model's assumptions—is the only way to improve its reliability. This disciplined loop turns forecasting from a frustrating chore into a powerful learning tool.
"How Often Should I Update My Sales Projections?"
You should formally review and re-forecast your entire sales projection model quarterly. This is the right cadence for strategic planning, resource allocation, and board meetings.
However, you must track your actual performance against that forecast monthly. This is a non-negotiable part of your month-end close.
This monthly check-in lets you create a rolling forecast. As each month closes, you replace it with actuals and add a new projected month at the end. This keeps your forward-looking view consistent, so you're always looking 12 months out. For fast-growing SaaS companies or any business in a volatile market, a full monthly re-forecast is the gold standard for agility.
"What's the Biggest Mistake People Make with Projections?"
The single biggest mistake is building your projections in a silo, completely disconnected from what the sales and marketing teams are actually doing. We call this a "hope-based" forecast, and it's useless for running your business.
Another huge error is plugging in unrealistic assumptions. This usually looks like:
- Conversion rates that are pure fantasy and have no historical basis.
- Assuming a 30-day sales cycle when your CRM data clearly shows it’s closer to 90 days.
- Completely ignoring churn in a subscription model, which is a fatal flaw.
To avoid this, ensure your financial model is integrated with your CRM like Salesforce and accounting software like QuickBooks or Xero to automate most of this analysis and eliminate the risk of manual data entry errors.
Next Steps: From Forecast to Financial Machine
You now have the framework to build a sales projection that is both operationally sound and strategically defensible. Here is your plan of action:
- Build Your Bottoms-Up Model: Gather historical data on leads, conversion rates, and deal size. Create a lead-based forecast that connects marketing and sales activity directly to revenue.
- Create Your Weighted Pipeline: Define your sales stages and assign data-backed probabilities to each. This gives you a realistic view of expected bookings.
- Sanity-Check with a Top-Down View: Research your TAM, SAM, and SOM. Ensure your bottoms-up growth targets represent a credible market share goal.
- Activate Your Forecast: Integrate your model with live data from your CRM and accounting systems. Set up a KPI dashboard and automated red flag alerts.
- Establish a Rhythm: Commit to a monthly forecast vs. actuals review and a quarterly re-forecasting process. Make it a core part of your financial operating rhythm.
Building and maintaining an accurate, actionable sales forecast is a core part of a strong financial foundation. But as a founder or CEO, your time is better spent on strategy, not spreadsheets. Jumpstart Partners provides the expert outsourced controller services you need to get investor-ready financials, fast-track your month-end close, and gain true visibility into your cash flow.
Schedule a consultation to see how we can help you build a financial machine that drives growth.