Financial Operations
Budget vs Actuals: The Founder's Guide to Financial Control and Strategic Growth
Gain control with budget vs actuals insights to cut costs, improve forecasting, and fuel profitable growth.
ByJumpstart Partners, CPA, QuickBooks ProAdvisor
··20 min readYou miss your revenue target by 15%. Is it a blip, or is your entire go-to-market strategy broken? You overspend the marketing budget by $20,000. Is it a waste, or the most efficient customer acquisition you've ever had? Without a rigorous budget vs actuals analysis, you're just guessing.
A budget is your financial plan—a set of assumptions about the revenue you'll generate and the expenses you'll incur. Your actuals are the hard reality of what happened. Comparing the two isn't just an accounting exercise; it's the single most powerful tool you have for understanding the true health of your business. It turns historical data into a strategic roadmap, telling you exactly where your strategy is working and where it's failing.
Why Your Budget vs Actuals Report Is Your Most Powerful Strategic Tool
If you see your budget vs actuals report as just a historical accounting exercise, you're leaving growth on the table. For founders of scaling companies, this report isn't about compliance—it's a compass that reveals the true health of your strategy and execution.
It’s the critical difference between reacting to cash flow problems in small business and proactively steering your company toward its goals. A well-executed budget vs actuals process transforms what feels like a tedious task into a strategic weapon.
From Reactive Accounting to Proactive Strategy
Consistent variance analysis is what drives smarter, faster decisions on hiring, marketing spend, and product investment. It’s the data you need to lead with confidence rather than just gut feelings. This discipline is essential for any leader who wants to maintain control during periods of rapid growth.
For instance, understanding how to implement an Open to Buy (OTB) budget for inventory is a perfect example of this principle in a retail context. The same logic of planning versus reality applies across every business model.
Budget vs Actuals At a Glance
Think of it this way: your budget sets the destination, while your actuals tell you exactly where you are on the map. The comparison shows you how to adjust your course to get back on track.
The table below breaks down the key distinctions.
| Attribute | Budget | Actuals |
|---|---|---|
| Purpose | A financial plan and forecast for a future period. | A historical record of financial transactions that have occurred. |
| Timing | Created before the financial period begins (e.g., annually, quarterly). | Recorded and finalized after the financial period ends (e.g., monthly). |
| Data Source | Based on assumptions, historical data, and strategic goals. | Sourced from actual invoices, receipts, and bank statements. |
| Strategic Function | Sets performance targets and allocates resources. | Measures performance and provides data for variance analysis. |
To learn more about setting a strong foundation for this process, check out our guide on how to define operating budgets. It’s the first step toward building a plan you can actually measure against.
The Mechanics of Effective Variance Analysis
Knowing your revenue missed the mark by $15,000 is just surface-level information. The real strategic value comes from understanding why. This is the job of variance analysis—the process of digging into that difference to uncover the specific operational drivers behind your financial performance.
Think of it less as an accounting chore and more as a diagnostic tool. By breaking down high-level variances into their component parts, you can pinpoint the root cause of overspending or underperformance and take targeted, effective action.
Calculating Key Financial Variances
The basic formula for variance is straightforward: Actual Result - Budgeted Amount = Variance. But a single number rarely tells the whole story. You unlock the real insight when you dissect that number into more specific pieces, like price and volume variances.
Let's walk through a practical example for a B2B SaaS company for the month of January:
| Line Item | Budget | Actual | Variance ($) | Variance (%) |
|---|---|---|---|---|
| Subscription Revenue | $150,000 | $135,000 | ($15,000) | -10.0% |
| COGS (Hosting & Support) | $15,000 | $16,200 | ($1,200) | -8.0% |
| Sales Commissions | $7,500 | $6,750 | $750 | 10.0% |
At first glance, the company missed its revenue target. But what was the culprit? Was it a sales execution problem (not enough deals), or a pricing problem (too much discounting)? This is where a deeper analysis is required.
Distinguishing Price vs. Volume Variance
To get to the root cause, you have to separate the impact of sales volume (how many units you sold) from sales price (the average price you sold them for). This distinction is critical for taking the right corrective action.
- Price Variance: Measures the impact of selling at a different average price point than you budgeted.
- Volume Variance: Measures the impact of selling more or fewer units than you budgeted.
Let's assume your SaaS company's budget was based on selling 100 new subscriptions at an average price of $1,500/month. In reality, they only sold 90 new subscriptions at an average of $1,500/month.
-
Price Variance Calculation: (Actual Price - Budgeted Price) x Actual Volume ($1,500 - $1,500) x 90 units = $0 In this case, heavy discounting wasn't the problem.
-
Volume Variance Calculation: (Actual Volume - Budgeted Volume) x Budgeted Price (90 units - 100 units) x $1,500 = ($15,000) The entire $15,000 negative revenue variance was driven by selling 10 fewer units than planned.
This insight immediately shifts the conversation. Instead of scrutinizing the sales team's negotiation skills, you now know to investigate lead generation, pipeline conversion rates, or sales cycle length. A critical part of this process is truly grasping your unit economics. You can go deeper on this by understanding contribution margin in our detailed guide.
“Variance analysis forces you to ask 'why' five times. It's not enough to know you missed your number. You have to know which assumption in your model was wrong—was it deal size, close rate, or churn? That’s where real strategy begins.” — Max Beauroyre, Head of Growth at Abacum
Favorable vs. Unfavorable Doesn't Mean Good vs. Bad
It’s crucial to interpret variances within their business context. A variance labeled "favorable" is not automatically a good thing, nor is an "unfavorable" one always bad. Context is everything.
For instance, a favorable variance in marketing spend might seem positive on its own. But what if that underspending led to a significant drop in qualified leads, directly causing the unfavorable sales volume variance we just calculated? That's a poor trade-off.
Conversely, an unfavorable variance in COGS (like higher hosting costs) could be a fantastic signal if it was caused by a massive, unexpected surge in new customer sign-ups and product usage. You overspent your budget, but for the best possible reason—hyper-growth. The key is to connect the dots across your entire P&L, not just look at line items in isolation.
Building a Bulletproof Financial Reporting Workflow
A budget vs actuals report that lands on your desk two weeks late is just a history lesson. To be genuinely useful, the analysis needs to happen fast, and that all comes down to a disciplined, streamlined month-end close. If your team is still wrestling with the books on the 15th of the month, you’re making decisions based on old news.
The goal isn't to work harder; it's to build a repeatable system that brings order to the chaos of closing. This turns raw transactional data into strategic insights while the information is still relevant.
Of course, a tight process is meaningless without clean data. A truly bulletproof workflow hinges on accuracy and consistency, which is why you have to ensure data integrity before you can trust any of the numbers you're analyzing.
The 5-Day Month-End Close Cadence
For any scaling company, a five-day close isn't a luxury; it's the standard. This aggressive timeline forces efficiency and gets the BvA report into leadership's hands in time to actually influence the current month's performance, not just review the last one.
Pulling this off requires clear ownership and a schedule that’s treated as non-negotiable. Here's a practical, five-day workflow you can implement right away.
A 5-Day Month-End Close for Accurate BvA Reporting
| Day | Key Actions | Responsibility |
|---|---|---|
| Day 1 | Finalize all cash and credit card reconciliations. Post any outstanding accounts payable and accounts receivable transactions. | Bookkeeper / Staff Accountant |
| Day 2 | Record all payroll and benefits accruals. Reconcile revenue from payment processors (e.g., Stripe, Shopify). | Controller / Senior Accountant |
| Day 3 | Post all remaining balance sheet accruals (like prepaid expenses and accrued liabilities). Do a preliminary P&L review for obvious misclassifications. | Controller |
| Day 4 | Finalize all balance sheet account reconciliations. Conduct the first review of the financials and key budget vs. actuals variances. | Controller / Head of Finance |
| Day 5 | Prepare the final reporting package, complete with commentary explaining the "why" behind the variances. Distribute to the executive team and department heads. | Head of Finance / CFO |
By committing to this structure, you eliminate the frantic end-of-month scramble and build a reliable reporting machine. It’s all about creating a predictable cadence.
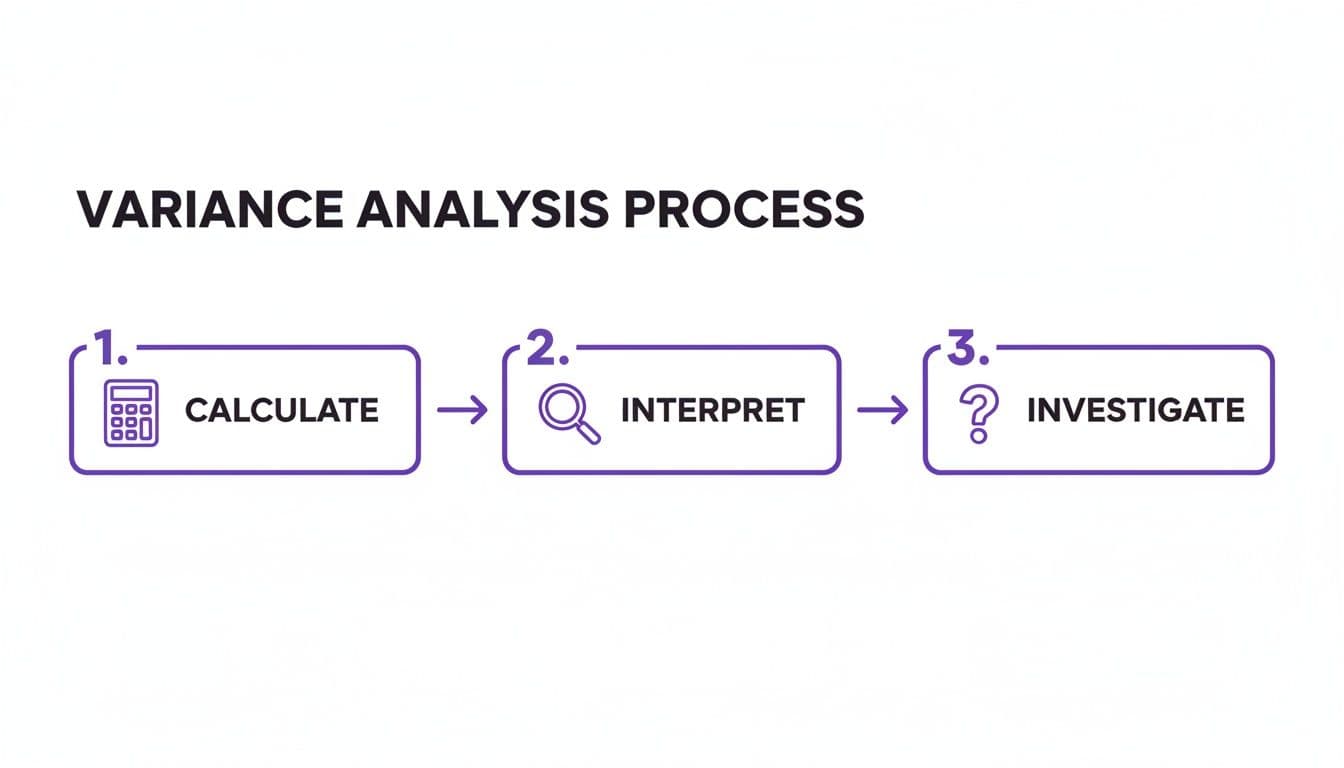
This simple flow—calculate, interpret, investigate—is the heart of variance analysis. The five-day close gets you to the "interpret" and "investigate" stages while the insights can still drive action.
Avoiding Common Data Integrity Pitfalls
A disciplined workflow is only as good as the data running through it. A few common mistakes can completely derail your BvA report, leading to flawed conclusions and misguided decisions.
Here are the red flags to watch for:
- Improper Expense Classification: Your marketing team pays for a new analytics tool, but the expense gets coded to "Office Supplies." Now your Customer Acquisition Cost (CAC) is understated, and your G&A budget looks bloated. You can no longer accurately track marketing ROI.
- Neglecting Accruals: You pay your $12,000 annual software subscription in January and book the entire thing as a January expense. This makes January look horribly unprofitable and the next 11 months artificially lean. Proper accrual accounting would recognize $1,000 of expense each month, giving you a true picture of performance.
- Delayed Revenue Recognition: You sign a big contract at the end of the month but don't recognize the revenue until the cash hits the bank. This violates basic accounting principles (like ASC 606) and completely distorts your actual monthly recurring revenue (MRR), making your sales performance look weak.
These aren't just minor bookkeeping errors; they create strategic blind spots. An effective month-end close is designed to systematically catch and correct these issues before they can mislead you. To learn more about systemizing this, check out our guide to financial reporting automation.
Interpreting Variances With Industry-Specific Context
A 10% budget variance doesn't mean the same thing to every business. For a SaaS company, an unfavorable variance in marketing spend might signal aggressive (and wildly successful) customer acquisition. For a professional services firm, that same variance could point to a dangerously unprofitable project.
Understanding your own business model is the only way to interpret your budget vs. actuals report correctly.
Without this industry-specific lens, your variance analysis will only tell you what happened, not why it matters. The numbers are just the starting point; the real story is in how those numbers connect to the core drivers of your revenue and profitability. You need to move beyond generic P&L lines and focus on the metrics that define success in your world.
SaaS Business Variance Analysis
For SaaS companies, your budget vs. actuals analysis lives and dies by your unit economics and recurring revenue metrics. While overall profitability matters, the most critical variances often relate to the efficiency of your growth engine.
Here’s what you should be scrutinizing:
- Annual Recurring Revenue (ARR) Variance: Did you miss your ARR target because you signed fewer new customers (a volume issue)? Or was it because your Average Revenue Per Account (ARPA) was lower than expected (a price or product mix issue)? A negative variance here is a direct threat to your valuation.
- Customer Acquisition Cost (CAC) Variance: An unfavorable variance isn't automatically bad news. If your CAC is 15% over budget but your new ARR is 30% ahead of plan, that’s a trade you make all day long. The real red flag is when CAC climbs without a corresponding increase in high-quality revenue.
- Gross Margin Variance: Your COGS—primarily hosting, support, and third-party software—should scale predictably with revenue. If your gross margin actuals are consistently below budget, it often points to technical debt or support inefficiencies that need immediate attention.
According to OpenView's 2024 SaaS Benchmarks, the median Net Revenue Retention (NRR) for companies in the $1M-$20M ARR range is 105%. If your BvA shows churn is dragging your actual NRR below this benchmark, you have an urgent retention problem to solve.
Digital Agency and Professional Services Variance Analysis
For agencies and professional services firms, the focus shifts dramatically from ARR and CAC to utilization and profitability on a per-project or per-client basis. Your most valuable asset is your team’s time, and your budget vs. actuals report must reflect how effectively you are deploying it.
Key variances to monitor include:
- Gross Margin by Project/Client: This is your north star metric. A negative variance here means you either under-scoped the project, your team was inefficient, or you experienced scope creep without a change order. You have to track this in real-time, not just at month-end.
- Billable Utilization Rate: You budget for your team to be, say, 75% billable. If the actual rate comes in at 65%, that 10-point gap is pure lost profit. This variance tells you whether you have a sales pipeline problem (not enough work) or a project management problem (too much non-billable time).
- Revenue per Billable Employee: This metric combines both your pricing and your utilization. If this number is below budget, it’s a powerful signal that you’re either under-pricing your services or your team is spending too much time to deliver them.
Clean data is non-negotiable for this analysis. Research shows that poor data quality costs U.S. organizations an average of $15 million annually, a risk you cannot afford. Learn more about the impact of data quality on financial accuracy.
Warning Signs: Red Flags in Your Budget vs Actuals Report
When your budget vs. actuals report is consistently splattered with red ink, it’s a clear sign something is off. These variances aren't just numbers on a page; they're the check engine light for your company's financial health. Ignoring them is a surefire way to turn a small issue into a full-blown crisis.
Think of these discrepancies as diagnostic tools. They point you directly to the friction in your operations—whether it’s wildly optimistic sales goals, hidden costs bleeding you dry, or a fundamental disconnect between your plan and your team's execution.
Revenue Variances: The Optimism Trap
One of the most common misconceptions is that a budget is a sales goal. It's not. A budget is a realistic financial plan based on data. When you consistently miss revenue targets, it’s almost always because your budget was built on optimism instead of historical performance.
If you budget for a 25% close rate, but your CRM data for the past 18 months shows it's actually 18%, your entire financial model is flawed from the start. That single gap sends shockwaves through your entire financial plan, throwing off everything from hiring decisions to your marketing spend and cash reserves. A persistent revenue miss is a direct order to get real about your go-to-market assumptions.
Expense Variances: Hidden Operational Drags
On the flip side, ongoing unfavorable expense variances often expose the quiet inefficiencies that slowly eat away at your bottom line. Labor costs are the usual suspect here, especially for service businesses and agencies where payroll is the biggest line item.
Let's say your labor costs are constantly 10% over budget. Is it because of unplanned overtime to hit deadlines? Or is it a symptom of an understaffed, burnt-out team that's becoming less efficient? Sometimes the cause is external. For example, if you budgeted for a 3% average salary increase but market rates forced you to give 5% to retain top talent, your original assumption was wrong.
“Consistent budget variances are the symptoms, not the disease. The real work is tracing a 15% cost overrun back to its source—a broken process, an outdated assumption, or a strategic misalignment. That’s how you move from just reporting the numbers to actually improving them.” — David Vranicar, Managing Partner at FBS
Red Flags Demanding Immediate Investigation
Not all variances are created equal. Some are minor blips, but others signal deep-seated problems that threaten your stability. You have to know which fires to put out first. If you spot these patterns, it's time to drop what you're doing and dig in.
- Recurring Monthly Variances: One bad month is an anomaly. The same variance popping up for three straight months is a trend. It points to a systemic problem in how you plan or operate.
- Large, Unexplained Variances: Any variance over a certain threshold—say, 10% or $10,000—that doesn't have an immediate, obvious explanation needs an urgent deep dive. This could be a major error, an unexpected market shift, or even something as serious as fraud.
- Variances Tied to Key Strategic Goals: If you blow the budget on a critical product launch or miss revenue targets from a flagship marketing campaign, the damage goes far beyond the P&L. It means your core strategy might be failing.
- Favorable Variances with Negative Consequences: At first glance, underspending on customer support might look like a win. But if you trace it to a spike in customer churn a few months later, you've made a terrible trade-off.
Ignoring these red flags almost always leads to compounding problems and the kind of severe cash flow problems in small business that can bring a growing company to its knees.
Turning Your Financial Analysis Into Decisive Action
You've analyzed the variances and figured out the 'why.' Now what? This is the critical step where analysis becomes action. Your budget vs. actuals report isn't a history lesson; it's a decision-making tool that demands a response.
This is how you close the loop and ensure your financial deep-dive directly translates into better business performance.
Analysis without action is just an academic exercise. The insights you pull from these reports must trigger a clear set of next steps—adjusting strategy, reallocating resources, and communicating performance to your team and board.
Your Actionable Next Steps
When a significant variance pops up, don't just note it in a spreadsheet. Address it with a structured plan. Your response should be proportional to the variance's impact on your strategic goals.
| Step | Action | Example |
|---|---|---|
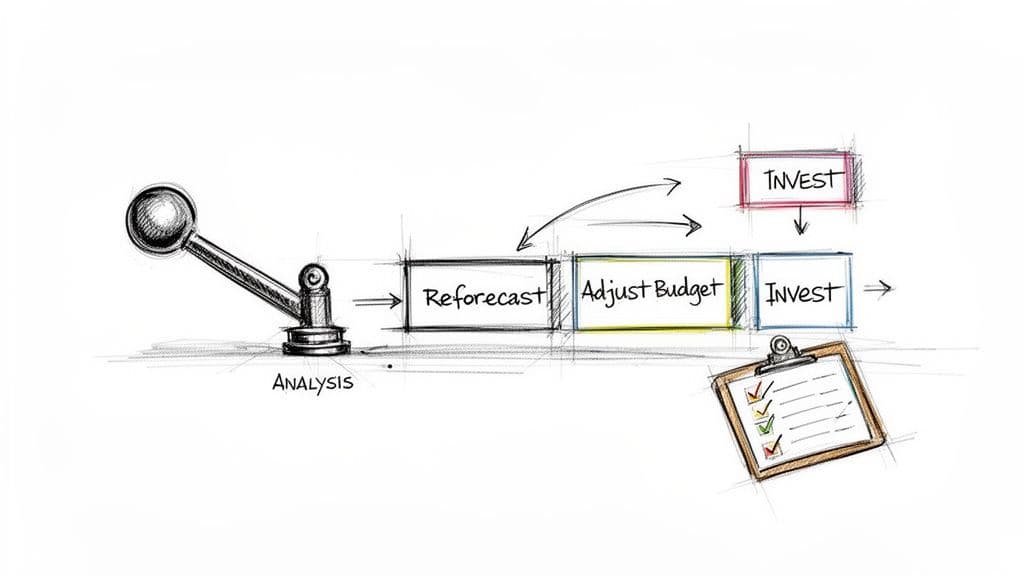
| 1. Re-forecast | Use your actual performance as a new baseline to update your financial forecast for the rest of the year. | If Q1 revenue was consistently 15% below budget, your Q2-Q4 forecast must reflect this new reality to be credible. |
| 2. Adjust Budgets | Reallocate resources based on what's actually working. Double down on high-performing channels and cut or fix underperforming ones. | Your engineering team came in $20,000 under budget. Reallocate that capital to the marketing channel with the lowest CAC. |
| 3. Communicate | Proactively explain variances to your board, investors, and department heads. Frame the conversation around the "why" and "what's next." | Tell your board, "We missed the revenue target by 10% because of a longer sales cycle. Here's our plan to address it." |
By following this process, you methodically turn a disappointing number into a concrete operational adjustment. This rigorous approach is fundamental to figuring out how to improve profit margins and building a resilient business.
Answering Your Top Budget vs Actuals Questions
When founders and finance leaders start digging into budget vs actuals, the same questions always come up. Here are the straight answers based on what we see work in the real world.
How Often Should I Run a Budget vs Actuals Review?
This is non-negotiable: you need to review your budget vs actuals report every single month. A quarterly review cycle is dangerously slow. By the time you spot a problem, an entire quarter is gone, and you’ve lost the chance to fix it.
A monthly cadence hits the sweet spot. It's frequent enough to catch trends and take meaningful action while the data is still relevant. For the absolute critical stuff like cash flow and sales pipeline, a weekly check-in is even better. This discipline kills surprises at month-end and keeps you tapped into the true pulse of the business.
What Counts as a “Material” Variance Worth Investigating?
A variance is material if it has the potential to throw your business goals off track. A good starting point is to set a threshold, like investigating any variance greater than 10% or $10,000, whichever is smaller.
But context is everything. A 5% negative variance on your annual recurring revenue (ARR) is a five-alarm fire for a SaaS company, while a 20% overspend on office snacks is just a rounding error.
Prioritize investigating variances that are:
- Recurring: The same line item is off target for two or more months in a row. That’s not a blip; it’s a pattern.
- Strategically significant: The variance hits a key driver of your business model, like customer acquisition cost (CAC) or gross margin.
- Unexpected: A big, unexplained swing that has no obvious cause demands immediate attention.
How Do I Make My Budget More Accurate?
Accuracy comes from building your budget on a foundation of reality, not just ambition. Stop creating budgets based only on top-down revenue goals.
Build a bottom-up forecast driven by your actual operational data. Instead of just plugging in a goal for $1M in new revenue, calculate it based on your sales team's actual capacity, their historical close rates, and the average deal size you’ve seen over the last year.
Pull in your historical actuals from the past 12-18 months to spot seasonality and real-world trends. And most importantly, get your department heads involved in the process. They're on the front lines, and their insights will prevent the unrealistic assumptions that lead to massive, confidence-shattering variances down the road.
Your budget vs actuals report is the compass for your business, but a flawed financial process can point you in the wrong direction. At Jumpstart Partners, our US-based, CPA-led team delivers investor-ready financials with a guaranteed 5-day month-end close, giving you the clarity to make faster, smarter decisions.
Get a clear financial picture—schedule your free consultation today.