Financial Operations
Rolling Cash Flow Forecast: A Founder's Step-by-Step Guide
Build and maintain a rolling cash flow forecast for your business. This step-by-step guide for founders covers templates, KPIs, and software integration.
ByJumpstart Partners, CPA, QuickBooks ProAdvisor
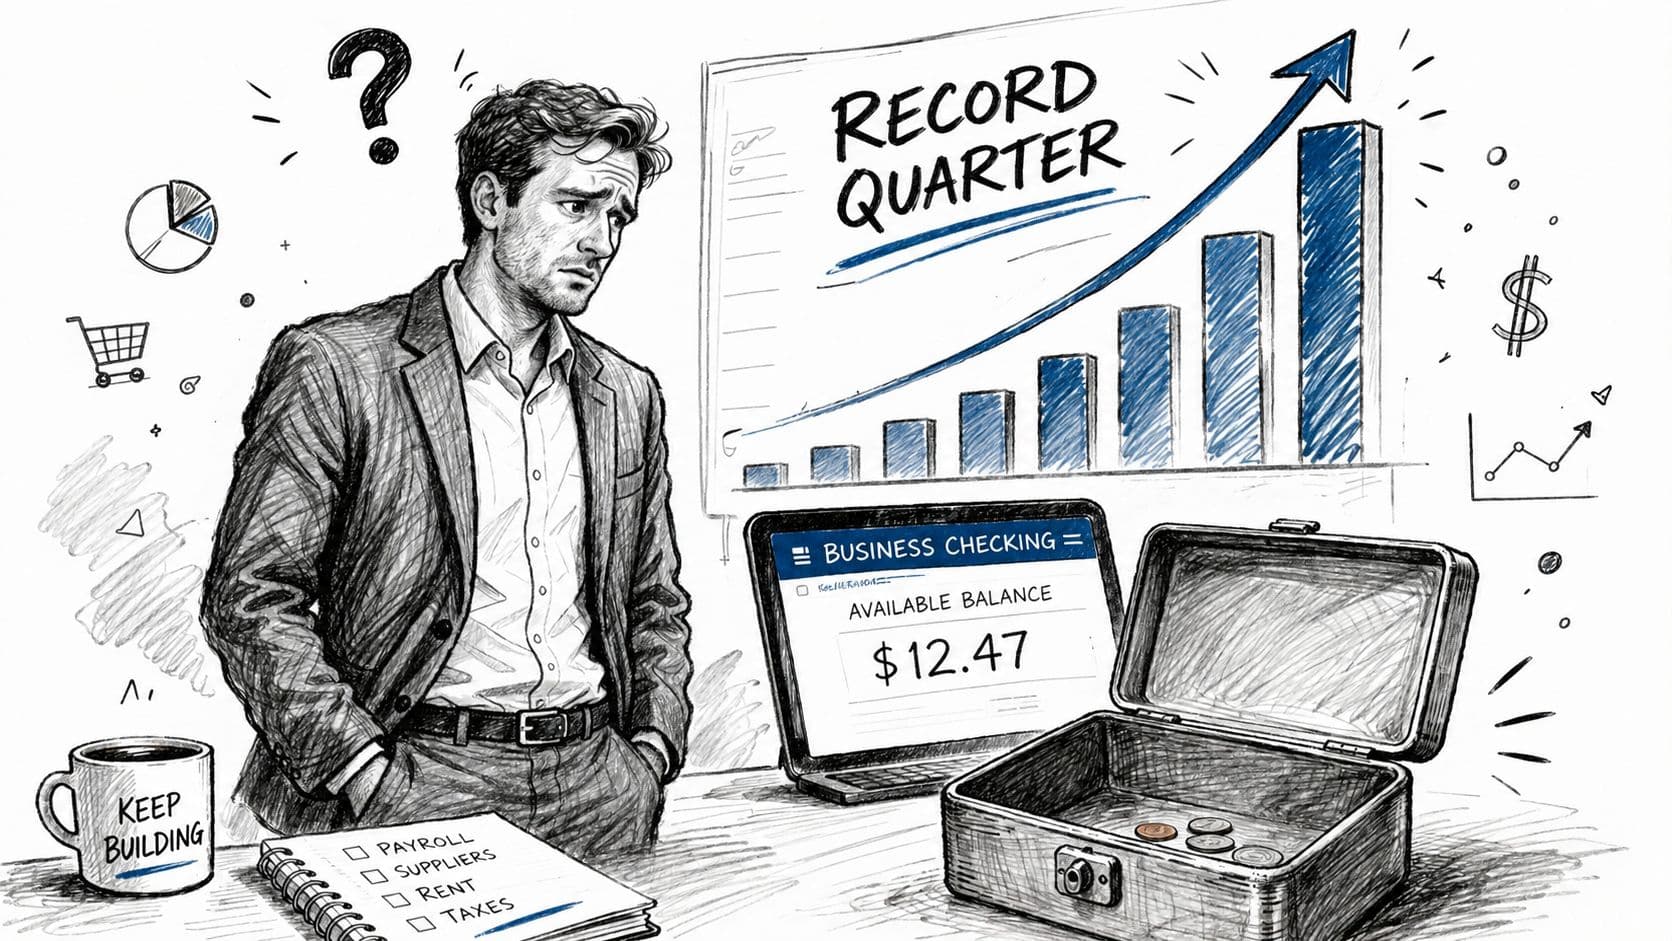
··20 min readYou closed a strong month. Stripe looked healthy, your sales team celebrated, and the P&L said the business was moving in the right direction. Then payroll hit, a large vendor invoice cleared, two clients paid late, and your bank account suddenly looked tight.
That gap between “we're doing well” and “why is cash so low?” is where founders lose control. If you run a SaaS company, agency, or professional services firm in the $500K to $20M range, you don't need another backward-looking report. You need a rolling cash flow forecast tied to the systems you already use, updated weekly, and built to answer one question fast: what happens to cash next?
Table of Contents
- Why Your Bank Balance Lies to You
- Anatomy of a 13-Week Rolling Forecast
- How to Build Your Forecast Step by Step
- Using Your Forecast to Make Smart Decisions
- Common Pitfalls and Red Flags to Avoid
- Automate and Scale Your Financial Engine
Why Your Bank Balance Lies to You
Your bank balance is a snapshot. It is not a strategy.
If you've ever looked at your account on Friday and thought, “We're fine,” only to realize on Monday that payroll, rent, software renewals, tax payments, and card settlements changed the picture completely, you already know the problem. Cash doesn't move in clean monthly lines. It moves in lumps, delays, and surprises.
A lot of founders confuse three different views of the business:
- Bank balance tells you what cash is there now.
- P&L tells you whether the business was profitable over a period.
- Rolling cash flow forecast tells you when cash is expected to come in and go out next.
Those are not interchangeable.
Revenue can be up while cash gets worse
A SaaS company can book annual contracts and still run short on cash if collections slip or expenses hit before receipts. An agency can show strong project revenue and still feel squeezed because contractors get paid this week while a client won't pay for another month. A professional services firm can have a full pipeline and still miss payroll if billing and collections are slow.
That's why checking your balance every morning doesn't solve the problem. It keeps you reactive.
Practical rule: If your cash review starts with the bank login instead of a forward-looking model, you're managing cash after the fact.
Static budgets don't help much either. The annual budget often stops being useful as soon as hiring changes, churn shifts, project timing moves, or a major customer pays later than expected. A budget assumes the year unfolds as planned. Your cash position never does.
What a rolling forecast does instead
A rolling cash flow forecast works because it shows expected inflows, expected outflows, and the projected ending cash balance for each upcoming week. As each week closes, you replace forecasted numbers with actuals, add a new future week, and keep your forward view current.
That shift matters. According to a 2026 NFIB research study, 82% of business failures are due to poor cash management, which is exactly the problem a rolling forecast is built to solve.
If you need a clearer distinction between statement-based reporting and actual cash timing, review this guide on how to read a cash flow statement. Then build the tool that lets you act before cash gets tight, not after.
Anatomy of a 13-Week Rolling Forecast
The most useful version for operating decisions is the 13-week rolling forecast. It's short enough to stay grounded in real invoices, payroll dates, and collection patterns, but long enough to spot pressure before it becomes a crisis.
Founders often ask why 13 weeks. Because one quarter is where most tactical decisions live. Hiring, collections, vendor timing, debt payments, tax dates, and client renewals all show up clearly inside that window.
The three parts that matter
A working model has only three core sections:
-
Cash inflows
Money you expect to collect. For most businesses this includes customer payments, recurring subscription receipts, project payments, retained deposits, and any financing proceeds. -
Cash outflows
Money you expect to pay. This includes payroll, contractors, rent, software, taxes, loan payments, card settlements, and one-off spend. -
Ending cash position
Beginning cash plus inflows minus outflows. That ending balance becomes the next week's starting point.
Basic 13-Week Rolling Forecast Structure
| Cash Flow Category | Week 1 | Week 2 | Week 3 | Week 4 | Week 5 | Week 6 | Week 7 | Week 8 | Week 9 | Week 10 | Week 11 | Week 12 | Week 13 |
|---|---|---|---|---|---|---|---|---|---|---|---|---|---|
| Beginning Cash | |||||||||||||
| Customer Collections | |||||||||||||
| Recurring Revenue Receipts | |||||||||||||
| Other Inflows | |||||||||||||
| Total Inflows | |||||||||||||
| Payroll | |||||||||||||
| Contractors | |||||||||||||
| Rent and Overhead | |||||||||||||
| Software and Tools | |||||||||||||
| Taxes and Debt Service | |||||||||||||
| Other Outflows | |||||||||||||
| Total Outflows | |||||||||||||
| Net Cash Flow | |||||||||||||
| Ending Cash |
Why weekly beats monthly
Monthly cash forecasts hide timing risk. If a large customer pays at the end of the month but payroll lands in the middle, your monthly view can look safe while your weekly reality is strained.
That's why operators use weekly columns. You need to know when the dip happens, not just whether the month closes positive.
The forecast becomes useful the moment it changes a decision before cash moves.
A 13-week model also forces discipline. Every week, you drop the completed week, plug in actual results, and add a new Week 13. That's what makes it “rolling.” If you want a deeper walkthrough of this framework, this explanation of the thirteen-week cash flow process is a useful companion.
How to Build Your Forecast Step by Step
Friday looks fine. The bank account shows $120,000. Then Monday hits: payroll clears, two client payments slip a week, Stripe settles later than expected, and the cash you thought you had is already spoken for.
That is why the build matters. A rolling cash flow forecast is not a finance exercise for the board deck. It is a weekly operating tool tied to QuickBooks or Xero for actuals, Stripe for settlement timing, and your billing or CRM system for what should convert into cash next.
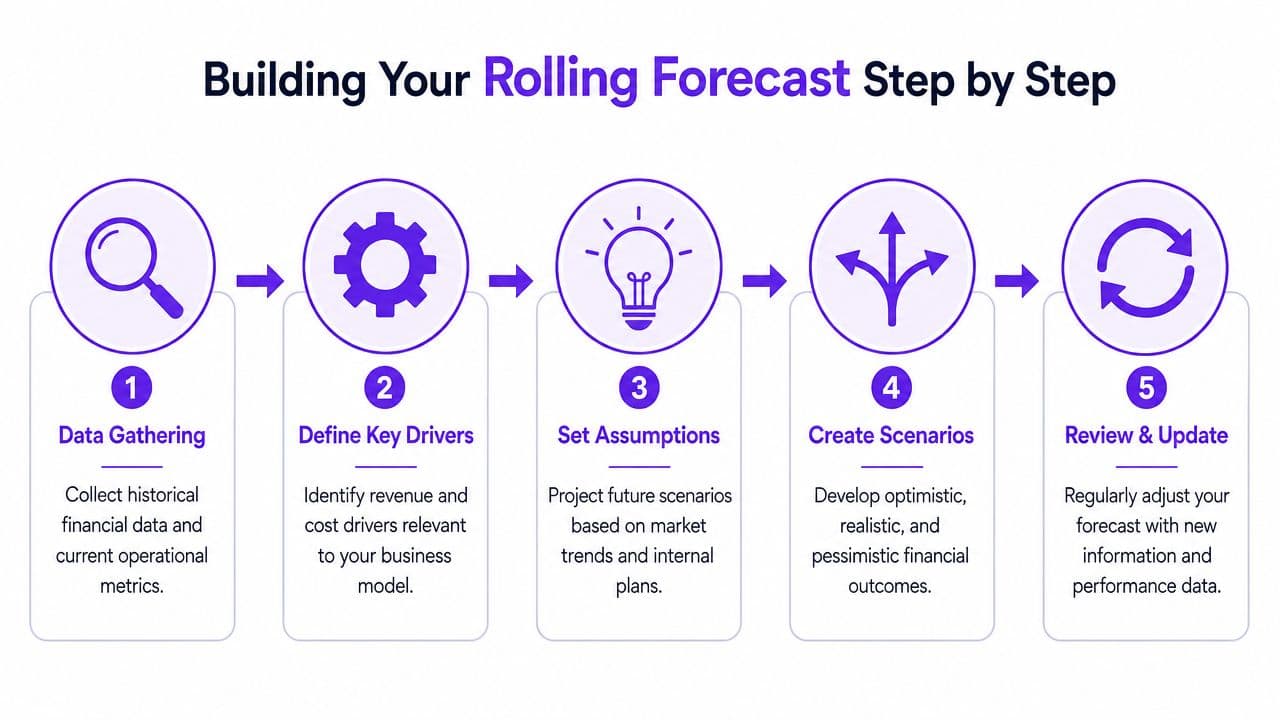
Step 1 Gather the real cash inputs
Start with source systems, not estimates from memory.
Pull beginning cash from cleared bank balances. Export open accounts receivable and tag each invoice by realistic collection timing, not invoice date. Pull accounts payable by due date. Add payroll, employer taxes, benefits, software renewals, debt payments, sales tax, income tax, and owner distributions. Founders usually miss at least one of those items, and one missed tax payment can make the whole model look healthier than it is.
If you need a starting format before you connect systems, use a cash flow statement template in Excel and convert it into weekly columns.
Step 2 Forecast inflows based on collections, not bookings
Revenue recognition does not pay payroll. Collections do.
Say your SaaS company starts Week 1 with $120,000 in cash. Stripe subscriptions are expected to settle at $18,000 each week. You also expect new customer cash of $6,000 in Week 2, $4,000 in Week 3, and $8,000 in Week 4. On top of that, annual invoices already sitting in AR should collect $12,000 in Week 1 and $15,000 in Week 3.
That produces this inflow view:
| Inflow Item | Week 1 | Week 2 | Week 3 | Week 4 |
|---|---|---|---|---|
| Existing subscription cash | 18,000 | 18,000 | 18,000 | 18,000 |
| New customer cash | 0 | 6,000 | 4,000 | 8,000 |
| AR collections | 12,000 | 0 | 15,000 | 0 |
| Total inflows | 30,000 | 24,000 | 37,000 | 26,000 |
Keep the standard high. If a deal is still in proposal stage, leave it out. If a customer usually pays 15 days late, model the delay. If Stripe pays out on a two-day lag, use the settlement date rather than the charge date.
That is how the forecast becomes useful in a weekly meeting.
Step 3 Forecast outflows by payment date
Outflows need the same treatment. Use the day cash leaves, not the month the expense belongs to.
For an agency, payroll and contractors usually drive the swings. Assume weekly payroll is $22,000. Contractor payments tied to active projects are $8,000, $12,000, $10,000, and $14,000 across the next four weeks. Add $3,000 of software in Week 1, $5,000 of rent and overhead in Week 2, and a $9,000 tax payment in Week 4.
Now the cash obligations look like this:
| Outflow Item | Week 1 | Week 2 | Week 3 | Week 4 |
|---|---|---|---|---|
| Payroll | 22,000 | 22,000 | 22,000 | 22,000 |
| Contractors | 8,000 | 12,000 | 10,000 | 14,000 |
| Software | 3,000 | 0 | 0 | 0 |
| Rent and overhead | 0 | 5,000 | 0 | 0 |
| Taxes | 0 | 0 | 0 | 9,000 |
| Total outflows | 33,000 | 39,000 | 32,000 | 45,000 |
This is also where tech stack discipline matters. QuickBooks or Xero should be the source for recurring bills and due dates. Credit card statements catch software spend that never got coded cleanly. Payroll reports catch employer taxes that founders often forget until the withdrawal hits.
Step 4 Roll beginning cash to ending cash
Now calculate the part that drives decisions.
| Cash Calculation | Week 1 | Week 2 | Week 3 | Week 4 |
|---|---|---|---|---|
| Beginning cash | 120,000 | 117,000 | 102,000 | 107,000 |
| Total inflows | 30,000 | 24,000 | 37,000 | 26,000 |
| Total outflows | 33,000 | 39,000 | 32,000 | 45,000 |
| Net cash flow | -3,000 | -15,000 | 5,000 | -19,000 |
| Ending cash | 117,000 | 102,000 | 107,000 | 88,000 |
That four-week view changes the conversation fast. A founder looking only at the opening balance sees six figures in the bank. A founder looking at the forecast sees that Week 2 tightens, Week 4 gets worse, and any new hire or owner draw has to compete with that reality.
As David Allen, fractional CFO, puts it, “A P&L tells you if you won the game. A cash flow forecast tells you if you'll have enough players to finish it.”
For a broader framework on building a master cash flow forecasting process across multiple drivers, it helps to separate recurring receipts, variable collections, fixed obligations, and one-time cash events.
A quick walkthrough can also help your team align on the workflow before you formalize it:
Step 5 Update it every week from your stack
The update cycle is what makes this a rolling forecast instead of a stale spreadsheet.
Use a set weekly rhythm:
- Monday morning: Reconcile the prior week in QuickBooks or Xero so beginning cash matches reality.
- Update Stripe settlements: Replace projected receipts with actual payout timing.
- Review AR and AP aging: Move customer payments and vendor bills to the week they are now likely to hit.
- Add the new Week 13: Keep the horizon constant.
- Review decisions with leadership: Hiring, vendor timing, tax payments, and collections should come from this version, not from memory.
If the update takes two hours, the model is probably too detailed. If nobody reviews it every week, the model is not part of your operating rhythm. The goal is a forecast your team will use every Monday, with live inputs flowing from the systems that already run the business.
Using Your Forecast to Make Smart Decisions
A forecast that doesn't change behavior is wasted work. The point isn't accuracy for its own sake. The point is better timing.
When you maintain a rolling cash flow forecast each week, you can answer operating questions without guessing. Can you hire now? Should you accelerate collections? Do you need to push a vendor payment? Is a tax payment going to create a cash dip two weeks before a large client invoice clears?
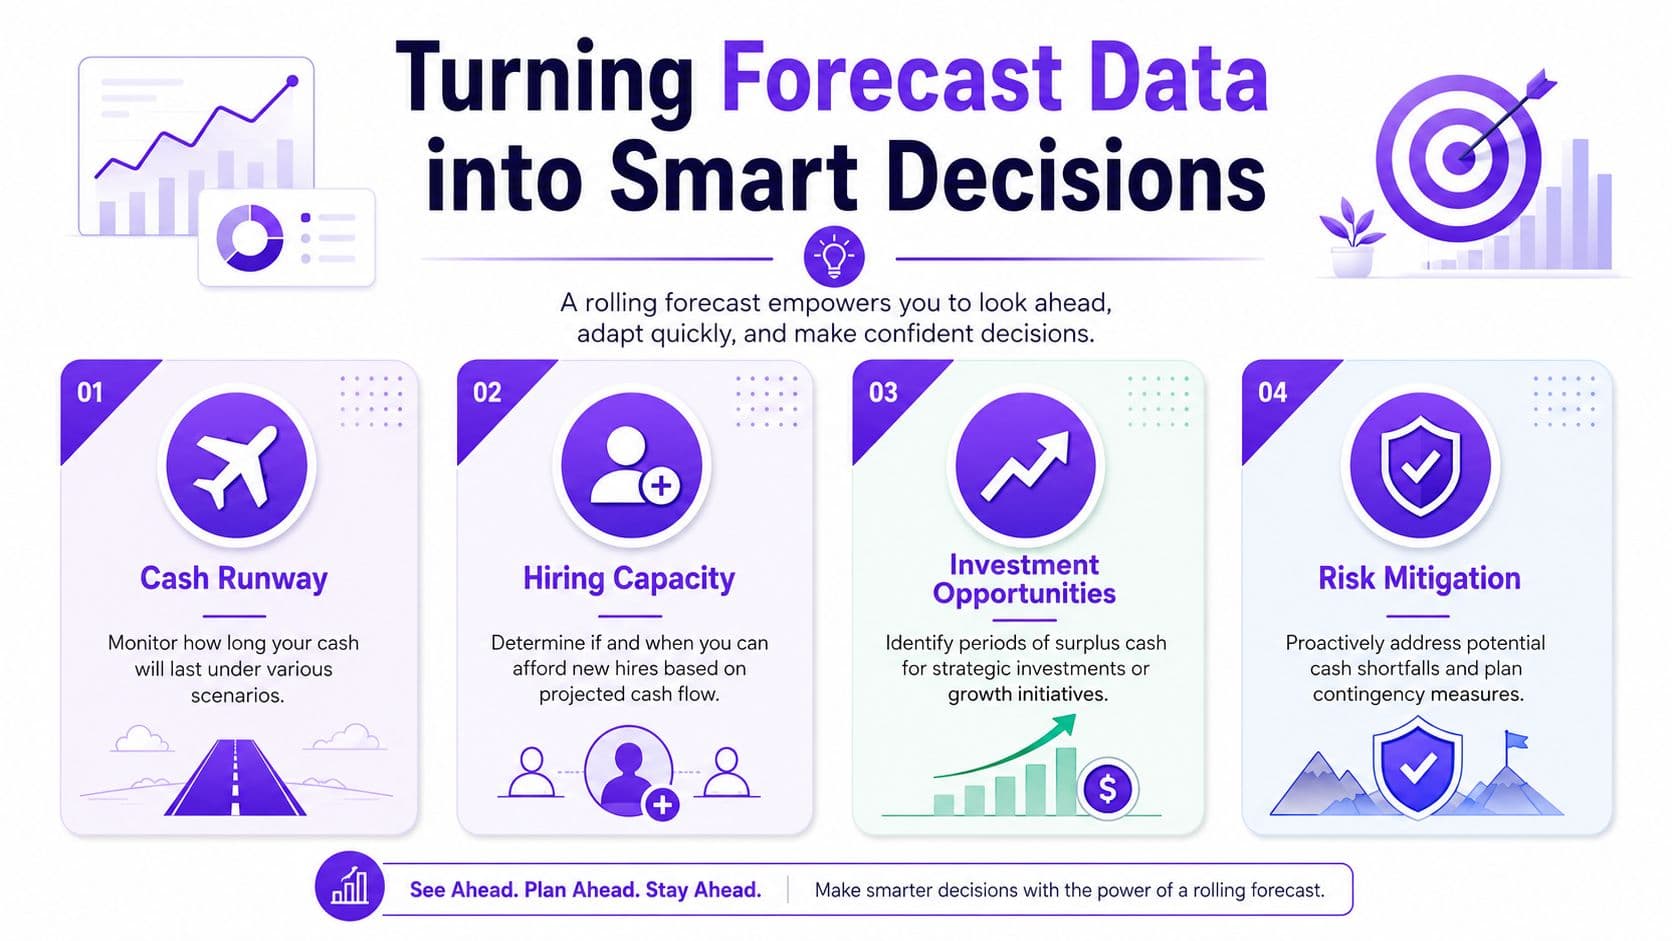
Turn weekly cash into runway
You don't need a separate model to estimate runway. Your forecast already shows it.
Using the four-week example above, ending cash falls from $120,000 to $88,000 over four weeks. That means cash decreased by $32,000 across the period. Divide that by four and the average weekly net burn is $8,000.
If your ending cash after Week 4 is $88,000, then:
- Weekly burn = $8,000
- Approximate runway in weeks = $88,000 ÷ $8,000 = 11 weeks
That isn't a board-deck abstraction. It's a decision trigger. If you're considering a hire, a software implementation, or a founder distribution, you now know what those choices are competing against.
Use scenario planning before you commit
The forecast becomes valuable by allowing you to test decisions before cash moves.
According to OpenView's 2026 SaaS Benchmarks, companies that actively use scenario planning within their cash flow forecasts identify funding needs an average of 4 to 6 months earlier than their peers.
Example one delayed client payment
Take the prior model and assume a client payment of $15,000 expected in Week 3 slips to Week 5 instead.
Week 3 ending cash changes like this:
| Scenario | Week 3 Inflows | Week 3 Outflows | Week 3 Ending Cash |
|---|---|---|---|
| Original forecast | 37,000 | 32,000 | 107,000 |
| Payment delayed | 22,000 | 32,000 | 92,000 |
That single timing shift removes $15,000 from Week 3 cash and drags the rest of the forecast down until the payment lands. If your minimum comfortable cash level is near that line, you now know to act in Week 2, not when the account turns ugly in Week 3.
Decision lens: The right question isn't “Can we afford this eventually?” It's “What week does this decision pressure cash?”
Three common what-if uses
- For SaaS companies: Model churn or delayed renewals by moving expected receipts out by a week or removing them entirely from the base case until confirmed.
- For agencies: Test scope creep by increasing contractor outflows before the client change order is approved.
- For e-commerce or inventory-heavy businesses: Add the inventory purchase in the exact week cash leaves, then assess whether collections or financing timing covers the dip.
What works in practice
Teams get the most value when the forecast sits inside the weekly leadership rhythm.
A useful review meeting usually covers:
- Actual versus forecast cash: Where timing moved
- Upcoming pinch points: Payroll weeks, taxes, annual renewals, debt payments
- Planned decisions: Hiring, marketing pushes, software contracts, owner draws
- Mitigation options: Collection calls, payment sequencing, credit line usage, spending pauses
What doesn't work is reviewing the file once a month and calling it forecasting. Monthly review is too slow for cash. By then, the decision window has often closed.
Common Pitfalls and Red Flags to Avoid
Most bad forecasts fail for simple reasons. They confuse accounting with cash, ignore timing, or stop getting updated.
If your model keeps surprising you, one of these red flags is usually the cause. For a broader look at recurring warning signs, this guide on cash flow problems in small business is worth reviewing alongside your own forecast.
The profit versus cash trap
A profitable month can still create a bad cash week.
Example: you invoice a large project in Week 1, record the revenue, and feel good about margins. But the client pays later while payroll and contractors get paid now. Profit improved. Cash got worse.
Correction: forecast by expected collection date and payment date, not by accounting period.
The missing non-operating cash event
Founders often model operating expenses and forget the items that hit cash hard but don't show up cleanly in day-to-day operating reviews.
Common misses include:
- Tax payments
- Debt principal payments
- Owner distributions
- Annual insurance renewals
- Software contracts billed once per year
Correction: keep a separate line for one-time and non-monthly obligations so they don't disappear inside overhead.
A forecast isn't wrong because the math failed. It's wrong because an expected cash event never made it into the model.
The optimism bias problem
This usually shows up in receivables.
A founder says a client “always pays” and books the cash in the current week, even though the actual pattern is later. The spreadsheet looks healthy. The bank account doesn't follow the script.
Correction: base collections on actual customer behavior. If a customer pays late repeatedly, forecast them late until they prove otherwise.
The stale forecast problem
This is the most common failure. The model starts strong, then no one updates it after two weeks.
When that happens, your “forecast” becomes an old opinion.
Red flags that your process is breaking
| Red Flag | What it usually means | Fix |
|---|---|---|
| Ending cash keeps missing reality | Collection timing is too optimistic | Rebuild receipts from actual payment patterns |
| Payroll causes recurring surprises | Payroll taxes or timing aren't fully included | Add full payroll cash cost by pay date |
| Large dips appear with no warning | One-time obligations aren't mapped | Add taxes, debt, and annual renewals |
| Team stops using the file | Update process is too manual or too complex | Reduce categories and move to a weekly cadence |
Automate and Scale Your Financial Engine
At 8:30 a.m. Monday, the account shows $214,000. By lunch, a Stripe payout posts a day later than expected, a $38,000 invoice slides to next week, and payroll pulls tomorrow. The number in the bank did not change your risk. Timing did.
A rolling cash flow forecast earns its keep when it updates inside your weekly operating rhythm, not when someone revisits a spreadsheet after a surprise. Pull reconciled actuals from QuickBooks or Xero. Pull payout timing, failed charges, and refunds from Stripe. Pull payroll dates and tax drafts from your payroll system. Then review the 13-week view every week with the same discipline you bring to pipeline, delivery, and hiring.
That process gives founders something more useful than a cash report. It gives them a control panel.
What automation should actually do
Good automation removes manual rekeying and shortens the gap between what happened and what your forecast shows. It should surface timing issues early enough to act on them. In SaaS, that might mean seeing that Stripe settlements, annual software renewals, and payroll all bunch up in the same week. In an agency, it might mean spotting that media passthroughs clear before the client reimbursement hits, even though the month still looks profitable on paper.
A setup worth keeping usually does four things:
- Pulls accounting actuals: cleared cash, open AR, AP, and expense detail from QuickBooks or Xero
- Maps payment timing: Stripe settlements, failed collections, refunds, and processor holds
- Flags exceptions: unexpected spend, slower collections, or a projected low-cash week that needs action
- Connects reporting and cash planning: the forecast should sit inside the broader finance system, not beside it, alongside Automated Financial Reporting
That last point matters more than founders expect. If reporting lives in one file, billing data lives in another, and the cash forecast depends on a manual export, the model breaks the first week someone skips an update. A real operating model pulls from the systems your team already uses and gets reviewed on a fixed cadence.
The break point is easy to spot. An agency with a handful of large retainers, contractor payouts, and media spend can look fine until one client pays late and two vendor drafts hit early. A SaaS business can show strong MRR and still run into a cash squeeze because annual prepaids distort revenue, while payroll and vendor costs keep going out every two weeks. Once transaction volume reaches that level, founder-maintained spreadsheets stop being reliable.
That is usually when ownership shifts to a controller or fractional CFO. Jumpstart Partners offers that through 13-week cash flow sprint work and ongoing controller support tied to systems like QuickBooks, Xero, Stripe, Gusto, and Shopify.
If your team still checks the bank balance to decide whether you can hire, spend, or wait, your cash process is behind the business. Build a weekly forecast that pulls from your stack, gets reviewed every Monday, and tells you about the problem before the account balance does.