Financial Operations
What Is Cost of Goods Sold? Formula and Worked Examples
What Is Cost of Goods Sold? Learn the formula, worked calculations, and how SaaS, agency and e-commerce COGS differ, with journal entries.
ByJumpstart Partners, CPA, QuickBooks ProAdvisor
··16 min readCost of goods sold is the direct cost of the goods or services a business sold in a period; for product businesses, it equals beginning inventory plus purchases minus ending inventory. With $1,000,000 in revenue and $600,000 in COGS, you have $400,000 in gross profit and a 40% gross margin.
You're reviewing your financials before a pricing discussion. Revenue looks healthy, but your support team is expanding, cloud bills are climbing, and the margin on your dashboard depends on where your bookkeeper puts those costs.
For founders running SaaS companies, digital agencies, and professional services firms, that's a decision-making problem. You control your classification policy, but you don't get to move delivery costs below gross profit just to make the business look stronger.
Table of Contents
- What Cost of Goods Sold Measures and Why It Sets Your Margin
- How to Calculate COGS With a Worked Example
- Which Costs Belong in COGS by Business Model
- Journal Entries That Record COGS Correctly
- Gross Margin KPIs to Track Each Month
- Common COGS Mistakes and Red Flags
- Set Up Accurate COGS Reporting Before Your Next Close
What Cost of Goods Sold Measures and Why It Sets Your Margin
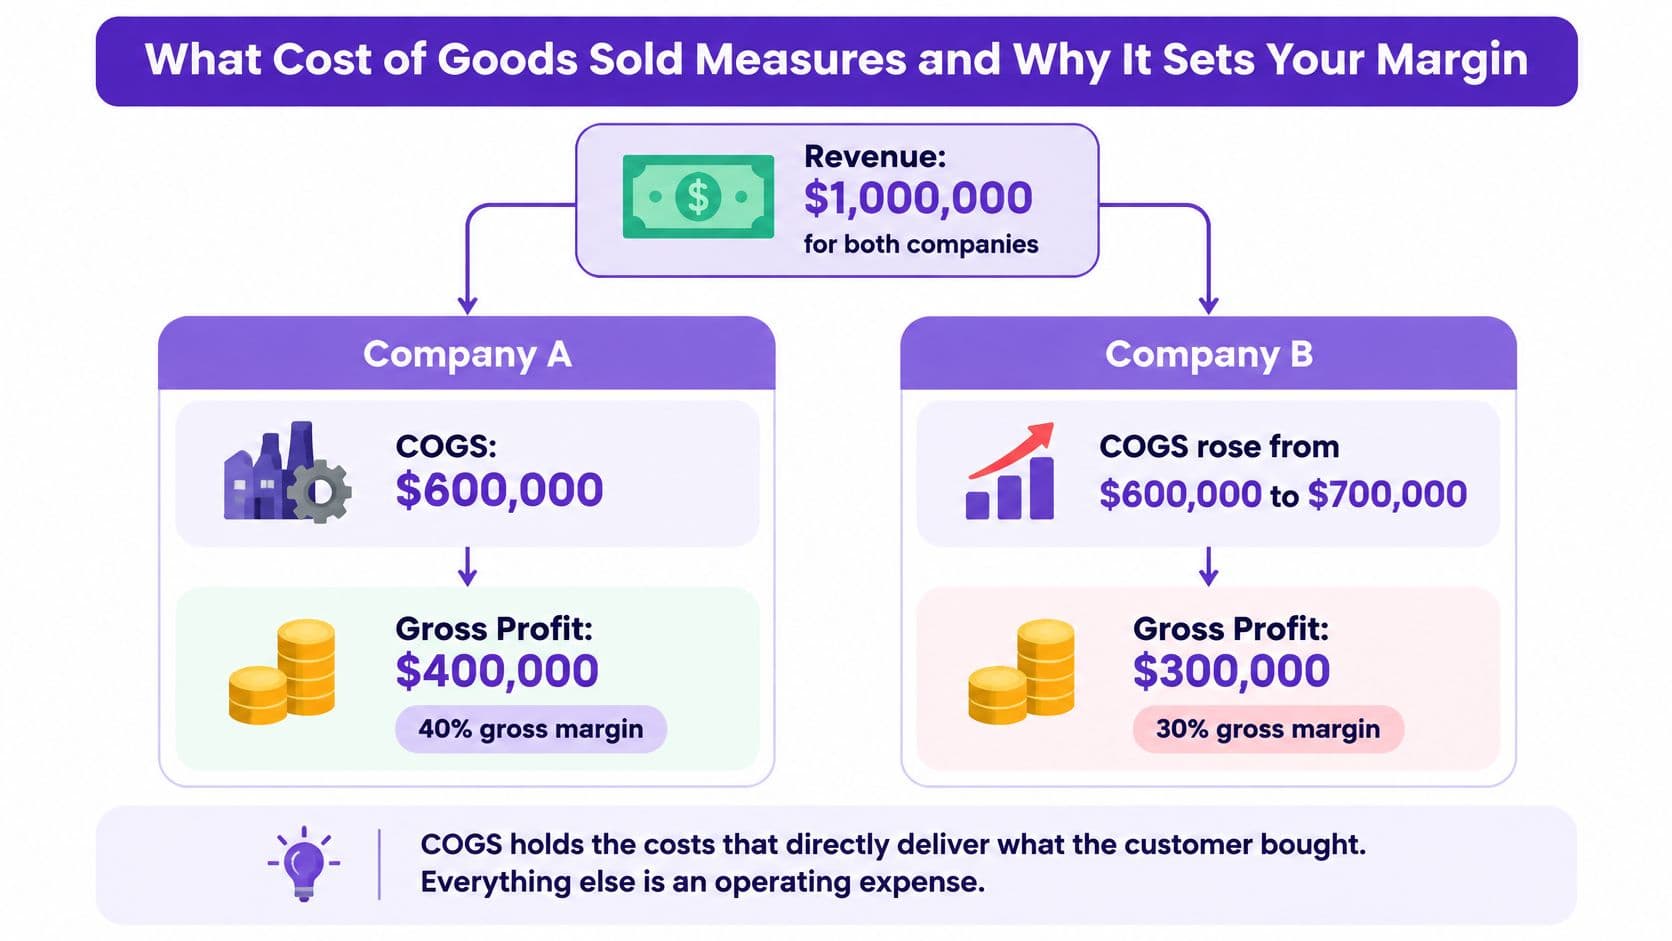
Consider two companies that each bill $1,000,000: one keeps $400,000 after $600,000 in COGS, while the other keeps $300,000 because COGS increased to $700,000, using the illustrative figures accompanying the SEC's beginner's guide to financial statements. Their gross margins are 40% and 30%, respectively, despite identical sales.
COGS measures the amount you assign to what you actually delivered during the reporting period. It isn't every expense involved in running your company, and it isn't a measure of cash leaving your bank account.
The SEC's beginner's guide calls this line “cost of sales” and explains that it represents the cost of producing the goods or services sold.
The income statement follows a useful order:
- Revenue: What you earned from customers.
- COGS: What it cost to produce or deliver that revenue.
- Gross profit: What remains before operating overhead.
- Operating expenses: Marketing, general administration, and other costs of running the business. Interest also comes after gross profit, although it's generally presented separately from operating expenses.
Gross profit isn't gross margin percentage
Gross profit is a dollar amount. Gross margin percentage expresses that amount relative to revenue.
The relationship is:
Gross margin = (Revenue − COGS) ÷ Revenue
This distinction matters when you're deciding whether growth creates enough room to fund your next hire. More revenue doesn't necessarily leave more money available for overhead.
The comparison below shows how delivery costs change the outcome without changing sales.
A bakery makes the distinction tangible. Flour, butter, product packaging, and the baker's production time belong to the loaves sold. Advertising belongs in operating expenses.
Rent requires more care: the production area supports inventory cost, while a retail selling area or administrative office serves a different function. Classify the activity, not just the vendor's name.
When you ask, “What is cost of goods sold?” the practical answer is the cost your sale must cover before you fund the rest of your business. Your pricing and hiring decisions depend on getting that boundary right.
How to Calculate COGS With a Worked Example
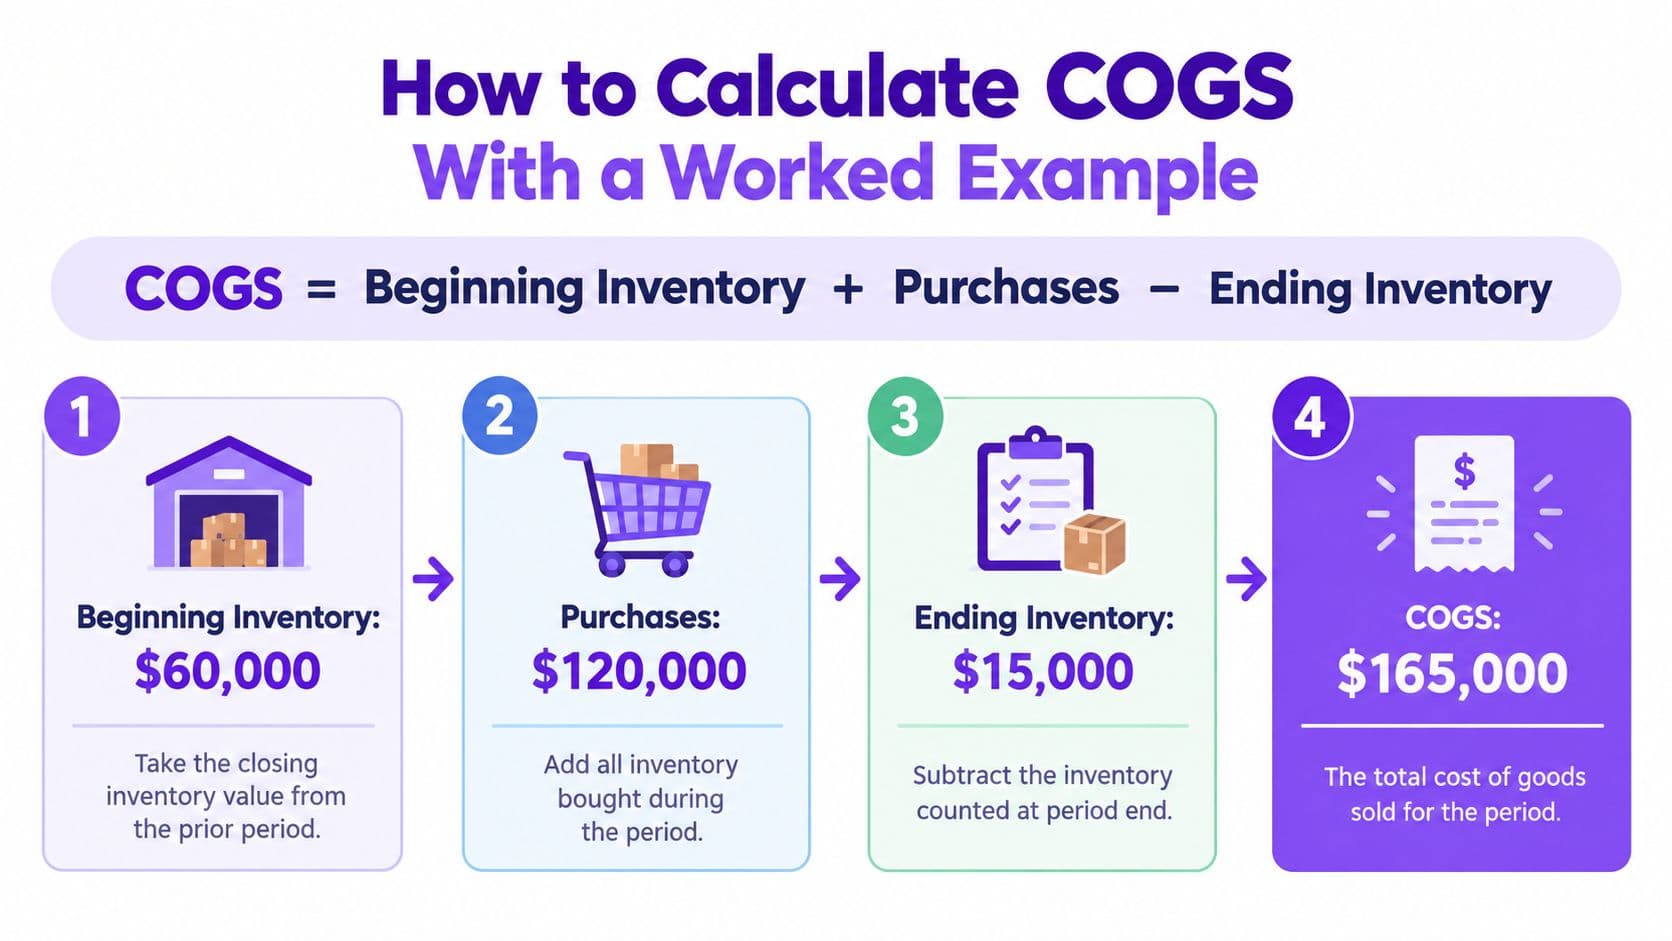
For a product business, start with beginning inventory + purchases − ending inventory. Use inventory values at cost, not retail selling prices.
The IRS's Publication 538 provides the accounting framework for inventory timing; consider a worked scenario with $40,000 in beginning inventory, $180,000 in purchases, and $55,000 in ending inventory, producing $165,000 in COGS. With $300,000 in revenue, that scenario produces $135,000 in gross profit and a 45% gross margin.
Build the calculation from your records
- Pull beginning inventory from the prior close. Use the closing balance sheet and supporting inventory report. Resolve differences before adding current-period activity.
- Add purchases and directly attributable acquisition costs, including applicable inbound freight and duties. Use receiving records as well as invoices so invoice delays don't distort cutoff.
- Calculate goods available for sale. This is the cost you started with plus the cost added during the period.
- Count ending inventory and value it at cost. Separate damaged, missing, and obsolete stock for review.
- Subtract ending inventory. What remains is the cost assigned to goods sold, subject to any necessary inventory adjustments.
- Subtract COGS from revenue to calculate gross profit.
- Divide gross profit by revenue. Format the result as a percentage.
COGS and gross margin calculation for a product business
| Step | Calculation | Result |
|---|---|---|
| 1. Beginning inventory | Balance from prior year-end close | $40,000 |
| 2. Purchases | Supplier invoices received in the period | $180,000 |
| 3. Goods available for sale | $40,000 + $180,000 | $220,000 |
| 4. Ending inventory | Physical count valued at cost | $55,000 |
| 5. Cost of goods sold | $220,000 − $55,000 | $165,000 |
| 6. Gross profit | $300,000 − $165,000 | $135,000 |
| 7. Gross margin | $135,000 ÷ $300,000 | 45% |
The inventory remaining at close is still an asset. Paying suppliers reduces cash immediately; recognizing the cost of unsold goods as an expense follows a different timetable.
Use this visual to follow the inventory formula; the table above contains the worked scenario's inputs.
Keep valuation separate from counting
FIFO and weighted-average costing can assign different values to the same physical count. Select an appropriate method with your accountant, apply it consistently, and document it in your COGS policy.
If inventory changes sharply, investigate receipts, shipments, and count adjustments before releasing the margin report. Don't solve an unexplained difference with a balancing entry.
For a food-product business translating unit costs into customer pricing, Ovenbell's resource can help you build better cookie quotes with Ovenbell. Keep quote assumptions separate from actual costs so you can compare expected margin with delivered margin.
For a video walkthrough of the calculation, use the explanation below.
Which Costs Belong in COGS by Business Model
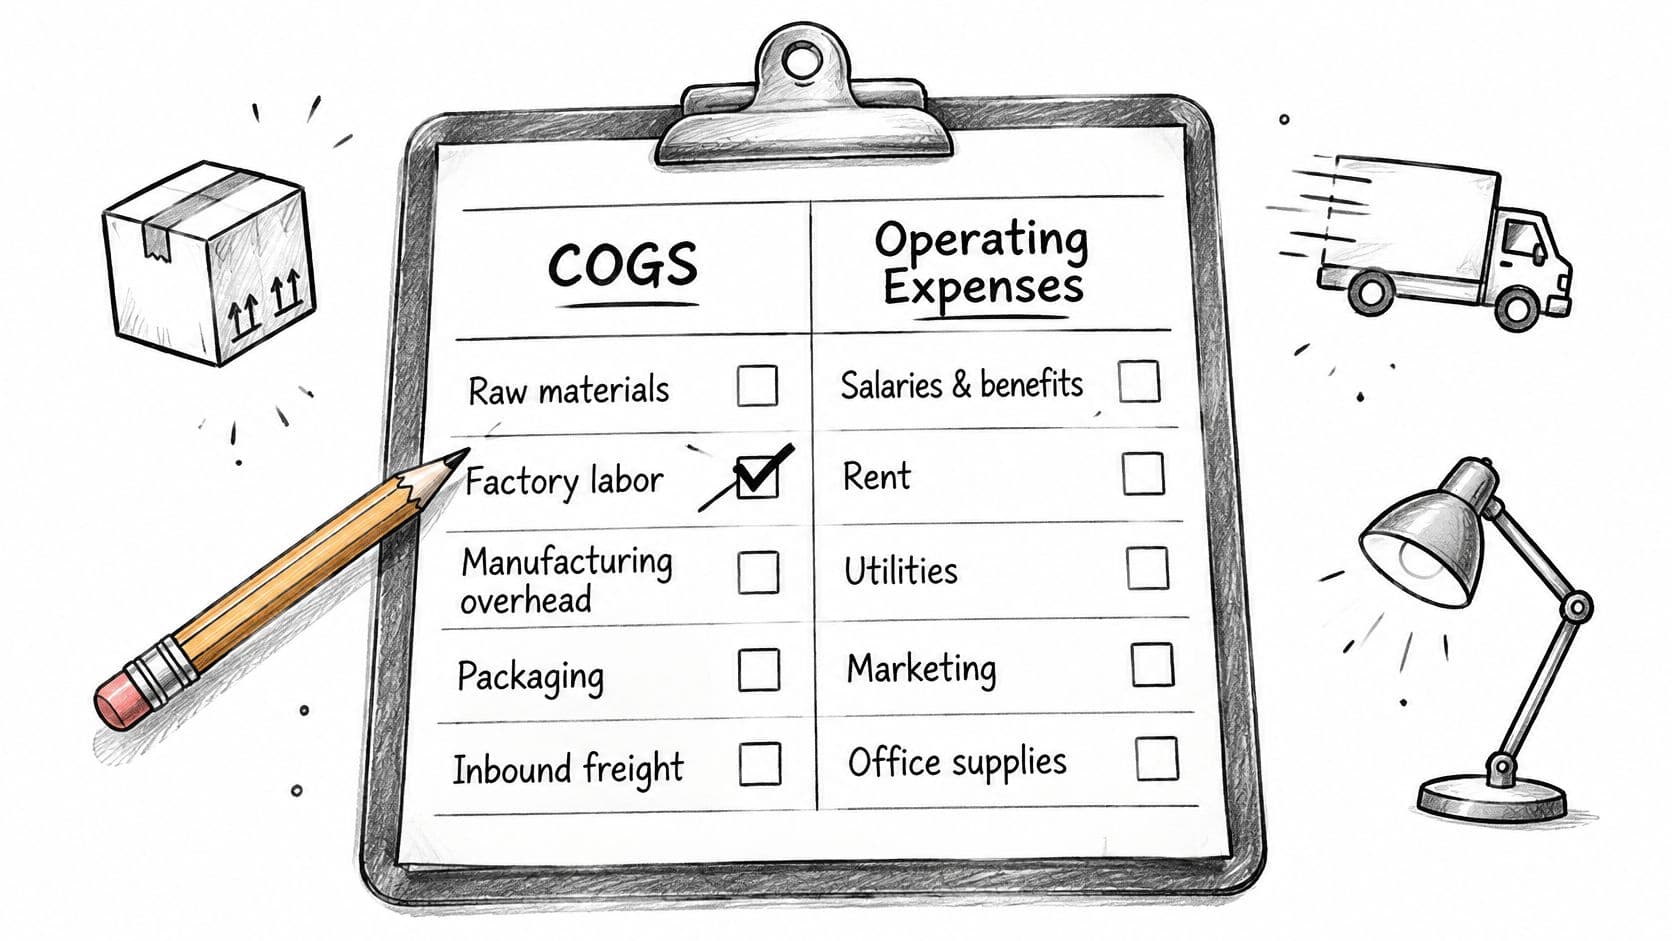
Put production and customer-delivery costs in COGS; put selling, administration, and product-development costs in operating expenses. Then document the exceptions and allocation rules your business needs.
A department name isn't enough. Customer success staff who implement contracted services perform different work from account managers who pursue renewals and expansion.
What sits in COGS by business model
| Model | Typically in COGS | Typically in operating expenses | Margin to watch |
|---|---|---|---|
| E-commerce | Product cost, inbound freight, duties, packaging, fulfillment labor | Paid ads, marketing, storefront software fees | Gross margin after landed cost per order |
| SaaS | Hosting, third-party APIs, payment processing, support payroll, implementation labor | Sales, marketing, product development, G&A | Subscription gross margin |
| Digital agency | Delivery staff salaries, freelancers on client work, delivery-only software | Account management, new business, office costs | Gross margin per client before overhead |
| Professional services | Billable staff time, subcontractors, travel billed to clients | Business development, bonuses not tied to delivery, office costs | Utilization rate and margin per engagement |
These are starting classifications, not substitutes for accounting policy. Split mixed roles using documented responsibilities or time records, and distinguish product packaging from outbound distribution activities.
The payroll line that changes SaaS margin
Using the worked scenario associated with the 2024 JC B2B SaaS Benchmarks, $2,000,000 in subscription revenue less $260,000 in infrastructure, $90,000 in payment fees, and $250,000 in delivery-support payroll produces $600,000 in COGS, $1,400,000 in gross profit, and a 70% gross margin. Moving that payroll below gross profit raises reported margin to 82.5%, a calculated increase of 12.5 percentage points without any improvement in delivery economics.
That's a classification change, not an efficiency gain. Total profit doesn't improve merely because you relocate an expense.
The publication provides industry benchmarking context, but the scenario isn't an industry average. Don't present its example margin as a universal SaaS target.
The illustration below highlights the classification decision behind the calculation.
Apply the same discipline to service delivery
For an illustrative agency engagement, $180,000 billed less $99,000 in delivery labor leaves $81,000 in gross profit, or 45% gross margin. Utilization changes that result when salaried delivery capacity sits idle, so establish a consistent policy for allocating delivery payroll and reporting unused capacity.
Education and training firms face the same payroll issue. Tools that help you calculate instructor pay correctly are useful when they preserve the connection between teaching activity, payroll, and the service delivered.
For inventory, IAS 2 includes purchase costs, import duties, nonrecoverable taxes, transport, handling, direct labor, and production overhead in inventory cost. Production businesses can use our guide to accounting for manufacturing to organize that cost flow.
Revenue recognition under ASC 606 and contract-cost guidance under ASC 340-40 also require attention. Qualifying incremental sales commissions are generally capitalized under contract-cost guidance rather than automatically booked to COGS; not every delivery expenditure qualifies for deferral.
Classification test: Ask what activity the cost supports, then determine when accounting rules require recognition.
Asking whether a cost disappears without a sale helps identify variable delivery costs. It isn't conclusive: fixed support salaries and production overhead can still belong in COGS. Confirm your financial-reporting and tax policies with your CPA because their treatment can differ.
Journal Entries That Record COGS Correctly
Common COGS journal entries
The following hypothetical entries assume even monthly allocation of the annual hosting and support costs, immediate collection of the subscription prepayment, and an inventory count adjustment.
| Event | Debit | Credit | Amount |
|---|---|---|---|
| Purchase inventory, 100 units at $15 | Inventory | Accounts payable | $1,500 |
| Sell those units, cost entry only | COGS: product cost | Inventory | $1,500 |
| Monthly hosting accrual | COGS: hosting | Accounts payable | $21,667 |
| Monthly support payroll accrual | COGS: support payroll | Accrued payroll | $20,833 |
| Annual prepaid subscription billed and collected | Cash | Deferred revenue | $12,000 |
| Monthly release of that subscription | Deferred revenue | Subscription revenue | $1,000 |
| Inventory shrink found at count | COGS: inventory shrink | Inventory | $800 |
Record the activity, not just the payment
Buying inventory creates an asset and a liability. Selling it requires a separate cost entry, in addition to the revenue entry, that transfers its carrying cost from inventory to COGS.
A perpetual inventory system usually generates that transfer automatically. A periodic system requires the closing calculation and adjustment; our guide to inventory accounting explains the underlying records.
For services, accrue hosting and delivery payroll in the period your team consumes those resources. Use actual usage and payroll records where available, not a flat allocation when consumption varies materially.
The example monthly accruals are rounded. True up rounding and estimate differences against actual invoices and payroll records rather than carrying unexplained balances forward.
Separate revenue timing from cost recognition
Collecting an annual subscription in advance doesn't make the whole receipt earned revenue immediately. For a stand-ready service delivered evenly, release deferred revenue over the service period.
Recognize the related delivery costs under the applicable expense or contract-cost rules. Matching doesn't mean you can defer any expense just because management wants a smoother margin.
Keep separate COGS subaccounts for hosting, support, fulfillment, and shrink. A single miscellaneous delivery account prevents you from explaining whether a margin change came from usage, staffing, or inventory loss.
Close in this order:
- Post accruals and adjustments. Include unbilled vendors, earned payroll, and approved inventory losses.
- Reconcile inventory, payables, and accrued balances to the general ledger. Check whether subsequent invoices support your estimates.
- Review gross margin by revenue line. Resolve unusual classifications and cutoff differences before locking the month.
Gross Margin KPIs to Track Each Month
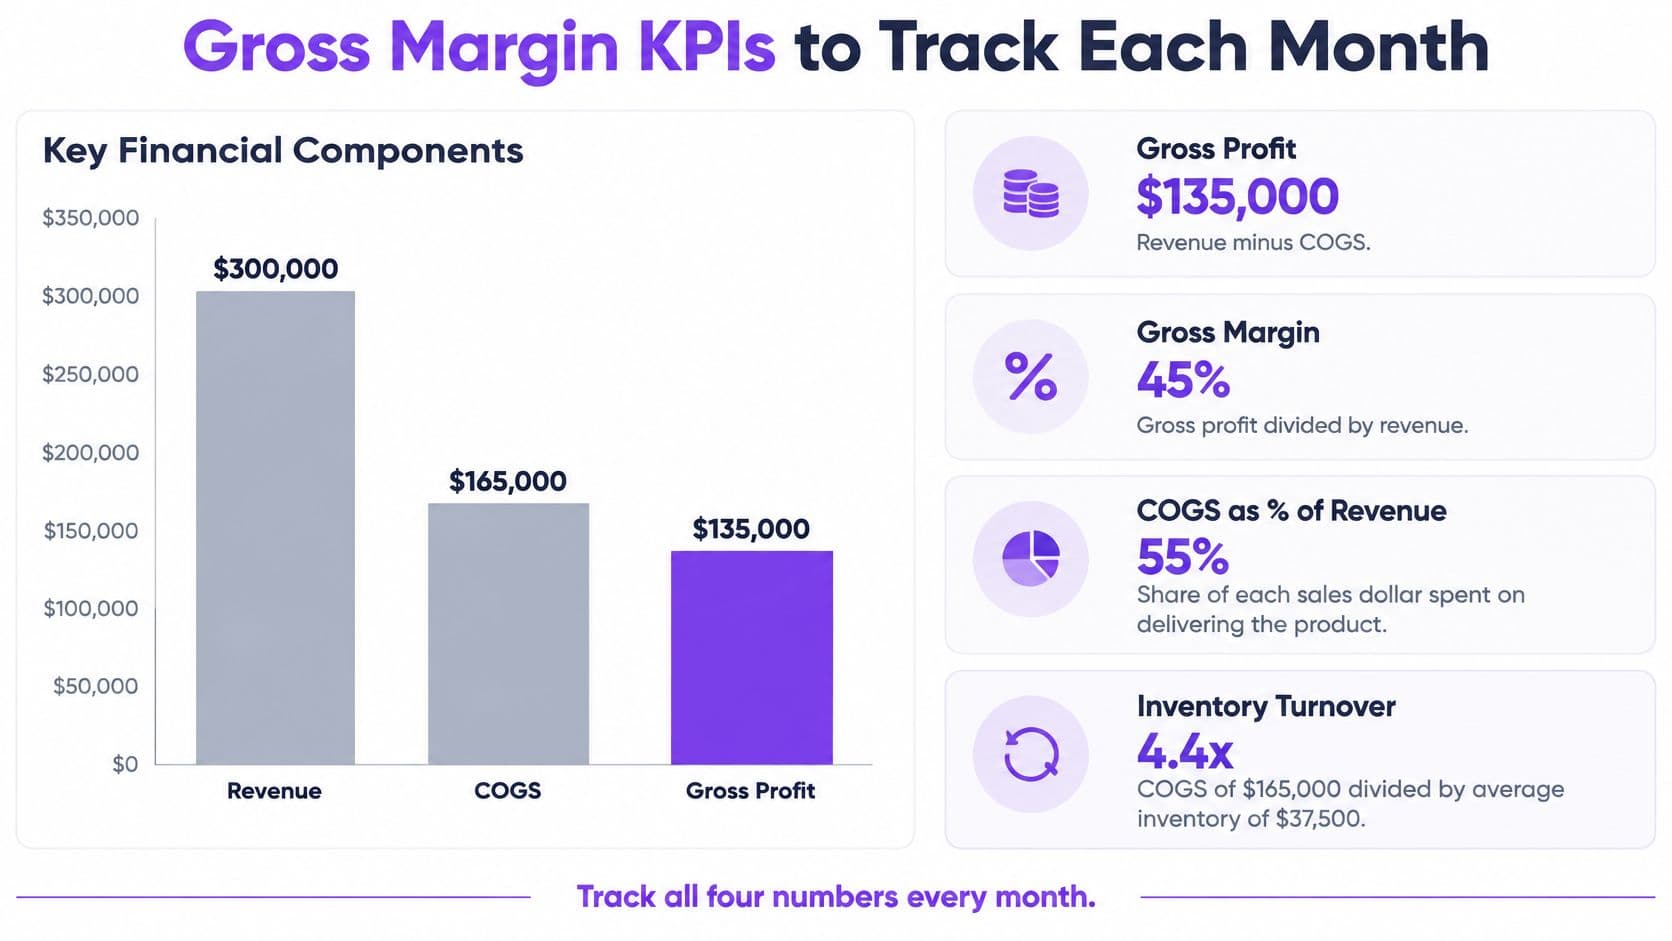
Using the product-business scenario, gross profit is $135,000, gross margin is 45%, COGS represents 55% of revenue, and inventory turnover is approximately 3.47 times, calculated as $165,000 divided by average inventory of $47,500. These are worked-example results, not industry benchmarks.
For SaaS and agencies without merchandise inventory, prioritize delivery margin and capacity or usage measures instead of forcing inventory turnover onto your dashboard. Gross margin comes first because it separates customer-delivery economics from overhead decisions.
Build a review that leads to an explanation
| KPI | What it tells you | What to inspect |
|---|---|---|
| Gross profit | Dollars available before overhead | Revenue growth versus delivery spending |
| Gross margin | Delivery profitability relative to revenue | Pricing, mix, utilization, and classification |
| COGS as a share of revenue | Delivery cost intensity | Vendor usage, staffing, and discounts |
| Inventory turnover | How quickly inventory cost moves through sales | Aging stock, purchasing, and demand |
Use explicit management triggers. For example, investigate a monthly margin decline of at least five percentage points, COGS growing faster than revenue for two consecutive quarters, or slowing turnover alongside rising purchases. These are suggested internal review rules, not published industry thresholds.
Compare each revenue stream or client with its prior three months, and write a variance note for a movement of five points or more under that illustrative policy. State the cause, the owner, and the corrective action.
The visual below summarizes the measures; use the calculation above for this scenario's turnover because the graphic uses a different average-inventory assumption.
Make the reporting handoff auditable
Our margin review handoff from Product to the controller matches inference and hosting costs to the same plan groupings, producing a margin view with variance notes. That prevents a pricing change from being evaluated against costs grouped on a different basis.
The controller's reporting release to the founder packages P&L, cash, runway, ARR movement, and commentary into one approved operating view. Use our guide to calculating gross margin to standardize the calculation across reports.
For acquisition decisions, Product Metrics' explanation of profit-based ad performance helps connect marketing returns to profit rather than revenue alone.
A margin dashboard needs traceable cost lines. Without them, you can't explain the result to your board.
When comparing peers, check whether their published benchmark includes support, implementation, and infrastructure on the same basis. A named report isn't enough if the underlying classifications don't match yours.
Common COGS Mistakes and Red Flags
Treating cash paid as COGS is an expensive mistake. In a hypothetical stock purchase, paying $200,000 and selling goods with an $80,000 carrying cost creates $80,000 of COGS, not an expense equal to the full payment.
Counting errors create a different distortion. Using the inventory calculation described by the IRS's Publication 334, $200,000 in beginning inventory plus $900,000 in purchases less $250,000 in ending inventory gives $850,000 in COGS; understating ending inventory by $50,000 raises COGS to $900,000 and understates gross profit by the same amount.
Classification errors are harder to spot because the books can still balance. Moving delivery-support payroll into administration changes the reported margin without changing the work employees perform.
COGS symptoms, causes and fixes
| Symptom | Likely cause | Fix |
|---|---|---|
| Gross margin jumps with no price change | Support or hosting costs moved below gross profit | Restore the appropriate classification and disclose material changes |
| Cash runs short although margin looks healthy | Purchases sit unsold, so COGS lags cash paid out | Compare purchases, inventory, and COGS each month |
| COGS swings sharply month to month | Inventory counted once a year | Count monthly or maintain perpetual records with cycle counts |
| Margin looks too high against peers | Freight, duties, or fulfillment booked inconsistently | Capitalize qualifying landed costs; classify fulfillment under your policy and correct affected periods |
| Year-end margin differs from monthly reports | Hosting or contractor costs unaccrued at close | Accrue each close and reconcile against the vendor list |
Warning signs that deserve investigation
- Unexplained margin moves: No pricing, customer-mix, usage, or productivity change supports the result.
- Weak inventory evidence: Your team relies on an annual count and doesn't resolve discrepancies during the year.
- Missing accruals: Vendor costs appear only when invoices arrive.
- Inconsistent freight coding: Similar inbound charges land in different accounts.
Use a documented inventory reconciliation to separate count differences from purchasing and cutoff errors.
“We're a service business, so we don't have COGS” confuses terminology with economics. You still pay people, contractors, or infrastructure providers to deliver customer work. Report that delivery cost consistently, even if your income statement calls it cost of services or cost of revenue.
Set Up Accurate COGS Reporting Before Your Next Close
- Write a COGS policy. Map each revenue stream to delivery accounts and allocation rules.
- Reconcile inventory or delivery-cost accounts to the general ledger before closing.
- Accrue unbilled costs. Include hosting, contractors, and fulfillment in the appropriate period.
- Build a monthly margin view by revenue line, with a three-month trend and variance notes.
- Retain support. Keep counts, capitalization decisions, and approvals with your close files.
Use our year-end close checklist to organize supporting records and review responsibilities.
For ongoing ownership, our Controller-led Finance Ops core retainer costs $2,500 per month and includes monthly close ownership, management reporting, and revenue and cost margin review.
For a defined assessment, our Finance Ops Diagnostic costs $3,500, delivered in 5 business days. It maps your stack, spreadsheet dependencies, and unclear ownership or review gaps.
For a first read without a purchase, our free diagnostic asks three questions to name the likely failure point and explain why. No email is required for the first result. Run the free check this week.
Jumpstart Partners provides controller-led close ownership, delivery-cost review, and management reporting so you can explain your gross margin before making pricing or hiring decisions. Visit Jumpstart Partners to start with the free diagnostic and identify where your COGS reporting needs attention.