Financial Operations
What is p and l management: A Founder’s Guide to Profitability
Discover what is p and l management and how to use your profit and loss statement to guide smart decisions that boost profitability.
ByJumpstart Partners, CPA, QuickBooks ProAdvisor
··18 min readAs a founder, you can't run a business on gut feelings. You need a reliable instrument panel, and that’s exactly what Profit and Loss (P&L) management is. It translates complex financial data into a clear story of your company's health, turning reactive firefighting into a proactive strategy for building a profitable, scalable business.
Stop Flying Blind and Start Managing Your Profit
Trying to scale your business without rigorous P&L management is like flying a plane through a storm with no instruments. You might feel like you’re moving forward, but you have no real visibility into your altitude, speed, or direction. This is exactly why so many promising SaaS, agency, and professional services firms stall out—they get caught up chasing revenue and completely lose sight of profitability.
Effective P&L management goes way beyond basic bookkeeping. It's an active, strategic process where you constantly analyze your income statement to make confident decisions on everything from pricing and hiring to major investments. To truly stop flying blind, you need to establish robust metrics and reporting.
This is not a passive, once-a-year task you hand off to your accountant. It's a core leadership function. Your hands-on oversight is what allows you to turn raw financial data into winning strategies that actually work.
“Creating a robust close process is the bedrock of building strategic P&L management in your organization. It helps deliver assurance to your business and unlock value and insights for users in the finance department and beyond.”
— Adam Heeger, Solutions Lead at Numeric
This strategic approach is what's fueling real optimism and results. For instance, 73% of business leaders are expecting revenue increases and 64% project higher profits, driven largely by strategies rooted in P&L analysis, like cost reduction and price adjustments.
This guide is your playbook for moving from gut-feel decisions to data-driven leadership. We’ll show you how to master your P&L to optimize profitability and build a more resilient company. While mastering the P&L is critical, it's only half the picture; you also need a forward-looking view of your cash with tools like a 13-week cash flow forecast.
Decoding Your P&L Statement Line by Line
Your P&L statement tells a story about your business’s performance, but most founders only read the first and last lines. To actually manage profitability, you must understand the narrative in between. It’s not a wall of numbers—it’s a set of strategic levers you can pull to directly influence your bottom line.
Let's break down each key section of the P&L using a hypothetical $2M ARR SaaS company as our guide. This structure is nearly identical for digital agencies and professional services firms, though the specifics of what goes into each category will shift.
Revenue and Gross Profit
The story always starts at the top line: Revenue. This is all the money brought in from sales of your software or services over a specific period, before a single cost is deducted. It's the total value of what you sold.
From there, you immediately subtract the Cost of Goods Sold (COGS), which is often called Cost of Revenue in service businesses. These are the direct costs required to deliver your product or service to a paying customer.
- For a SaaS Company: This includes server hosting fees (like AWS or Google Cloud), third-party software licenses embedded in your product, and the salaries of your customer support and implementation teams. If a cost scales directly with a new customer, it's COGS.
- For a Digital Agency: COGS is primarily the salaries of your client-facing delivery team (e.g., designers, developers, account managers) and any direct software or ad spend costs for client projects.
Subtracting COGS from Revenue leaves you with your Gross Profit. This is a critical health metric. It shows how much money you have left over to run the rest of your business after accounting for the direct costs of servicing your customers.
The infographic below shows how P&L management connects financial data to strategic decisions and, ultimately, business growth.
This illustrates that your P&L data isn't just for accountants; it's the dashboard you use to make informed decisions that drive scalable, profitable growth.
A Worked Example: Gross Profit Calculation
Let's put this into practice. Our hypothetical SaaS company with $2M in annual revenue has the following annual costs directly tied to delivering its service:
- AWS Hosting: $150,000
- Customer Support Team Salaries: $180,000
- Third-Party API/Data Fees: $50,000
| Line Item | Amount |
|---|---|
| Total Revenue | $2,000,000 |
| Less: Cost of Goods Sold (COGS) | ($380,000) |
| Gross Profit | $1,620,000 |
This company’s Gross Profit is $1,620,000. More importantly, its Gross Margin is an impressive 81% ($1,620,000 / $2,000,000). According to OpenView's 2024 SaaS Benchmarks, top-performing SaaS companies have a gross margin of 80% or higher. Our example is right on target.
For a deeper dive into getting these numbers right in the first place, you can learn more about how to prepare financial statements accurately.
Operating Expenses and Net Profit
After calculating Gross Profit, you subtract your Operating Expenses (OpEx). Think of these as the costs to keep the lights on and grow the business—they don't directly scale with delivering the product to a specific customer. OpEx is typically broken into three core departments:
- Sales & Marketing (S&M): This bucket includes salaries for your sales reps and marketing team, advertising spend, conference costs, and your CRM subscription. It's the cost of acquiring customers.
- Research & Development (R&D): This is the cost of building and improving your product—primarily the salaries of your engineers, product managers, and designers. It's the cost of innovation.
- General & Administrative (G&A): This covers all other operational overhead needed to run the company. It includes executive salaries, finance, HR, rent, and legal fees.
Subtracting total OpEx from your Gross Profit reveals your Operating Income (or Loss). This shows the profitability of your core business operations. After accounting for a few non-operating items like interest and taxes, you finally arrive at your Net Income—the true "bottom line."
The P&L Metrics That Actually Drive Growth
Vanity metrics might feel good, but they don't build a sustainable company. Real P&L management is about digging past surface-level numbers to find the handful of KPIs that signal true financial health and a scalable business model.
For you as a leader of a SaaS or service-based business, this means getting obsessive about a few critical profit margins. These aren't just figures for a report—they're diagnostic tools. They tell you exactly where your business model is working and where it's bleeding cash.
Gross, Operating, and Net Profit Margins
Think of these three margins as telling a cascading story about your company’s performance. Each one peels back a different layer of your operational efficiency, and watching them together gives you the complete picture of your financial health.
1. Gross Profit Margin
This is the first—and most important—health check for your core business model. It shows you exactly how much profit you squeeze from each dollar of revenue after subtracting the direct costs of delivering your service (your COGS).
A low gross margin is a massive red flag. It’s a direct signal that your pricing is too low or your delivery costs are way too high.
Worked Example: A digital agency brings in $1,000,000 in revenue. Their COGS (client-facing team salaries, project software) totals $400,000, leaving them with a Gross Profit of $600,000.
Calculation: (
$600,000/$1,000,000) = 60% Gross Profit Margin
A healthy gross margin is non-negotiable. If you're not sure how to dial this in, we break it down in our guide on how to calculate gross margin.
2. Operating Profit Margin
This metric gets to the heart of your company's core operational profitability. It tells you how much you earn from each dollar of revenue after paying for both COGS and all your operating expenses (OpEx)—think sales, marketing, R&D, and G&A salaries.
It’s the purest measure of your operational efficiency, showing how well the business runs before you factor in things like interest and taxes.
3. Net Profit Margin
This is the final word on profitability—your true "bottom line." It’s the percentage of revenue left after every single expense has been paid, including COGS, OpEx, interest, and taxes.
While operating margin reveals how well you run the business, net margin shows how much actual cash it puts back into your company's pocket.
Essential P&L Metrics and Industry Benchmarks
Knowing your own numbers is only half the battle. To truly understand your performance, you must compare your key P&L metrics against industry benchmarks. This is how you gauge whether your "good" margin is actually lagging behind the competition or leading the pack.
This table compares typical benchmarks for SaaS and Digital Agencies:
| Metric | Healthy SaaS Benchmark (Source: OpenView) | Healthy Agency Benchmark | How to Calculate |
|---|---|---|---|
| Gross Profit Margin | 75% – 85%+ | 40% – 60%+ | (Revenue - COGS) / Revenue |
| Operating Margin | 10% – 20%+ | 15% – 25%+ | (Operating Income) / Revenue |
| Net Profit Margin | 10%+ | 15%+ | (Net Income) / Revenue |
If your numbers are falling short of these benchmarks, it's a clear signal to act. A low gross margin means it’s time to raise prices or renegotiate vendor contracts. A weak operating margin points to bloated G&A or inefficient ad spend. For example, if your marketing budget is out of control, you need to start measuring marketing ROI to justify the spend.
These benchmarks are not just arbitrary goals; they represent the efficiency required to build a resilient, profitable business that can thrive in any economic climate.
Building a Proactive Budget and Forecast
Your P&L shouldn't just be a report card on what already happened. The real power comes when you use that historical data to build a roadmap for the future—a proactive budget and forecast that turns your P&L from a rearview mirror into a GPS for your business.
Too many founders treat budgeting as a restrictive, once-a-year chore. But a static budget is useless for a growing company. You need a living, breathing financial plan that connects your operational goals directly to your numbers.
From Static Budget to Dynamic Forecast
A traditional annual budget sets fixed spending limits for the year, and that’s about it. It becomes outdated the moment market conditions shift, a new competitor emerges, or your sales cycle shortens. A rigid budget forces you to make today's decisions based on assumptions from six months ago.
A rolling forecast, on the other hand, is a living document. It projects forward 12 or 18 months and gets updated every single month or quarter. As one month closes, you add a new month to the end. This constant refresh gives you a current, forward-looking view of your business—an absolute non-negotiable for SaaS and service companies navigating rapid change.
Tying Your Budget to Business Drivers
The most common pushback on forecasting is, "It's just guessing." That's only true if your forecast is a bunch of numbers pulled out of thin air. A powerful forecast is not built on wishful thinking; it’s built on the real-world operational drivers that actually move the needle in your business.
“Forecasting isn't about predicting the future with a crystal ball. It’s about understanding the cause-and-effect relationships in your business so you can model different scenarios and make smarter, faster decisions.”
— David Vranicar, CEO of Jumpstart Partners
Instead of just guessing a revenue number, you build it from the ground up using the metrics that run your company. For a SaaS business, the revenue forecast is not one number; it's a calculation based on specific, measurable inputs from sales and marketing.
Worked Example: A SaaS Company's Revenue Forecast
Let's say your goal is to add $50,000 in new Monthly Recurring Revenue (MRR) next quarter. Here’s how you build a driver-based forecast to figure out exactly what it will take:
- Start with the goal: Add $50,000 in new MRR.
- Calculate required new customers: If your Average Revenue Per Account (ARPA) is $2,500/month, you need to sign 20 new customers ($50,000 / $2,500).
- Determine needed sales opportunities: With a 25% sales close rate, your team needs to generate 80 qualified opportunities (20 customers / 0.25 close rate).
- Forecast required marketing leads: If your lead-to-opportunity conversion rate is 10%, marketing needs to deliver 800 qualified leads (80 opportunities / 0.10 conversion rate).
Suddenly, your P&L is directly connected to your sales and marketing operations. You now have a clear plan and can build a budget around the exact activities needed to generate those 800 leads. If lead volume is down in month one, you know you’re already at risk of missing your revenue target and can take action immediately—not three months later when it’s too late.
To get even more control, you need to learn how to define operating budgets that align with these drivers.
Financial Warning Signs You Cannot Afford to Ignore
Your P&L is more than just a report card—it’s an early-warning system. It flashes warning signs long before a real crisis hits, but only if you know how to read them. Ignoring these signals is how seemingly healthy companies end up in a nosedive.
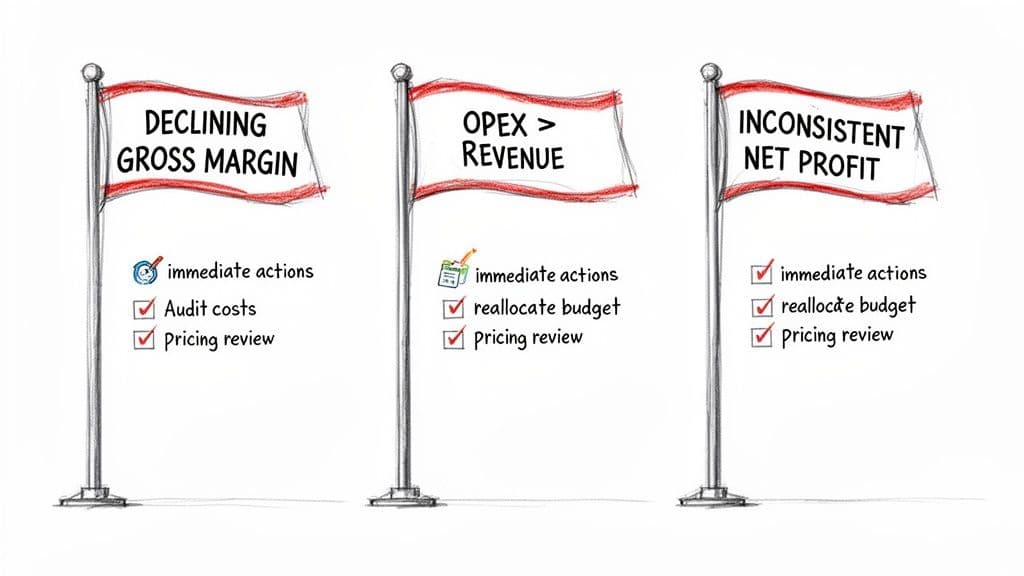
Smart P&L management is all about spotting these red flags early. Let's walk through the most critical ones and what you need to do—immediately.
1. Declining Gross Margin
This is the canary in the coal mine for your business model. When your gross margin percentage starts to shrink—even while revenue is climbing—it means your core operation is getting less profitable with every sale. It’s a direct hit to your company’s fundamental health.
The problem is almost always one of two things: your costs are rising or your pricing is wrong.
Your Action Plan:
| Action | What to Do Now |
|---|---|
| Investigate COGS Creep | Dig into your hosting bills, third-party software fees, and direct labor costs. Is it time to renegotiate with vendors or find more efficient delivery methods? |
| Analyze Your Pricing | If costs are stable, the issue is your price. You are under-charging. Look at what competitors charge and, more importantly, the value you deliver. You have more pricing power than you think. |
2. Operating Expenses Growing Faster Than Revenue
This is the classic growth trap. It happens when you’re spending more and more to acquire each new dollar of revenue, a path that’s completely unsustainable. This problem usually shows up as ballooning Sales & Marketing or G&A expenses that outpace your top-line growth.
A common mistake is throwing money at marketing channels without demanding a return. If your ad spend as a percentage of revenue jumps from 15% to 25% but doesn't produce a matching lift in qualified leads, you have a major leak in your budget.
Your Action Plan:
| Action | What to Do Now |
|---|---|
| Audit Departmental Spending | Compare every department's spending against your forecast. Pinpoint exactly where the overages are, line by line. |
| Demand ROI Justification | Scrutinize all major expenses, especially in marketing. If a channel isn't performing, be ruthless. Cut the spend and reallocate it to a channel that actually works. |
3. Inconsistent or Negative Net Profit
Erratic swings in your bottom line—or worse, consistent net losses—are a sign that something is fundamentally broken in your business model. A single bad month can be a blip. A trend of unpredictable profitability means you’re not building a stable financial foundation. You're just gambling.
Your Action Plan:
| Action | What to Do Now |
|---|---|
| Conduct a Top-to-Bottom Review | Compare your P&L to your budget, line by line, for the last 6-12 months. Find the specific expense lines driving the volatility. |
| Stress-Test Your Forecast | Build out best-case, expected-case, and worst-case scenarios to understand your financial resilience and define your break-even point. This level of P&L management is non-negotiable for long-term survival. |
Why Your P&L Is Inaccurate and How to Fix It
An inaccurate P&L is worse than no P&L. It’s a map that shows you a clear road, but the road leads off a cliff. When you make critical decisions on hiring, pricing, or new investments based on flawed financials, you aren’t just guessing—you’re actively steering your company in the wrong direction with a dangerous sense of false confidence.
For many founders, the P&L is a minefield of messy bookkeeping, incorrect revenue recognition (a nightmare for SaaS companies under ASC 606), and painful delays in closing the books. Making strategic choices with data that’s six weeks old isn't strategy; it's archaeology.
The Real Cost of Inaccuracy
This problem is much bigger than a few reporting errors. An untrustworthy P&L absolutely kills investor confidence, turns audits into a forensic investigation, and masks serious operational bleed like sinking margins or runaway department spending.
It forces you to live in reactive mode, constantly putting out fires instead of proactively building the future.
"An accurate, timely P&L isn't a 'nice-to-have' for audits; it's the most critical tool a CEO has for making smart, strategic decisions week in and week out. Without it, you’re flying blind."
— David Vranicar, CEO of Jumpstart Partners
Fixing this demands a real commitment to financial discipline. The goal isn’t just accuracy, but speed: you need rigorous processes that guarantee an auditable, 5-day month-end close.
Your Path to an Accurate P&L
Achieving a fast, reliable close isn't about working harder—it's about working smarter with standardized, repeatable processes. Here are the non-negotiable steps to get there:
| Step | Action Required | Why It Matters |
|---|---|---|
| 1. Standardize Your Chart of Accounts | Every single transaction must be categorized correctly and consistently. No exceptions. | This is the bedrock of accurate reporting. Without it, your numbers are meaningless. |
| 2. Automate Everything Possible | Use software to automate reconciliations for banks, credit cards, and payment processors like Stripe. | This eliminates manual data entry, the primary source of human error, and speeds up your close. |
| 3. Implement a Close Checklist | Create a documented, step-by-step process that your finance function follows religiously every month. | This ensures consistency, accountability, and a timely close you can depend on. |
This isn’t just about having clean books for your accountant. It’s about building investor-ready financials that give you the confidence to lead and the hard data to back up your vision.
For most companies, the journey starts by cleaning up the past. A professional QuickBooks cleanup service can wipe the slate clean and establish the solid foundation you need to move forward.
Your P&L Management Questions, Answered
Let's cut through the noise. Here are straight answers to the most common questions founders have about turning their P&L from a historical document into a strategic tool.
How often should I actually look at my P&L?
You need to review your P&L every single month, no exceptions. This isn't a casual glance; it's part of a formal month-end close process. A monthly review is the only way to spot dangerous trends, see how you’re tracking against your budget, and make adjustments before it’s too late.
If you’re waiting until the 20th of the next month to see last month's numbers, the data is already stale. A swift 5-day close is the gold standard because it means the information is still fresh enough to act on.
What’s the real difference between a P&L and a Cash Flow Statement?
Think of it this way: your P&L shows if your business model is profitable, while your Cash Flow Statement shows if you have enough cash to survive. They answer two totally different, but equally critical, questions.
The P&L matches revenues with the expenses used to earn them (accrual accounting), giving you a picture of profitability over a period. The Cash Flow Statement is brutally simple—it tracks the actual cash moving in and out of your bank accounts. It’s entirely possible to have a wildly profitable P&L but still go bankrupt because all your cash is tied up in unpaid invoices. You absolutely need both to get the full story.
Can't I just use QuickBooks to manage my P&L?
Using software like QuickBooks is a great start—it’s the place your data lives. But it only generates reports; it doesn't manage anything for you. Clicking "run report" is not P&L management.
True P&L management is a strategic function. It requires expert bookkeeping to ensure the data is accurate in the first place, applying the right accounting standards (like ASC 606 for SaaS revenue recognition), and then deep analysis to turn raw numbers into action. As a business scales past the $500K revenue mark, founders find they need professional support to ensure the numbers are right and to get the strategic insights that software alone can't provide.
Ready to stop flying blind and start making data-driven decisions with a clear, accurate P&L? The expert CPA-certified team at Jumpstart Partners delivers investor-ready financials with a 5-day close, guaranteed.