Financial Operations
Customer Churn Rate: How to Calculate It with Examples
Calculate customer churn rate for logos, MRR and cohorts, with worked examples, SaaS benchmarks by ARR band and a diagnostic plan for finance teams.
ByJumpstart Partners, CPA, QuickBooks ProAdvisor
··18 min readThe most popular advice about customer churn rate is also the least useful: find a good industry average and stay below it. A blended percentage won't tell you whether you're losing replaceable small accounts, watching major customers downgrade, or paying salespeople to replace revenue you already had.
For founders and finance leaders running SaaS companies, digital agencies, and professional services firms, the better question is which customers and dollars disappeared, from which starting group, over what period? Your customer count can fall while recurring revenue grows. Your customer count can also look stable while your most valuable contracts shrink.
Table of Contents
- Customer Churn Rate Formulas With Worked Numbers
- Why Retention Moves Profit More Than Acquisition
- Which Churn Metric to Report for Each Decision
- Monthly, Annual and Cohort Calculations Done Right
- Benchmarks by Business Type and ARR Band
- Root Causes, Red Flags and the Fix for Each
- Confirm Your Churn Numbers Before You Act
Customer Churn Rate Formulas With Worked Numbers
Customer churn rate is the share of customers, or of recurring revenue, lost during a defined period. Strictly speaking, customer or logo churn measures accounts, while revenue churn measures dollars. Keep those labels separate in your reporting.
Consider a hypothetical SaaS company that starts March with 200 customers and $100,000 in monthly recurring revenue (MRR). During March, it loses eight customers representing $4,000 MRR. Other customers downgrade, removing $1,000 MRR, while upgrades from existing customers add $3,000 MRR.
Those events produce four different, equally valid measures.
Churn formulas with one worked example
| Metric | Formula | What it tells you |
|---|---|---|
| Logo churn | Lost customers ÷ starting customers × 100. 8 ÷ 200 × 100 = 4.0% | How many accounts you lose |
| Gross MRR churn | (Churned MRR + contraction MRR) ÷ starting MRR × 100. ($4,000 + $1,000) ÷ $100,000 × 100 = 5.0% | Recurring revenue lost before expansion |
| Gross revenue retention | 100% − gross MRR churn. 100% − 5.0% = 95.0% | Share of starting revenue you keep without upsells |
| Net revenue retention | (Starting MRR − churned MRR − contraction MRR + expansion MRR) ÷ starting MRR × 100. ($100,000 − $4,000 − $1,000 + $3,000) ÷ $100,000 × 100 = 98.0% | Whether the existing base grows on its own |
Logo churn
8 ÷ 200 × 100 = 4.0%
Gross MRR churn
($4,000 + $1,000) ÷ $100,000 × 100 = 5.0%
Gross revenue retention (GRR)
100% − 5.0% = 95.0%
Net revenue retention (NRR)
($100,000 − $4,000 − $1,000 + $3,000) ÷ $100,000 × 100 = 98.0%
Keep the starting group intact
The governing rule is simple: use the starting count or starting MRR of the same customer group as your denominator. Customers acquired during March don't enter these retention calculations, and neither does their revenue.
The example's existing customers finish March contributing $98,000 MRR. New sales would increase total company MRR, but they wouldn't improve the retention result.
For an agency, use recurring retainers rather than mixing retainers with one-off project invoices. For a professional services firm, define when an ongoing client relationship ends. A successfully completed fixed-scope engagement isn't automatically a failed renewal.
Practical rule: Freeze your opening customer list before calculating losses. Otherwise, new business can disguise deterioration in the customers you already served.
Pull the starting balances, cancellations, downgrades, and expansion for your last full month. Run all four formulas before comparing your business with any benchmark.
Why Retention Moves Profit More Than Acquisition
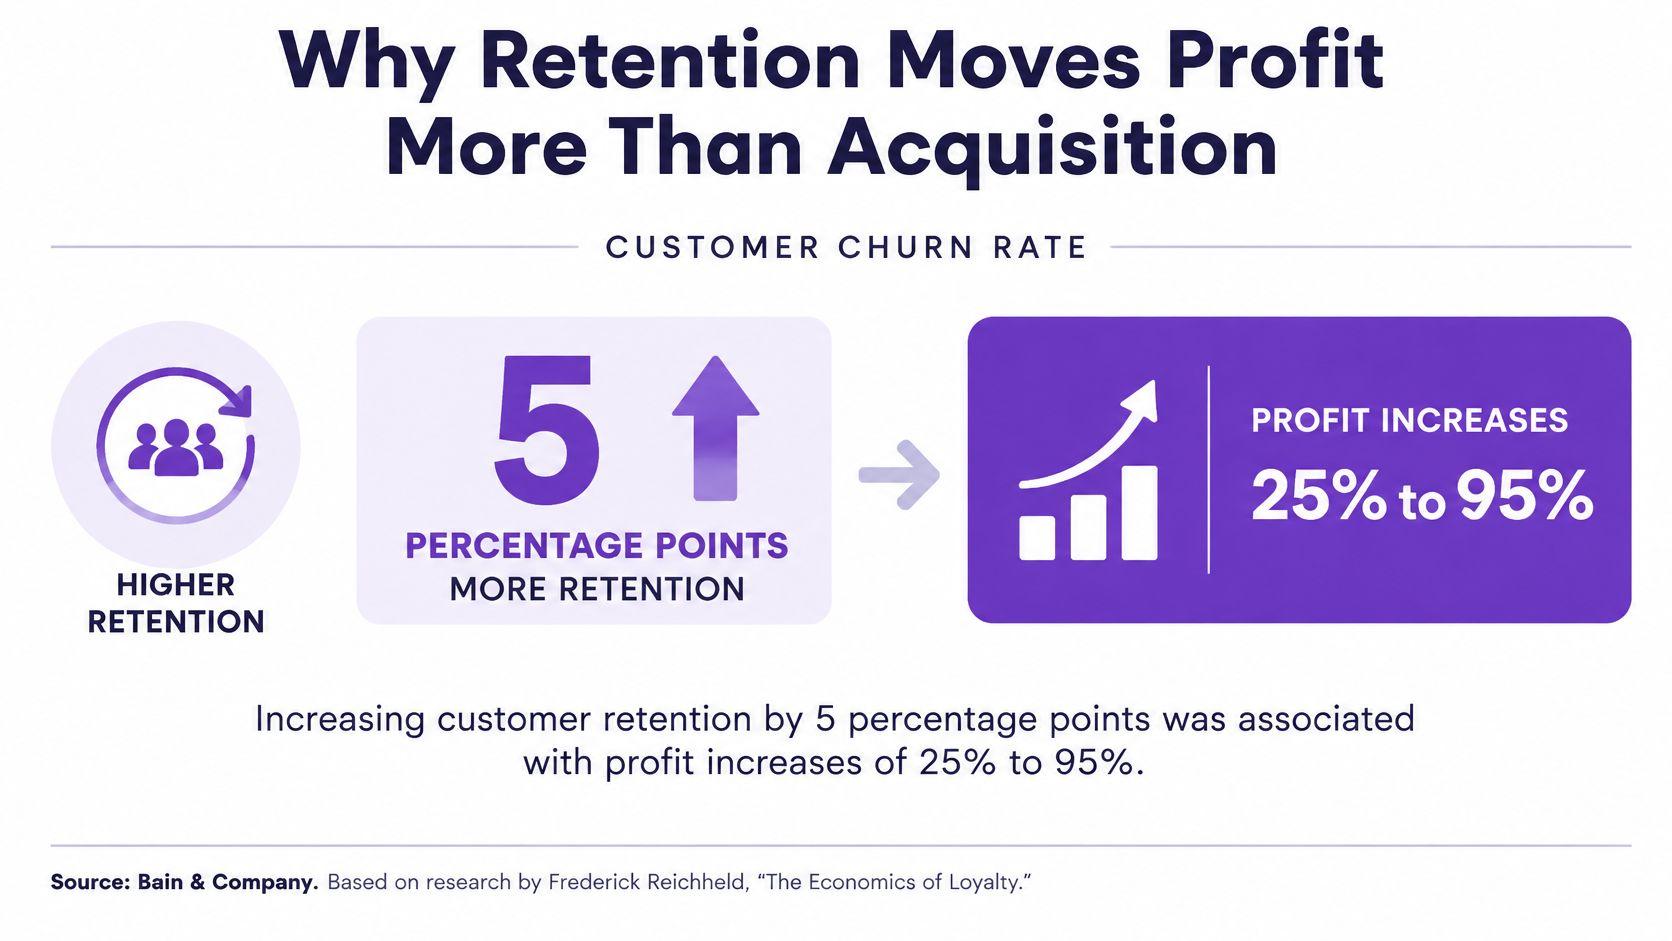
A 5% increase in customer retention was associated with profit increases of 25% to 95% in historical cross-industry analysis described in Bain & Company's published Loyalty Rules! chapter, associated with Frederick Reichheld's customer-retention work. Reported examples included estimated profit increases of 85% at a bank branch system, 50% at an insurance brokerage, and 30% at an automobile-service chain after customer defections fell by 5%.
The mechanism matters more than the headline. Acquisition spend is already incurred for customers who stay; retained accounts can keep purchasing while onboarding and service effort often falls as the relationship matures. A company can lose customers every month and still grow recurring revenue when expansion from the remaining base outruns the dollars leaving, but a blended churn percentage can hide that movement because logo counts, MRR dollars, cohorts and contract sizes produce different denominators.
Translate retention into your revenue bridge
Take a hypothetical business with $100,000 MRR and 3% monthly revenue churn. It must replace $3,000 MRR merely to restore its starting revenue.
Reducing that churn to 2% preserves $1,000 MRR at the same opening balance:
$100,000 × (3% − 2%) = $1,000 MRR preserved
$1,000 × 12 = $12,000 in annualized recurring revenue preserved
That $12,000 is an ARR run-rate equivalent, not twelve months of cash already collected and not profit. Delivery costs, the timing of retention improvements, and subsequent customer behavior still matter.
New bookings that only replace lost revenue represent replacement work, not expansion of your recurring revenue base.
Your acquisition analysis should therefore sit beside your retention analysis. Use a consistent method for calculating customer acquisition cost, then assess whether retained customers generate enough contribution to repay that investment.
The commercial handoffs deserve attention too. Revenue Nomad's explanation of how revenue operations impacts pipeline conversion provides useful context for connecting acquisition promises with post-sale delivery.
Don't turn the Bain range into an investor promise. Measure the incremental gross profit your own retention work produces, including the cost of account management, discounts, and support.
Which Churn Metric to Report for Each Decision
Low logo churn doesn't prove retention is healthy. You can retain nearly every account while a major customer removes seats, reduces its retainer, or drops a service line. Conversely, losing smaller customers doesn't necessarily stop the remaining customer base from expanding.
The contract-size distinction is material. MarketSplash's customer churn statistics compilation reports median NRR of 98% for annual contracts below $12,000, compared with 106% for contracts above $250,000. These aren't interchangeable operating targets: the underlying account economics and expansion opportunities differ.
Match the measure to the decision
- Weekly operating fixes: Lead with logo churn and gross MRR churn. Segment by plan, tenure, and acquisition channel so the responsible team can identify onboarding failures, downgrades, and poor-fit sales.
- Revenue forecasting: Lead with GRR and show NRR beside it. Segment by contract value, separating the revenue you retain without expansion from the expansion assumptions your forecast requires.
- Fundraising and due diligence: Lead with NRR by cohort vintage, meaning the period when customers joined. Include GRR and logo churn so investors can distinguish expansion from durable retention.
- Investor reporting: Show GRR and NRR on a trailing twelve-month basis, supported by logo churn, customer counts, and the relevant observation dates.
A single blended rate removes information you need to make those decisions. An improving company-wide result can reflect a shift toward larger contracts rather than better retention within either contract-size group.
Account growth and revenue growth aren't the same
Change one assumption in the hypothetical March example: existing-customer expansion is $7,000 rather than $3,000. The company still loses eight accounts, but its starting customer base ends with:
$100,000 − $4,000 − $1,000 + $7,000 = $102,000 MRR
$102,000 ÷ $100,000 × 100 = 102% NRR
Customer count falls while existing-customer revenue grows. That isn't a contradiction. It means expansion exceeds cancellations and contraction.
It also doesn't justify ignoring the lost accounts. You still need to know whether those departures reflect an intentional customer mix or a worsening acquisition channel.
Use a consistent GRR versus NRR reporting framework so your sales, customer success, and finance teams aren't using different definitions of retained revenue.
Reporting rule: show logo churn alongside GRR and NRR, segment the results, and state the period. Present the components as well as the headline, especially when a small number of customers account for a large share of revenue.
Monthly, Annual and Cohort Calculations Done Right
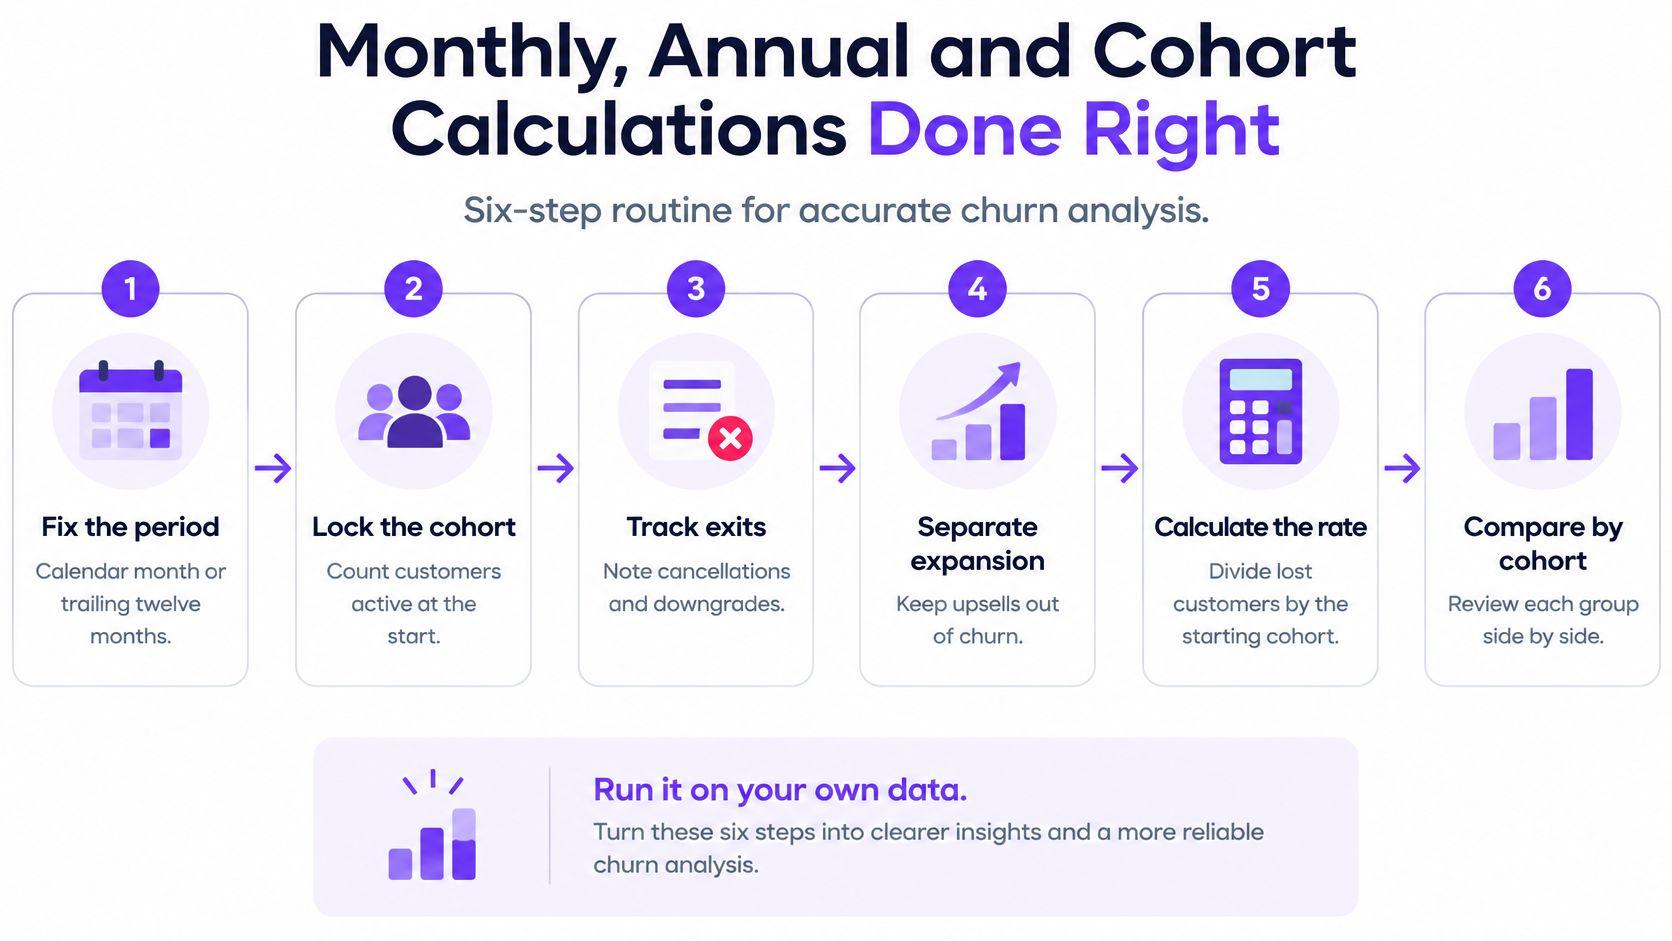
Use a repeatable calculation routine rather than rebuilding the denominator whenever someone requests a dashboard.
- Fix the period. Choose a calendar month or trailing twelve months. Document whether a cancellation counts when notice arrives or when recurring service ends.
- Lock the cohort. Count customers active on the first day. Exclude subsequent signups from that group's retention calculation.
- Track exits from that group. Include cancellations and failed-payment exits classified as involuntary churn. Track downgrades separately because they reduce revenue without necessarily removing a customer.
- Calculate logo churn. Divide lost customers by starting customers and multiply by 100.
- Annualize with compounding. For a constant monthly churn rate, use 1 − (1 − m)^12, where m is the monthly rate expressed as a decimal.
- Roll the annual window forward. Recalculate actual trailing twelve-month churn using the customers active twelve months earlier and the losses from that starting group.
Use the visual workflow as a reminder to keep account exits, revenue changes, and cohort comparisons distinct.
Annualized churn isn't monthly churn multiplied
For a hypothetical constant 3.9% monthly churn rate, the annualized calculation is:
1 − (1 − 0.039)^12 ≈ 37.9%
Simple multiplication gives 3.9% × 12 = 46.8%, which overstates cumulative churn from the original customer group. Each month's losses apply to the customers still remaining, not repeatedly to the original total.
An annualized rate is also not an observed annual result. It assumes the monthly rate stays constant. For board reporting, label projections as annualized and use actual cohort losses for historical annual churn.
Cohort of 200 customers over the first four months
Consider a hypothetical January cohort. No later signups enter this table.
| Month | Customers lost | Monthly logo churn |
|---|---|---|
| Month 1 | 8 | 8 ÷ 200 × 100 = 4.0% |
| Month 2 | 6 | 6 ÷ 192 × 100 = 3.1% |
| Month 3 | 5 | 5 ÷ 186 × 100 = 2.7% |
| Month 4 | 4 | 4 ÷ 181 × 100 = 2.2% |
The cohort finishes with 177 customers:
200 − 8 − 6 − 5 − 4 = 177
177 ÷ 200 × 100 = 88.5% cumulative retention
Don't add the rounded monthly churn percentages to calculate cumulative losses. Use the original starting count and actual surviving customers.
This example's falling monthly churn indicates stabilization within the cohort, although the shrinking customer count also makes individual departures more influential. Flat or rising churn after the early onboarding period warrants investigation, not an automatic conclusion that your product has failed.
For agencies, annotate renewal dates and planned engagement completions. For SaaS, annotate onboarding milestones and billing changes. Apply a consistent SaaS cohort analysis method, then build the same table for your last two cohorts and compare them at equal customer ages.
Benchmarks by Business Type and ARR Band
Compare the same metric, observation window, and denominator. A customer churn benchmark doesn't substitute for GRR, and monthly-billed subscriptions don't represent every annual-contract SaaS business.
Subjolt's SaaS churn rate guide summarizes a 2025 dataset reporting 38% annual churn for monthly-billed SaaS subscriptions observed from September 2024 through August 2025, equivalent to approximately 3.9% compounded monthly churn. It also describes a survey of more than 800 SaaS founders and executives reporting 92% median GRR below $1 million ARR, and a billing-data study of more than 2,100 SaaS businesses reporting 53% median retention below $300,000 ARR over the twelve months ending March 2023.
Read each figure against the sample that produced it before placing your own number beside it.
Churn and retention benchmarks by segment and ARR band
| Segment | Metric | Benchmark | What it means |
|---|---|---|---|
| Private B2B SaaS, all sizes | Median GRR | 91%, summarized by MarketSplash | Revenue retained before expansion |
| Private B2B SaaS, all sizes | Median NRR | 101%, summarized by MarketSplash | A median company can lose customers and still grow recurring revenue |
| Annual contracts below $12,000 | NRR | 98%, summarized by MarketSplash | The small-contract base contracts slightly |
| Contracts above $250,000 | NRR | 106%, summarized by MarketSplash | Expansion more than offsets the accounts that leave |
| Private SaaS below $1M ARR | Median GRR | 92%, survey summarized by Subjolt | Approximately 8% annual gross revenue churn before expansion |
| Monthly-billed SaaS subscriptions, 2025 data | Annual churn | 38%, summarized by Subjolt | Approximately 3.9% compounded monthly |
| SaaS below $300K ARR, billing data to March 2023 | Median retention | 53%, summarized by Subjolt | A different early-stage sample and measurement basis |
Published benchmarks thin out above the early stage. For SaaS between $1M and $20M ARR, and for agencies and professional services, matched internal cohorts are the more reliable comparison. Segment your own base by plan size, contract length and billing model, then track GRR and NRR within each segment. E-commerce businesses should define the repurchase window before treating inactivity as churn.
Don't manufacture comparability
The 53% early-stage retention figure and the 92% founder-survey GRR measure different samples on different definitions. They are not two points on one scale, and the gap between them says nothing about which group retains better.
The same percentage also means different things depending on the denominator. A company running at the 106% NRR benchmark for large contracts can lose logos every month and still grow recurring revenue, because expansion inside surviving accounts outweighs the departures. A 5% monthly logo churn on a $500 plan and the same 5% on a $50,000 contract produce entirely different revenue outcomes. Report revenue churn beside logo churn so the denominator is always visible.
Place your own GRR and NRR beside the closest defensible peer group, and leave the comparison out when the definitions don't match. A broader SaaS financial metrics framework keeps those definitions consistent across reports.
If you use external prospecting support, including Ever Outbound Inc.'s SaaS appointment setting services, preserve acquisition-source tags through billing. Judge that channel on the retention and margin of the customers it produces, since booked meetings alone overstate its value.
Root Causes, Red Flags and the Fix for Each
Reading only the total churn rate delays diagnosis. Treat the patterns below as hypotheses to test, not proof of a cause: customers who cancel after a price change can also have unresolved product problems.
Use account-level billing, product, and support records to investigate each pattern.
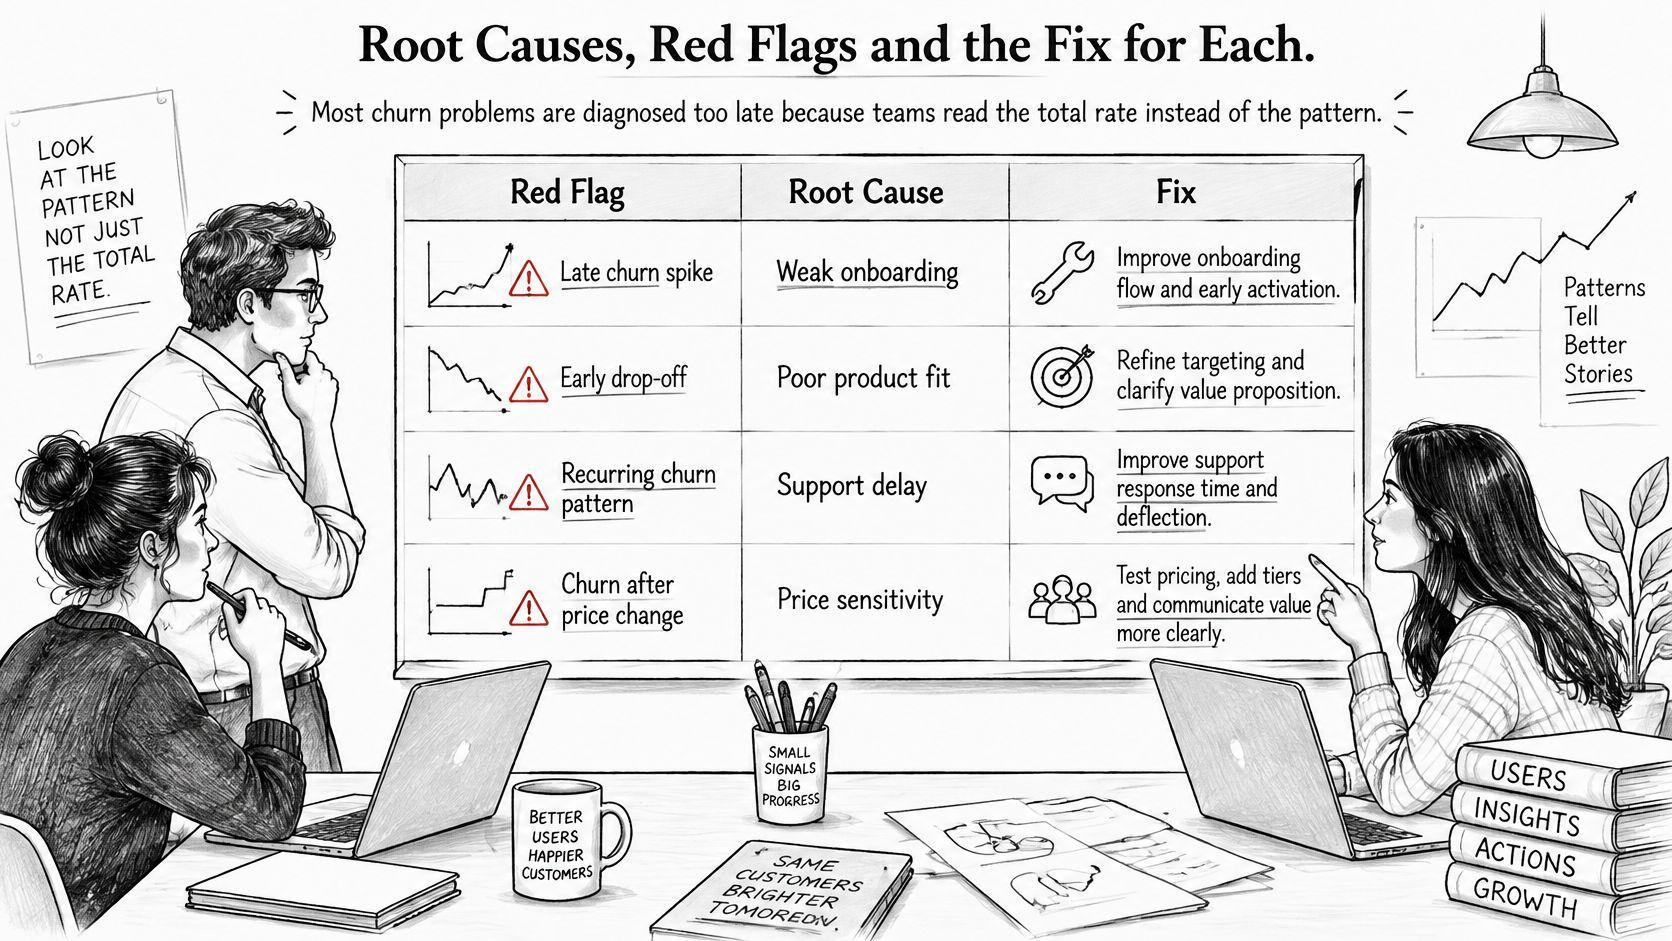
Red flags, root causes and first fixes
| Red flag | Likely root cause | How to confirm | Fix to test first |
|---|---|---|---|
| Churn concentrated in the first 90 days | Weak onboarding or unclear early value | Logo churn by signup month, supported by onboarding records | Guided setup and a day-30 success check |
| Revenue churn higher than logo churn | Large accounts downgrading | Contraction MRR by account size | Renewal review for top accounts before each contract ends |
| Rising churn with healthy logins | Failed card payments | Count failed payments separately from cancellations | Dunning emails and automatic card updates |
| Churn rises after a price change | Price no longer matches delivered value | Churn by plan before and after the change | Packaging test instead of a blanket discount |
| Churn concentrated in one channel | Poor-fit acquisition | Churn by acquisition channel and tenure | Tighter targeting in that channel |
| Support tickets before cancellations | Unresolved product issues | Ticket volume and unresolved issues in the 30 days before loss | Escalate recurring issues to product |
Pull failed payments directly from your billing system. An expired card can appear as a lost logo without representing a deliberate rejection of your service, so cancellation surveys alone won't explain the loss.
Pair this diagnosis with a documented churn analysis and reduction process. Sprints & Sneakers also provides practical context on how to measure and improve customer retention.
A prediction isn't an intervention result
A 2025 systematic review of churn-prediction research identifies recurring problems including class imbalance, limited interpretability, concept drift, and insufficient profit-oriented evaluation. A model that accurately identifies likely cancellations doesn't establish that your offer changes their decision profitably.
Evaluate incremental retained gross margin, not the number of customers who accept a discount:
Incremental retained gross margin = incremental customers retained × annual gross margin per customer − total intervention cost
Run a randomized holdout of comparable customers who receive no offer. Measure the difference in retention over the same window, and include discounts given to customers who would've stayed anyway.
A saved account only creates value when the additional retained margin exceeds the cost of saving it.
In a hypothetical example, a retention discount costing $300 per incremental save for a customer generating $250 annual gross margin produces a $50 loss per save. For a $12,000 ARR enterprise account, the same offer is rational only when expected incremental retained gross margin exceeds the discount and servicing cost. ARR alone doesn't establish profitability.
For additional discussion of churn management, use the video below alongside your account-level review.
Pick the red flag matching your largest loss category, test it against last quarter's departures, and assign an owner to the first fix. Resolve a specific cause before changing pricing across the entire customer base.
Confirm Your Churn Numbers Before You Act
Your next board discussion should focus on decisions, not an argument about how someone built the denominator. Before approving a retention campaign, make the reporting defensible.
- Document the definition. Put the churn formula, starting population, cancellation policy, and observation window into your next board or investor deck.
- Reconcile the measures. Confirm logo churn, gross MRR churn, GRR, and NRR for the last twelve months, together with the two cohort tables. Explain differences between recurring-revenue schedules and accounting revenue rather than forcing them to match.
- Compare matched segments. Split results by ARR band, plan, and contract size. Record benchmark gaps in both directions, and mark unmatched comparisons explicitly.
- Authorize a controlled test. Choose the red flag associated with your largest economic loss. Test the intervention against a holdout before rolling the offer out broadly.
Resolve the finance handoffs
When churn schedules don't reconcile to accounting records, inspect customer identifiers, service-end dates, credits, recurring-revenue classifications, and the handoff between billing and the ledger. Assign one owner to resolve each discrepancy and retain the supporting account-level detail.
For a starting point, our Finance Ops Scorecard asks three quick questions to identify your first likely finance break, with no email required. For a deeper review, you book the paid diagnostic's 30-minute kickoff yourself; the diagnostic runs for five business days and ends with a written workflow map before either side commits to a retainer.
The outcome isn't another dashboard. It's a churn number you can defend in a board meeting, with a clear explanation of the customer behavior, revenue movements, and finance processes behind it.
Jumpstart Partners provides controller-led finance support for close, reporting, billing, and revenue review, helping you connect churn reporting to defensible financial records. Visit Jumpstart Partners to start with the Finance Ops Scorecard or book a paid diagnostic when your customer and revenue schedules still don't reconcile.