Financial Operations
Financial Planning for Startups: The Founder's Playbook
Financial planning for startups explained step by step, with worked numbers, SaaS benchmarks, cash runway math, and a clear path to investor-ready books.
ByJumpstart Partners, CPA, QuickBooks ProAdvisor
··15 min readForecasting is not a cosmetic exercise for startups. According to an empirical study, startups that engage in financial forecasting survive, on average, 14 months longer than startups that do not, after controlling for observable variables, and that's why you need a working model before you need a prettier deck. RII Open Journals study on startup forecasting and survival
The problem is simple. Most founders treat financial planning as something you do right before fundraising, then leave it to rot while payroll, subscriptions, and customer timing keep moving. That's how companies look healthy on paper and then miss payroll in the middle of a quarter.
You don't need an MBA to fix this. You need a build order, a rolling cash view, a few scenarios that aren't delusional, and a handful of KPIs that tell the truth. If you run a SaaS company, digital agency, or professional services firm in the $500K to $20M revenue range, this is the operating system you should use.
Table of Contents
- Why Financial Planning Is a Survival Skill, Not a Quarterly Exercise
- The 8-Step Build Order for Your Financial Model
- Runway, Burn, and the Cash Buffer Most Models Skip
- Scenario Planning, Break-Even, and the Monthly Refresh
- The KPIs Investors and Operators Track
- Accounting Traps That Derail Investor Diligence
- Investor-Ready Package, DIY-to-Outsourced Trigger, and Next Steps
Why Financial Planning Is a Survival Skill, Not a Quarterly Exercise
Financial planning for startups fails when founders treat it like a fundraising artifact instead of an operating discipline. The market doesn't care that your model looked good in the data room if your payroll, vendor bills, and collections don't line up with the bank balance. A forecast only matters when it helps you make better decisions before the damage shows up in the cash account.
The strongest public case for planning is still the survival outcome. The empirical study cited above found that startups that forecast survive 14 months longer on average than those that don't, which is exactly what disciplined planning is supposed to buy you, more time to correct course and less panic when the environment shifts. RII Open Journals study on startup forecasting and survival
Practical rule: if your numbers don't change the way you spend, hire, or raise capital, you're not planning, you're decorating a spreadsheet.
The payoff for this article is a build order you can use. You'll start with the operating assumptions, turn them into the three statements, add a rolling cash view, layer in scenarios and KPIs, then package the result for investors or lenders. That sequence matters because cash flow is a derived output of your assumptions, not a guess you make in isolation. If you want a deeper primer on cash management, this guide on startup cash flow management is a useful companion.
The audience here is founders, CEOs, and finance leaders who need a model that stands up in diligence and still works on a Tuesday morning when collections slip. If you already know your numbers are messy, good. The answer isn't optimism, it's process.
The 8-Step Build Order for Your Financial Model
The right model starts with the business, not the spreadsheet. EY's startup modeling guide says typical outputs include a three- to five-year forecast of the financial statements on a yearly basis, an operational cash flow overview for the coming 12 months, and company- or sector-specific KPIs. EY financial modeling guide for startups That split is exactly how you should think, long-range strategy on one side, near-term cash control on the other.
Build the model in the right order
- Identify total startup resources and funding needs. Start with cash on hand and any committed financing.
- Estimate all expenses. Separate fixed costs from variable costs.
- Forecast revenues. Use the assumptions your sales motion can support.
- Compile the income statement.
- Build the balance sheet.
- Build the cash flow statement from the same assumptions.
- Layer in KPIs and unit economics.
- Stress-test the model with scenarios and a monthly update cadence.
That's not a stylistic preference. It's the only way the statements stay consistent with each other. If you build cash flow as a standalone guess, you'll end up with a model that contradicts itself the moment someone asks how revenue timing affects liquidity. One expert source lays out this as an eight-step flow ending in financial statements, and another emphasizes translating assumptions into the three statements and updating them monthly. Startup financial planning workflow video
For a simple SaaS anchor, use this working set of assumptions. Fixed costs are $60,000 per month, average price is $500, and variable cost per customer is $200. That gives you a contribution margin of $300 per customer before fixed overhead. If you want a template to mirror that structure, this startup financial model template is worth comparing against your own sheet.
Use monthly granularity for year one. That's where cash breaks happen. Use quarterly granularity for years two through five, because the farther out you go, the less precision you deserve and the more you should care about direction.
If you need debt financing in the plan, or you're evaluating bank capital alongside equity, a separate resource like the SBA 7(a) loan guide 2026 is useful because it forces you to think through eligibility, timing, and repayment from a lender's point of view. That mindset belongs in the model, not after the model.
Runway, Burn, and the Cash Buffer Most Models Skip
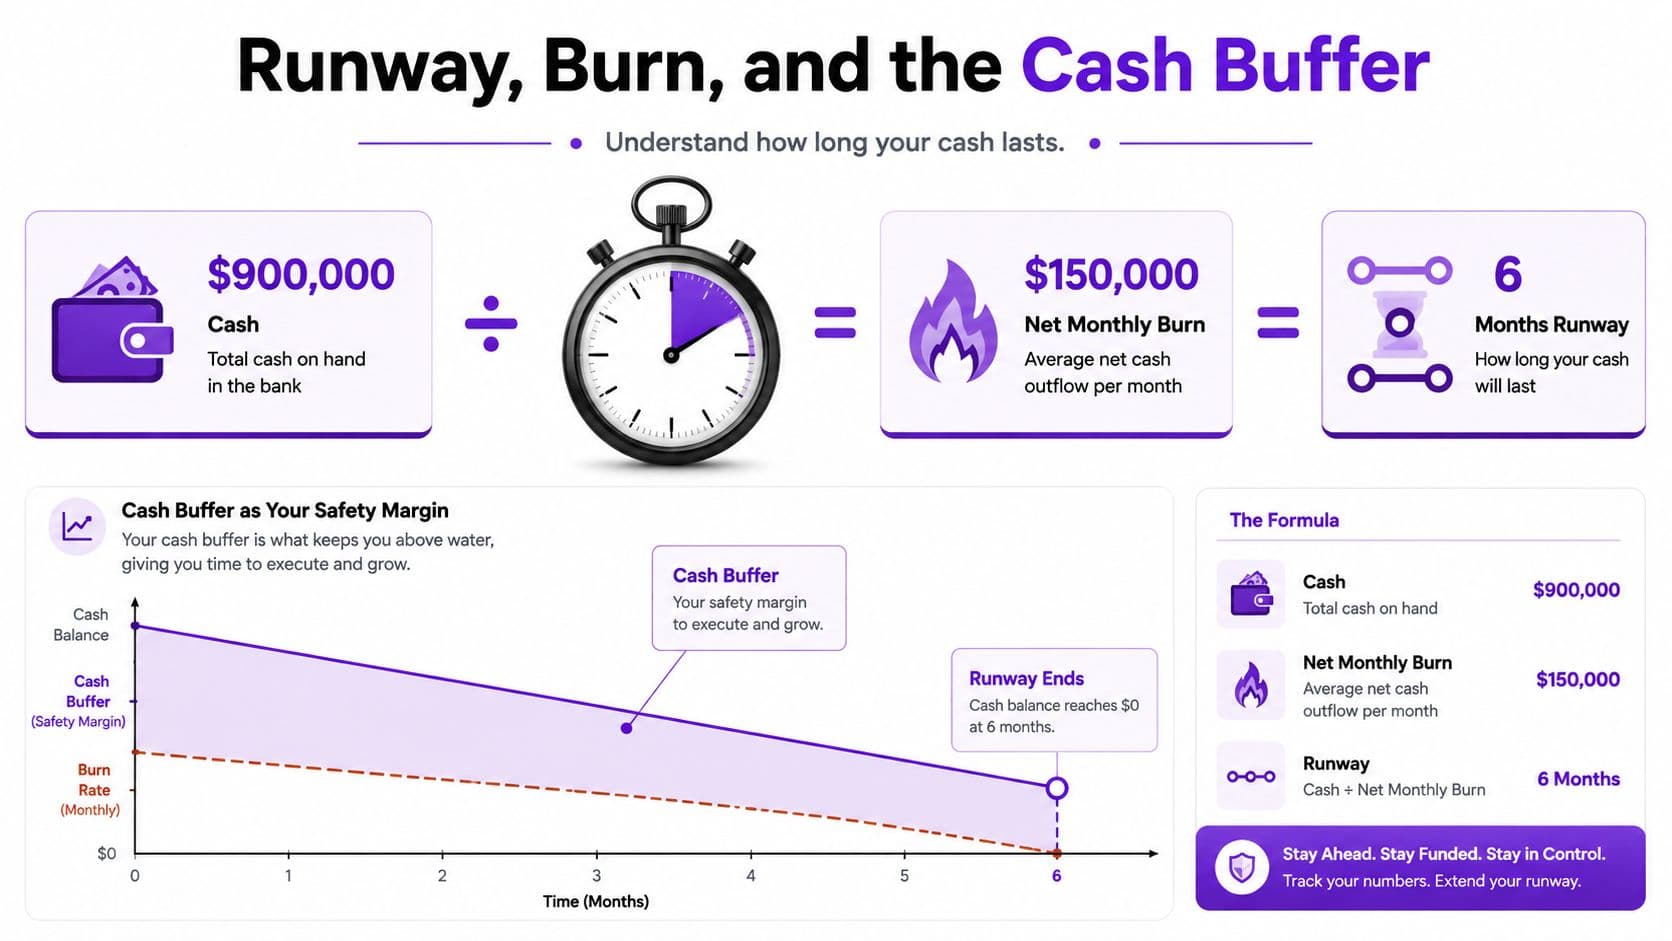
Runway is the number founders argue about because it is the number that forces decisions. If you have $900,000 in cash and $150,000 of net monthly burn, your runway is 6 months. That calculation is simple, cash left divided by monthly net burn. this burn-rate and runway guide
That answer is still incomplete. Six months sounds comfortable until you account for how long financing takes to close. ACCA notes that financial institutions move slowly and founders should plan needs six to eight months ahead, so runway without funding lead time is a false comfort. ACCA startup financial planning article
Gross burn and net burn are not the same problem
Gross burn is the cash you spend each month before revenue. Net burn is what remains after revenue comes in. Accelerators and banks ask different questions because they care about different risks, but for survival planning, net burn decides how long you stay alive. If collections slow down or revenue drops, gross burn shows how fast spending is happening, and net burn shows how much time you have.
Rule of thumb: set runway to match your next realistic financing event, then add a one- to two-month buffer for slippage. If your raise or debt close takes longer than that buffer, the model says you are late.
That is why the cash buffer deserves its own line in the plan. A company can look funded on paper and still hit a liquidity crunch if revenue timing slips or financing closes late. The fix is boring and practical, map the funding calendar against the burn curve and update it monthly, not when the board asks for an emergency deck.
A clean example helps. If monthly net burn is $150,000 and your next financing event is expected in six months, you are not planning for six months of cash. You are planning for six months plus enough buffer to absorb a delayed close, a slower sales month, or a collections wobble. That buffer is the difference between a controlled raise and a forced one.
If you want a focused walkthrough on the calculation, this burn-rate and runway guide is the right companion. The operational point is simple, runway only matters when it is tied to the date your next dollar arrives. For a template that turns that logic into a working planning sheet, use scenario planning by The Business Model Analyst.
Scenario Planning, Break-Even, and the Monthly Refresh
Break-even analysis gives you the first hard test of whether the model makes economic sense. The SBA formula is Fixed Costs ÷ (Price − Variable Costs) = Break-Even Point in Units. U.S. Small Business Administration break-even formula Using the SaaS anchor from above, $60,000 ÷ ($500 − $200) = 200 customers per month. That means you need 200 new units of contribution every month just to stop losing money.
That number changes the conversation immediately. If your sales motion can't get close to 200 customers a month, the problem isn't the spreadsheet, it's the business model. For an agency or professional services firm, the same logic applies, just swap units for billable retainers, projects, or client seats.
Build three scenarios and name them clearly
A good model has base, downside, and upside cases, not 17 variations no one reads. The downside case should be meaningfully worse than plan, not a polite haircut. Use assumptions like these:
| Scenario | Monthly Revenue Growth | Gross Margin | Monthly Net Burn | Implied Runway |
|---|---|---|---|---|
| Base | Plan-level growth | Plan-level margin | Plan burn | Current runway |
| Downside | Growth halves, churn doubles | Compresses from extra service load | Higher burn from slower absorption | Shorter runway |
| Upside | Faster than plan | Holds or improves | Lower net burn as revenue scales | Longer runway |
The exact percentages aren't the point, the direction is. In the downside case, growth slows, churn worsens, and one planned hire gets deferred. That's the scenario board members should push on, because it shows whether you can still survive if the next quarter disappoints.
A stale model is worse than no model because it creates false confidence. Refresh actuals every month, roll the forecast forward 12 months, and review the plan on a fixed cadence instead of waiting for board season. One founder guide recommends an 18-month runway target when sizing a raise, which is a sensible benchmark if your financing process is slow or your sales cycle is lumpy. Founder financial planning guide
If you want a useful template for scenario structure, this scenario planning resource is worth using as a starting point. The point isn't to make the future predictable, it's to make surprises survivable.
The KPIs Investors and Operators Track
Statements tell you what happened. KPIs tell you whether the business can keep going without a cash crunch. Track burn rate, runway, monthly recurring revenue, customer acquisition cost, and lifetime value as the core set, because those are the numbers that show whether growth is real or just expensive motion. Runway still means the same thing every finance lead should use, cash left divided by monthly net burn. For a deeper SaaS-specific view, this metrics guide is a good reference point.
Use a short list, not a dashboard zoo
- MRR and ARR: Separate recurring revenue from one-off project work so you know what repeats and what does not.
- CAC and CAC payback: If payback stretches past 12 months, your acquisition engine is too slow for most growth plans.
- LTV and LTV:CAC: Keep the ratio at or above 3:1. Below that, the economics are too thin to scale safely.
- Net revenue retention: If NRR drops below 100%, expansion is not offsetting churn and contraction.
- Runway: If you are inside the next financing window, the company is already in warning territory.
Those thresholds belong in board meetings, not buried in an appendix. Revenue can rise while cash gets worse if CAC climbs too fast or payback drags out. That is why investors care about unit economics as much as top-line growth.
Add the layer generic models usually miss, AI-driven operating costs. Kruze Consulting points out that headcount is usually the biggest expense line, while AI companies are spending heavily on compute, which means standard startup templates are already behind the market. Kruze Consulting startup financial planning guide If your product uses inference, API calls, or vendor automation, model those costs as usage-linked expenses, because adoption can push them up faster than payroll.
Practical warning: if AI usage rises with product adoption and you do not isolate it in the model, gross margin will look healthier than it really is until the bill lands.
That is the difference between a glossy model and a usable one. The usable model shows where revenue is sticky, where acquisition is expensive, and where product growth turns into infrastructure spend. It also gives operators a live control loop, cash, burn, and the metrics that explain both.
Accounting Traps That Derail Investor Diligence
Clean planning dies fast if the books are wrong. Investors and acquirers don't just look at the size of revenue, they look at whether the accounting tells the truth. If the statements are inflated, inconsistent, or sloppy, diligence turns into a cleanup project and the valuation discussion gets harder.
The traps that cause the most damage
A SaaS company booking the full year of a $120,000 annual contract as January revenue is overstating MRR growth and understating deferred revenue. Under proper ASC 606 treatment, that contract should be recognized at $10,000 per month over the service period, not all at once. That's the difference between a real revenue engine and a timing illusion.
The same logic applies to prepaid expenses and accrued liabilities. If you pay an annual insurance bill upfront, that's a prepaid asset, not a current period expense. If a vendor has delivered services but hasn't invoiced yet, that's an accrued liability, not a free pass to ignore the cost.
| Common Accounting Traps and Their Fixes | ||
|---|---|---|
| Trap | Symptom in the Statements | Correct Treatment |
| Revenue booked upfront on annual SaaS contracts | Revenue looks inflated, deferred revenue looks too low | Recognize revenue over the service period under ASC 606 |
| Software or equipment expensed incorrectly | Profit looks distorted, assets are understated | Capitalize qualifying items and depreciate or amortize them |
| Prepaid costs booked as current expense | Margin looks worse than reality | Record as prepaid asset and expense over time |
| Accrued costs ignored | Liabilities are understated | Record the liability when the obligation is incurred |
| Owner loans mixed with equity | Balance sheet is messy and hard to diligence | Classify loans separately and reconcile them |
| Workers misclassified as contractors | Payroll and tax exposure are hidden | Reclassify properly as W-2 where required |
The diligence problem is bigger than bookkeeping neatness. Investors discount financials that look inflated, and acquirers haircut the deal when they can see cleanup work ahead. The same goes for sales tax nexus exposure and misclassified 1099 versus W-2 workers, because those issues create liabilities that don't show up cleanly until someone asks hard questions.
If you're under any pressure to raise or sell, do the cleanup before the process starts. Jumpstart Partners' financial reporting package examples show the kind of reporting discipline buyers and investors expect to see.
Investor-Ready Package, DIY-to-Outsourced Trigger, and Next Steps
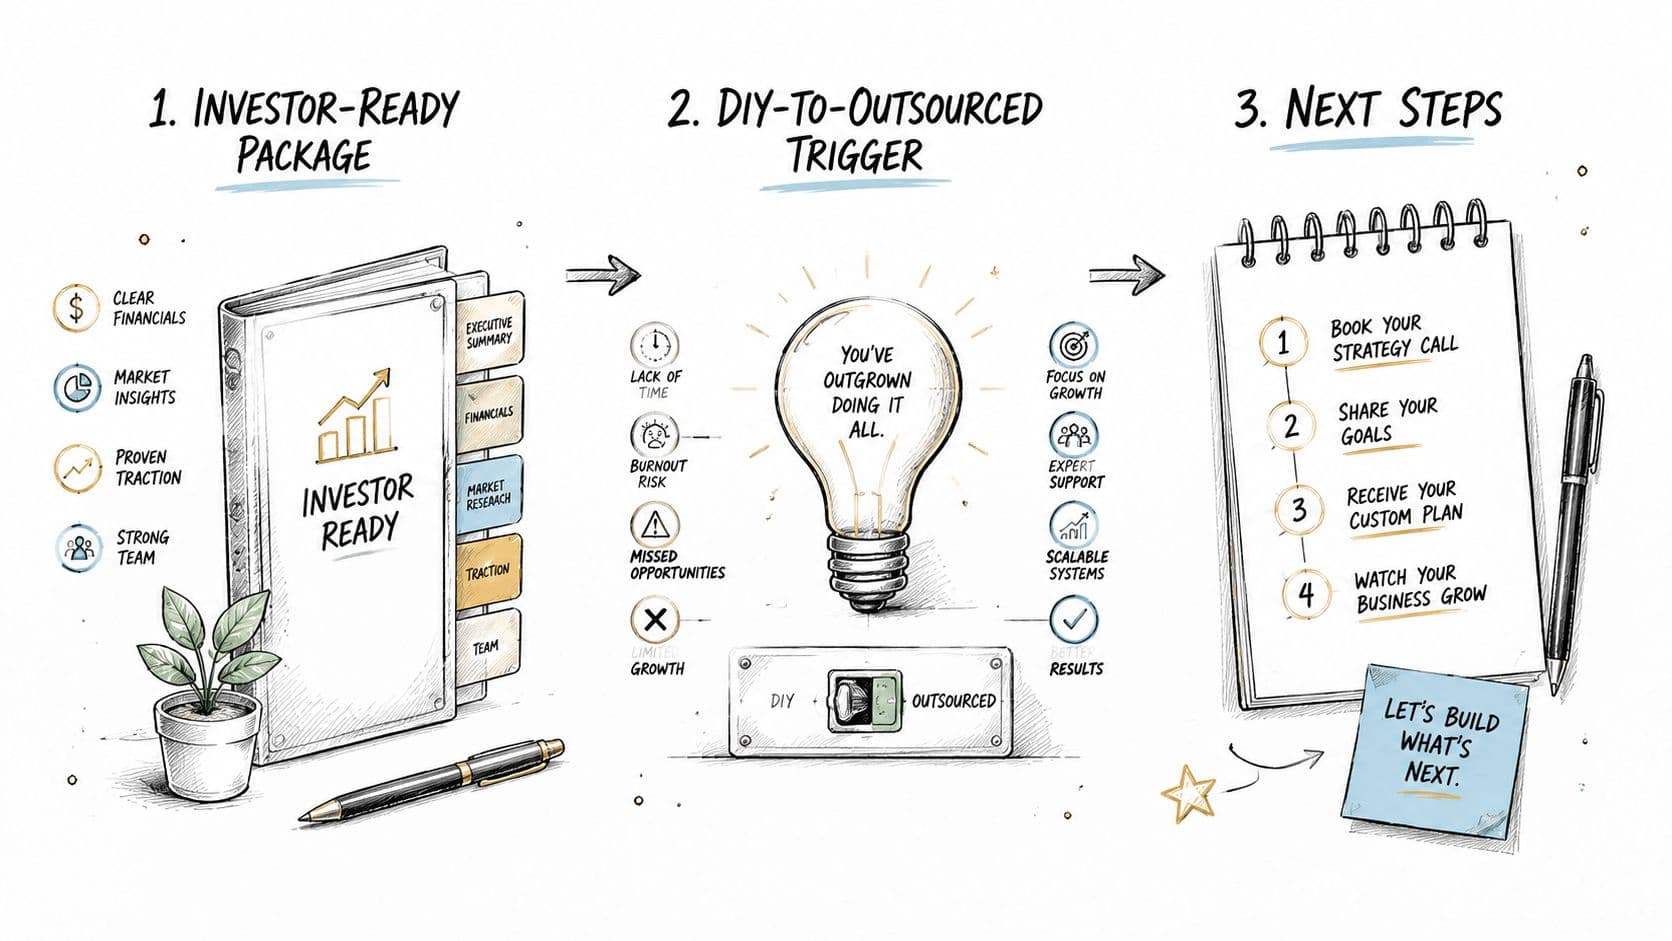
An investor-ready package is not just a model. It's a set of documents that answer the questions investors, lenders, and acquirers ask in different ways. If you don't assemble the package as one coherent system, every diligence call becomes a scavenger hunt.
What belongs in the package
- Three-statement model: Shows profitability, financial position, and cash movement from the same assumptions.
- KPI dashboard: Proves the business is being managed, not just reported.
- Cap table: Shows ownership and dilution.
- Debt schedule: Clarifies repayment timing and obligations.
- Cohort or revenue detail: Explains retention, expansion, and customer quality.
- Clean reconciliation memo: Tells the reader how the numbers tie together.
If you're building fundraising materials, this investor list resource from Gritt.io is useful for targeting the right capital sources once your numbers are ready. Don't start outreach before the package is clean. That wastes time and signals sloppiness.
Know when DIY stops making sense
Use these triggers to stop doing it yourself:
- Month-end close takes over 10 days.
- Revenue is above $1M and the structure is getting multi-entity or multi-location.
- An audit or Series A diligence process is coming.
- You don't have controller capacity.
- You're spending more than 5 hours a week on bookkeeping.
That's where outsourced finance earns its keep. Jumpstart Partners offers tiered support for startup planning, including Starter, Growth, and Scale plans, plus fixed-fee projects like 13-week cash flow sprints and QuickBooks cleanup. Its operating setup includes a 5-day close, SOC 2 Type II security, and a 30-day money-back guarantee, which matters when you need process discipline more than another spreadsheet. If you want to compare your current package against a clean finance stack, Jumpstart Partners is the place to start.
Book the consult, clean the books, and build the rolling cash view this week. If you need a model that tells the truth before investors do, don't wait for the next fire drill.