Financial Operations
The Startup Financial Model Template That Unlocks Growth & Investor Confidence
Build a dynamic startup financial model template. Ditch guesswork, gain investor confidence, and accelerate your growth path. Get the guide!
ByJumpstart Partners, CPA, QuickBooks ProAdvisor
··21 min readYour business is hitting $500K ARR and that trusty old spreadsheet suddenly feels more like a liability than a lifeline. You’re not alone. We see it constantly: the ad-hoc models that got you here start to break, creating blind spots around your cash flow and forcing you to make critical hires based on gut feel instead of data.
This isn't just a financial mess; it's a strategic liability. You're flying blind when you need clear visibility to make decisions on hiring, marketing spend, and product investment. A robust financial model isn't a ‘nice-to-have’—it’s the operational compass that translates your strategy into a quantifiable, investor-ready story.

This guide provides the blueprint for building a dynamic, three-statement financial model that actually works for your SaaS, agency, or professional services firm. You will learn how to structure your assumptions, forecast revenue with driver-based precision, and build the KPI dashboards that investors and board members demand.
Why Your Old Spreadsheet Is Costing You Growth
Once you cross that half-million-dollar revenue mark, the game changes. The simple P&L you've been using can’t answer the tough questions about unit economics, runway, and the capital needed to scale. This is the moment to graduate from reactive accounting to proactive financial strategy. A well-constructed model becomes your most powerful tool for justifying your valuation, defending your growth plan, and ultimately securing the capital you need to win.
What Investors Expect to See
When you walk into a pitch meeting, investors have a clear set of expectations. A flimsy model signals a lack of financial discipline. They expect to see at least 3-year projections as a baseline. The first year must be broken down monthly for both your income statement and cash flow statement. Anything less, and you're not speaking their language.
A solid model gives you unshakeable financial control to make smarter decisions. If you want to brush up on the basics first, explore the fundamentals in our guide on financial forecasting for startups. Otherwise, let’s dive in and build a model that gives you true financial clarity.
The Three Core Statements Your Financial Model Must Have
Before you forecast five years of MRR, you must get the foundation right. Every solid financial model is built on the three core financial statements. Get this part wrong, and even the most sophisticated projections are just guesswork.
These three statements—the Income Statement, Balance Sheet, and Cash Flow Statement—are completely interconnected. They work together to give you, and any investor, a complete, 360-degree view of your company’s financial health.
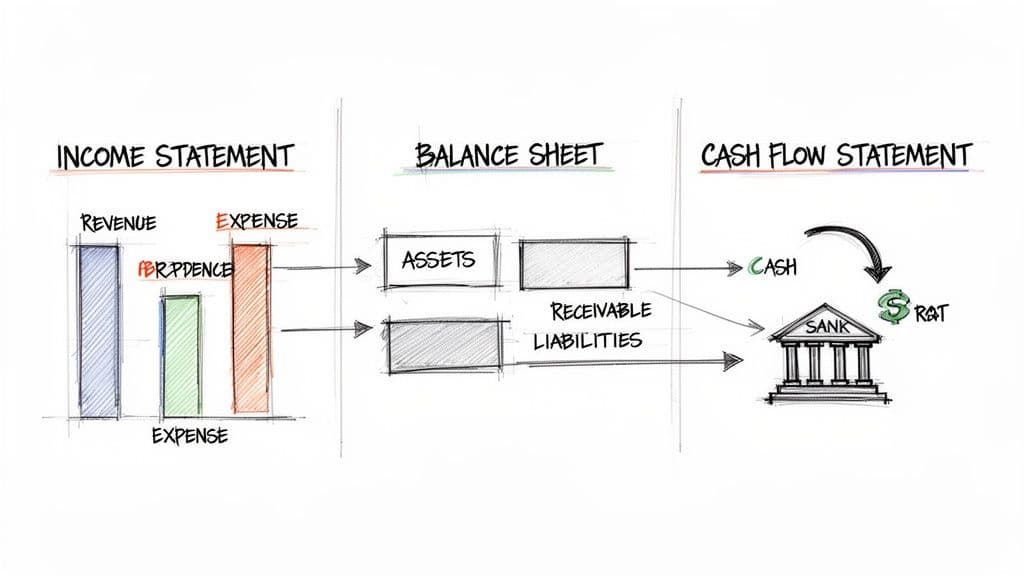
Think of them as different camera angles on your business. The Income Statement shows profitability over a period, the Balance Sheet is a snapshot of your financial position on a single day, and the Cash Flow Statement tracks the actual cash moving through your bank account. They must link up and balance perfectly.
The Income Statement: Your Profitability Scorecard
The Income Statement, or Profit & Loss (P&L), tells you whether you made or lost money over a specific period, like a month or a quarter. It’s your business’s report card, answering the fundamental question: "Are we profitable?"
This is where you tally up your revenues and subtract your expenses to find your net income or loss. For a SaaS or services business, this is also where one of the biggest founder mistakes happens: improper revenue recognition.
Common Misconception: "The most common error I see is confusing cash with profit. A customer pays you $12,000 for an annual SaaS contract in January. That does not mean you had $12,000 in revenue that month. Under proper GAAP accounting (ASC 606), you only recognize $1,000 of that revenue each month as you deliver the service." — David Little, Founder, Jumpstart Partners
The Balance Sheet: A Snapshot in Time
The Balance Sheet shows what your company owns (Assets) and what it owes (Liabilities) at a single point in time. It’s governed by one simple, unbreakable rule: Assets = Liabilities + Equity.
- Assets: What you own. This includes cash in the bank, accounts receivable (money customers owe you), and equipment.
- Liabilities: What you owe. This includes loans, accounts payable (money you owe vendors), and deferred revenue.
- Equity: The value left for shareholders once you subtract liabilities from assets.
Let’s return to that $12,000 annual contract. The moment you receive the cash, your Cash asset on the Balance Sheet goes up by $12,000. But since you haven't delivered the service yet, you also create a $12,000 liability called Deferred Revenue. Each month, as you recognize $1,000 of revenue on your Income Statement, you reduce that Deferred Revenue liability by $1,000. This is how the statements connect.
The Cash Flow Statement: The Ultimate Source of Truth
For a founder, the Cash Flow Statement is the most critical of the three. It’s the ultimate source of truth because it tracks the actual movement of cash, reconciling the P&L’s net income with the real change in your bank balance. It answers the question that keeps founders up at night: "Where did our cash actually go?"
It’s broken into three parts:
- Operating Activities: Cash from your primary business operations.
- Investing Activities: Cash used to buy or sell long-term assets like computers or office furniture.
- Financing Activities: Cash from investors or lenders, or cash used to pay back debt.
In our example, the full $12,000 payment shows up immediately as a cash inflow from operations. This is why a company can look profitable on its Income Statement but still run out of cash. Understanding these mechanics is non-negotiable, and you can dive deeper by checking out our guide on how to prepare financial statements.
To make this crystal clear, here’s a breakdown of how to think about each statement and where founders typically get tripped up.
The Three Essential Financial Statements Explained
| Financial Statement | What It Tells You | Key Metric for SaaS/Agency | Common Founder Mistake |
|---|---|---|---|
| Income Statement | Your profitability over a period (e.g., one month). | Gross Margin, EBITDA | Confusing cash received with recognized revenue. |
| Balance Sheet | What you own and owe at a point in time. | Deferred Revenue, Cash Balance | Ignoring liabilities like deferred revenue, overstating equity. |
| Cash Flow Statement | How cash moved through the business. | Cash Runway, Free Cash Flow | Focusing only on P&L and running out of operating cash. |
Getting the interplay between these three statements right isn't just an accounting exercise. It’s the absolute requirement for building a financial model that gives you real control over your business and gives investors the confidence to write a check.
Building Your Revenue and Expense Models
This is where your financial model goes from a simple accounting exercise to your company’s strategic playbook. A powerful forecast isn't built on guesswork like Last Month's Revenue x 1.1. Instead, it must be a driver-based model that connects your real-world operations directly to your financial results.
For a SaaS or service business, this means building your revenue forecast from the ground up. You will model how your marketing dollars turn into leads, how those leads convert into paying customers, and how those customers behave over time. This approach replaces assumptions with a clear, defensible logic that investors can get behind.
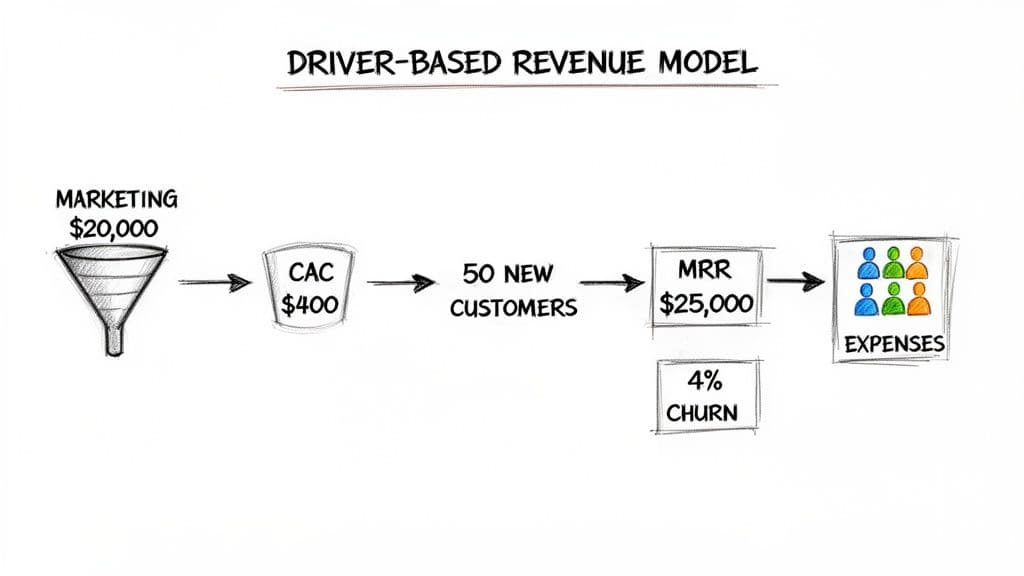
Crafting a Driver-Based Revenue Forecast
A driver-based forecast starts with the inputs you can actually control—the operational levers you pull every day. Instead of just picking a revenue number out of thin air, you model the specific steps that lead to it.
Let's walk through a real-world calculation for a SaaS business. You plan to spend $20,000 on marketing next month. Looking at your historical data, you know your Customer Acquisition Cost (CAC) is $400.
- Calculation:
$20,000 Marketing Spend / $400 CAC = 50 New Customers
Now, turn those new customers into revenue. If your Average Revenue Per Account (ARPA) is $500 per month:
- Calculation:
50 New Customers x $500 ARPA = $25,000 in New MRR
This $25,000 represents the new recurring revenue you've added. But you must also account for churn.
Factoring in Churn and Expansion
No SaaS business keeps 100% of its customers. You absolutely have to model churn to create a realistic projection. If you start the month with $150,000 in MRR and have a 4% monthly logo churn rate:
- Calculation:
$150,000 Existing MRR x 4% Churn = $6,000 in Churned MRR
Your total MRR for the month is a combination of these moving pieces.
Monthly MRR = Previous MRR + New MRR - Churned MRR
$150,000 + $25,000 - $6,000 = $169,000
This bottom-up method gives you a credible forecast investors trust. Financial model templates from providers like Slidebean use this logic to power their projections, but you have to supply the company-specific inputs to make it meaningful.
Building Your Expense Model from Headcount
Your single largest expense is almost always payroll. That’s why a detailed headcount plan is the backbone of any strong expense model. Instead of just plugging in a random salary expense, you must link every new hire to specific revenue or operational triggers. For example, hire a new Account Executive for every $500,000 in new ARR, or a new Customer Support Specialist for every 100 new customers.
Your headcount plan should look like this:
| Role | Department | Start Month | Base Salary | Burden (25%) | Total Monthly Cost |
|---|---|---|---|---|---|
| SDR | Sales | Month 1 | $55,000 | $13,750 | $5,729 |
| Account Exec | Sales | Month 3 | $70,000 | $17,500 | $7,292 |
| Software Eng | Product | Month 4 | $120,000 | $30,000 | $12,500 |
The "Burden" accounts for payroll taxes, health insurance, and 401(k) matches, typically adding 20-30% on top of base salary. Getting this detail right is critical for accurate cash flow forecasting.
Modeling Variable and Fixed Expenses
Beyond payroll, model your other key costs. These fall into two categories:
-
Variable Costs: Expenses that scale with revenue. This includes Cost of Goods Sold (COGS), sales commissions, and payment processing fees. For instance, if your sales reps earn a 10% commission, that cost automatically grows as your New MRR does.
-
Fixed Costs: Expenses that remain stable regardless of revenue. Think rent, software subscriptions (like HubSpot or Salesforce), and insurance.
A great startup financial model template has separate schedules for these expense categories, allowing you to clearly see how your cost structure evolves as you scale. This is especially important for understanding the nuances of accounting for SaaS businesses, where costs like hosting are directly tied to customer usage.
By building your revenue and expense models from these operational drivers, you create a financial plan that is not only believable to investors but also a practical guide for running your company.
Modeling Fundraising Scenarios and Your Cap Table
Your financial model’s most important job during a fundraise is to answer the high-stakes "what if" questions that will define your company's future. A static model showing a single outcome isn't just unhelpful; it's a liability. You need a dynamic tool that stress-tests assumptions and shows exactly how new capital impacts ownership and control. This is what lets you walk into investor meetings with total confidence.
An integrated fundraising and cap table module turns your spreadsheet from a simple forecast into a powerful negotiation tool. It lets you model a Seed or Series A round with precision, seeing exactly how new cash on the balance sheet translates to dilution for everyone on the cap table.
Calculating Dilution in a Funding Round
Let’s run through a real-world example. You're raising a $2 million Series A at an $8 million pre-money valuation. Before the round, your cap table has 8,000,000 founder shares outstanding.
First, calculate the post-money valuation. This is your pre-money valuation plus the new cash coming in.
- Calculation:
$8,000,000 Pre-Money + $2,000,000 New Cash = $10,000,000 Post-Money Valuation
Next, figure out the new investor’s ownership stake. They are "buying" a percentage of the newly valued company.
- Calculation:
$2,000,000 Investment / $10,000,000 Post-Money Valuation = 20% Ownership
This means the original founders now own 80% of a $10 million company, whereas before they owned 100% of an $8 million company. That's dilution in action.
The Impact of an Option Pool Refresh
Here’s where founders often get tripped up. Investors will almost always require you to create or "refresh" an Employee Stock Option Pool (ESOP) before their investment closes. They want the dilution from this new pool to hit the existing shareholders (i.e., you), not their new money.
Expert Quote: "The top-up of the option pool is a pre-money event. This means the option pool is created and allocated from the existing cap table before the new investment is finalized. Founders must model this carefully, as it directly dilutes their stake, not the incoming investors." — Alex Kracov, CEO of Dock
Let's say they require a 10% option pool as part of the term sheet. This 10% is calculated on the post-money valuation, a critical detail that can significantly water down founder equity if you don't model it correctly. You must model this to prevent nasty surprises when you’re staring at a term sheet. To properly model equity and ownership, it all starts with a clear legal foundation, which includes a well-drafted founders agreement template.
Why You Need Multiple Scenarios
Showing up with a single, perfect "hockey stick" projection is a huge red flag for any seasoned investor. They know reality is messy. A sophisticated financial model must include best-case, base-case, and worst-case scenarios.
| Scenario | Key Assumptions | Implication for Fundraising |
|---|---|---|
| Best-Case | Lower CAC, higher conversion rates, low churn. | Supports a higher valuation; shows upside potential. |
| Base-Case | Your most realistic, defensible assumptions. | The core of your pitch; demonstrates credible planning. |
| Worst-Case | Higher churn, slower sales cycles, market headwinds. | Shows you understand risks and have a plan to manage cash burn. |
Running these scenarios proves you’ve thought through the potential outcomes and are prepared to navigate the inevitable challenges. It shows you aren’t just pitching a dream you can’t back up with data. By modeling these fundraising dynamics and preparing for different outcomes, you shift from simply asking for money to strategically planning your company's capital structure. For a deeper look into this process, check out our guide on the valuation of startup companies.
Integrating Your Model with Actuals for True Visibility
Your startup financial model is just a fantasy until you crash it into reality. Its real power isn't in the initial forecast; it's in becoming a living tool you use to manage the business. This only happens when you consistently compare your projections to what actually happened.
This budget vs. actuals analysis is the single most important financial rhythm for a growing company. It's the process that tells you whether your strategy is working or if you're veering off a cliff.
The Monthly Variance Analysis Rhythm
The goal here isn't a massive accounting project—it's a simple, repeatable monthly process. You’ll export actual performance data from your accounting system (like QuickBooks or Xero) and your payment processor (like Stripe) and map it directly against your model’s projections for that month.
This isn't just about seeing if the numbers match. It's about understanding the story behind the differences, or variances. A good variance analysis forces you to answer the tough operational questions.
Let’s say your model projected $15,000 in marketing spend, but your QuickBooks report shows you actually spent $22,000. That $7,000 negative variance isn’t just a number; it’s a signal demanding an investigation. Did a campaign run over budget? Did a new channel prove more expensive than you thought?
Or worse: your churn was projected at 2% but came in at 4%. That variance is an urgent alarm bell telling you to dig into customer feedback, support tickets, and product usage data immediately. We explore this critical process in our guide on conducting an actuals vs budget analysis.
Building a High-Impact KPI Dashboard
While a full variance report is essential for deep dives, you and your leadership team need a high-level dashboard to review weekly. This is also what investors will expect to see in every board meeting. Keep it visual and focused on the handful of metrics that truly drive your business.
Key Metrics for Your KPI Dashboard:
- Monthly Recurring Revenue (MRR): The lifeblood of any subscription business.
- Customer Acquisition Cost (CAC): Tracks the efficiency of your sales and marketing spend.
- Lifetime Value (LTV): Measures the total value of a customer. A healthy business requires an LTV at least 3x your CAC.
- Net Revenue Churn: The percentage of revenue lost from existing customers, minus any expansion revenue from upgrades. According to OpenView's 2024 SaaS Benchmarks, best-in-class net revenue churn is actually negative, meaning expansion revenue outpaces all churn.
- Cash Runway: The number of months you can operate before you run out of money, based on your current burn rate.
This regular comparison of forecast-to-actuals is the core discipline of financial management. It’s how you move from simply having a startup financial model template to using it as a strategic weapon to guide your company’s growth and ensure you never run out of cash unexpectedly.
Your Action Plan for an Investor-Ready Model
You have the theory. Now it’s time to put it into action. Follow this roadmap to turn a blank startup financial model template into a tool that gives you confidence in your decisions and one you can hand to an investor without breaking a sweat.
The Monthly Process: From Data Export to Analysis
Your model is only a forecast until you connect it to reality. This is a non-negotiable monthly discipline that turns your spreadsheet into a true management tool. This is how you spot deviations from the plan and make corrections before they spiral.
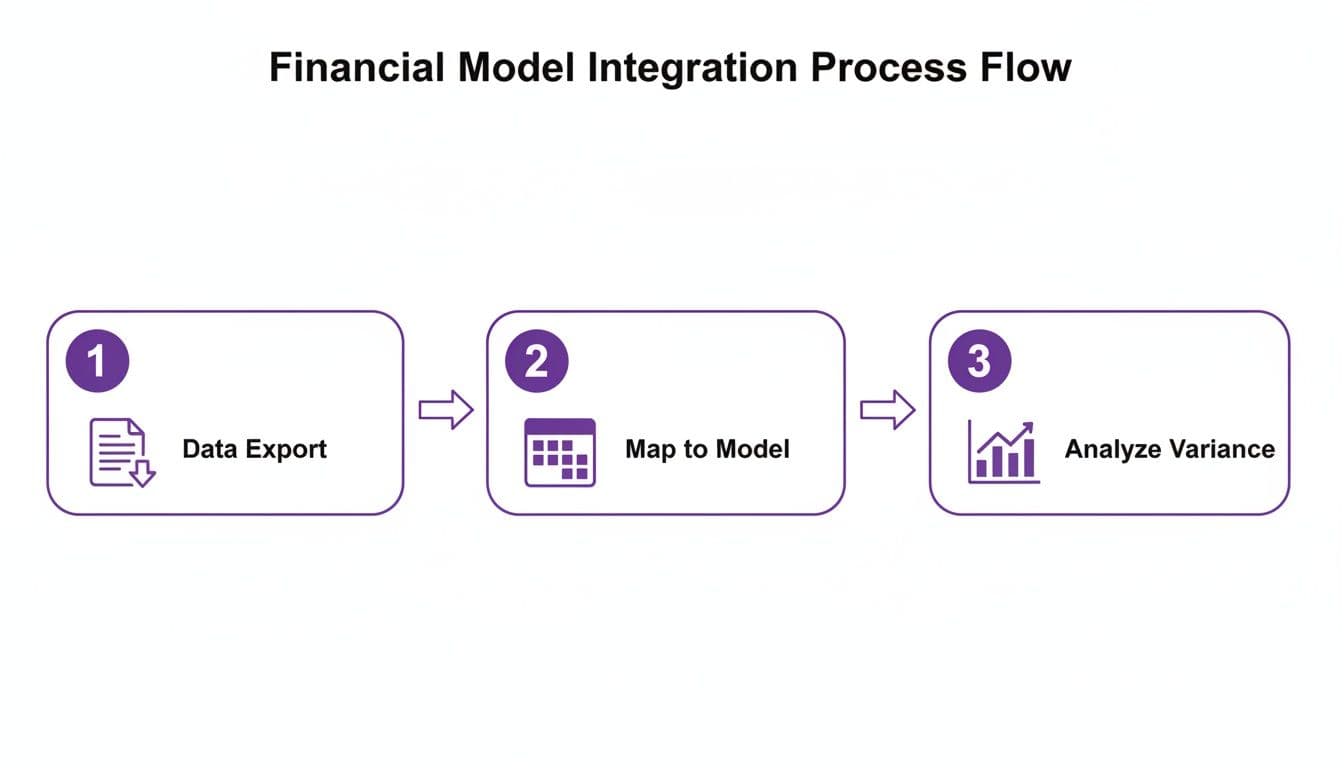
The real power of a model isn’t in the initial forecast. It’s in this cyclical process of comparing projections to actuals, learning, and refining.
Red Flags: Warning Signs of a Weak Model
Investors have seen thousands of models. They can spot a flimsy one in about 90 seconds. Be on high alert for these red flags that kill your credibility and signal a founder who isn't on top of their numbers.
- Hard-Coded Numbers: This is the most common amateur mistake. Your revenue shouldn't be a number you typed in a cell. It must be a formula, like
New Customers * ARPA. If key outputs don't change when you adjust your assumptions, the model is useless. - Unbalanced Balance Sheet: If your Assets do not equal Liabilities + Equity, the model is fundamentally broken. Period. It's a dead giveaway of a major structural error that invalidates every other number.
- Disconnected Cash Flow: The Statement of Cash Flows must perfectly reconcile net income from the P&L with the change in cash on the Balance Sheet. If it doesn't tie out, it's just a collection of random numbers.
Beyond the numbers, an investor-ready startup has to show operational maturity. For SaaS companies, especially those selling to larger customers, proving you have your house in order on security can be just as important as your financial metrics. Understanding frameworks like SOC 2 compliance for startups is crucial for closing enterprise deals and building that next level of investor confidence.
Your financial model tells a story. Make sure it's a story of a founder who is in complete control of their numbers, understands the levers of the business, and has a clear, data-backed plan to win. If this process feels overwhelming, that's a huge sign you need expert help.
Actionable Next Steps
- Gather Your Inputs: Collect the last 6-12 months of data for your key drivers: marketing spend, website traffic, conversion rates, sales rep productivity, churn rates, and average contract values.
- Build the Core Statements: Set up the linked Income Statement, Balance Sheet, and Cash Flow Statement in a spreadsheet. Ensure the Balance Sheet always balances.
- Create Driver-Based Schedules: Build separate tabs for your revenue forecast (based on marketing/sales drivers) and your expense forecast (driven by a detailed headcount plan).
- Implement a Monthly Close Process: Commit to a monthly rhythm of comparing your model’s forecast to your actual results. Investigate every significant variance.
Tired of flying blind with messy spreadsheets? Jumpstart Partners can build you an investor-ready financial model and deliver a 5-day month-end close. Book a free consultation today.
Your Top Questions on Startup Financial Models
We get asked a lot about the nitty-gritty of building a financial model that actually works. Here are the most common questions, answered.
How Far Out Should My Financial Model Project?
For any startup in the $500K-$20M revenue range, a 3-year (36-month) projection is the absolute minimum. Investors won't even look at anything less—it's the standard for assessing your growth trajectory and long-term viability.
The first 12-18 months need to be broken out month-by-month. That level of detail is non-negotiable for running your business, managing cash, and tracking your budget against what actually happens. After that, years 2 and 3 can be summarized quarterly or annually.
If you're raising a Series A or later, a 5-year model becomes the gold standard. It's essential for the more sophisticated valuation methods investors will use, like a Discounted Cash Flow (DCF) analysis.
What Are the Most Common Mistakes in Financial Models?
The most damaging errors are also the most avoidable. They instantly signal inexperience to investors.
The first is building your forecast on totally unrealistic assumptions. This isn't just about being optimistic; it's about picking a random growth percentage out of thin air instead of building a bottom-up forecast tied to real drivers like marketing spend, sales rep quotas, and conversion rates.
The second is the infamous "hockey stick" problem. This is where revenue magically shoots up to the moon, but the model conveniently forgets to include the massive increase in sales, marketing, and headcount costs required to make that happen.
"The most dangerous mistake is ignoring cash flow. Founders obsess over the P&L and whether they're 'profitable,' but investors and operators live and die by the cash flow statement. Profit is an opinion; cash is a fact. Your runway is a cash concept, not a P&L one." — A seasoned VC
Can I Use a Free Online Financial Model Template?
You can, but think of it as a bare-bones blueprint, not a finished house. A generic template is a decent starting point for the basic structure of the three financial statements, but it knows nothing about your actual business.
For example, a free template can't model the difference between SaaS churn and agency project billing, or e-commerce inventory turns. You have to build the critical schedules—revenue, COGS, and operating expenses—from scratch using your company's unique drivers.
Never, ever present an unmodified generic template to an investor. They've seen them all before, and they will recognize it in a second. It immediately signals a lack of financial discipline and attention to detail.
If you're tired of flying blind with messy spreadsheets and want an investor-ready financial model that gives you true visibility, Jumpstart Partners can help. We build custom financial models and deliver a fast 5-day month-end close. Book a free consultation today.