Financial Operations
How to Calculate COGS: A Founder's Guide to Profitability
Learn how to calculate COGS for SaaS, e-commerce, and service businesses. This guide has worked examples, benchmarks, and common mistakes to avoid.
ByJumpstart Partners, CPA, QuickBooks ProAdvisor
··14 min readIf your SaaS company reports $100,000 in revenue and $19,000 in direct delivery costs, your gross margin is 81%. That isn't just an accounting output. It's a verdict on your pricing, delivery model, and operational discipline, and it sits squarely inside the 75% to 90% gross margin range investors typically expect for SaaS businesses, according to Digits.
Most founders still treat COGS like a retail formula they learned once and never revisited. That's a mistake. If you run SaaS, an agency, or a professional services firm, generic inventory advice won't help you calculate a credible gross margin. You need a COGS model that fits how your business delivers value.
Table of Contents
- Why Gross Margin Is the Most Important Number on Your P&L
- The COGS Formula for Every Business Model
- Calculating COGS in the Real World Worked Examples
- Advanced Adjustments for Investor-Ready Financials
- Common COGS Mistakes That Kill Your Margins
- Automating Your COGS for a 5-Day Close
Why Gross Margin Is the Most Important Number on Your P&L
Founders obsess over revenue. Experienced operators obsess over gross margin.
Gross margin tells you whether the business model works before overhead, hiring plans, and growth bets muddy the picture. If your COGS is wrong, your gross margin is wrong. If your gross margin is wrong, your pricing decisions are wrong, your forecast is wrong, and your valuation story falls apart under scrutiny.
Accurate COGS tracking matters because it moves pricing from instinct to actual economics. Direct costs belong in COGS. Administrative salaries don't. Raw materials and direct labor do. General overhead that doesn't scale with production or delivery doesn't. That distinction is the difference between a clean P&L and a misleading one, as noted in this COGS pricing discussion.
Why founders get this wrong
Most businesses understate COGS in the early growth stage. E-commerce brands skip freight-in. Agencies bury delivery labor inside payroll. SaaS companies dump support, hosting, product salaries, and random software into one bucket and call it “cost to serve.”
That creates fake confidence.
If you sell on marketplaces, margin leakage gets worse because fees, fulfillment, and landed costs stack up fast. If that's your world, this technical guide to Amazon margins is worth reading because it shows how quickly a product business can misread true profitability.
Practical rule: If you can't explain exactly why a cost belongs above gross profit, you probably haven't classified it correctly.
Why investors care first
Investors don't start with your story. They start with your unit economics and your ability to produce reliable financials. Gross margin is one of the first tests because it reveals whether revenue is efficient or expensive.
For internal decision-making, it's just as important. A founder who understands gross margin knows which customers, products, and delivery channels create value. If you need a tighter refresher on the math itself, review this breakdown of how to calculate gross margin.
| What COGS affects | Why it matters |
|---|---|
| Pricing | You can't price rationally if you don't know direct cost. |
| Hiring | Delivery-heavy teams often look efficient until labor is allocated correctly. |
| Forecasting | Gross margin assumptions drive cash planning and operating leverage. |
| Valuation | Investors use gross margin to assess scalability and quality of revenue. |
The COGS Formula for Every Business Model
The classic formula is still the starting point for product businesses: Beginning Inventory + Purchases - Ending Inventory = COGS. It works. It just doesn't work for everyone.
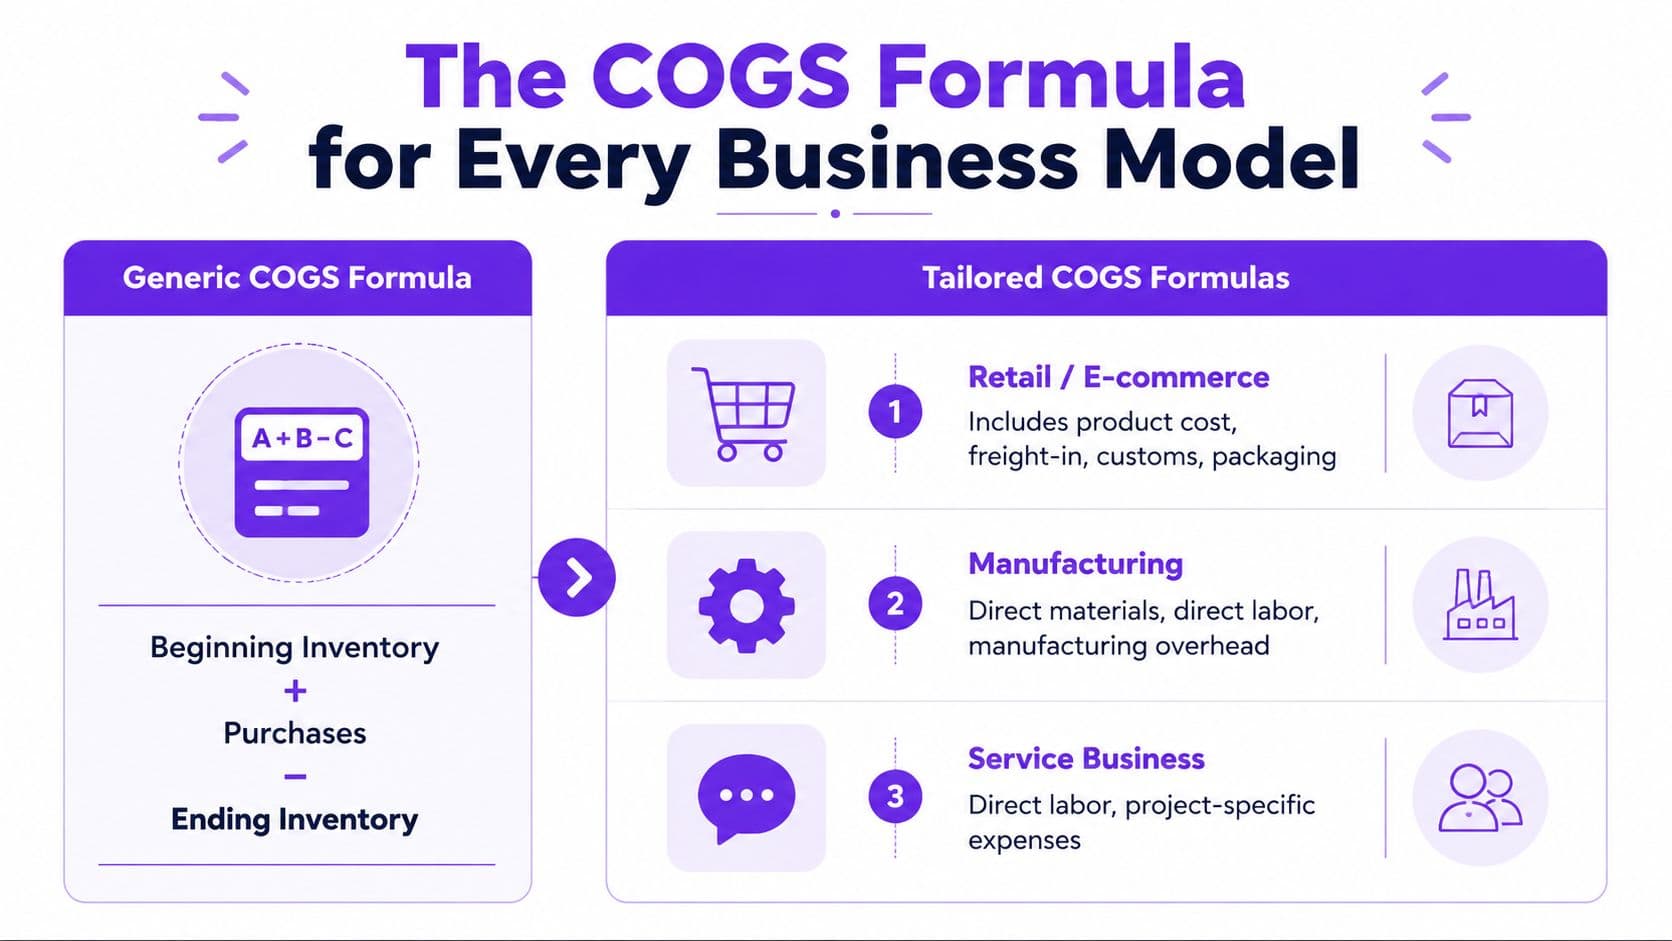
Retail and e-commerce
For retailers and DTC brands, the formula is straightforward. The discipline is not.
Your purchases number should include the direct cost of acquiring sellable inventory. That means product cost, freight-in, and other directly attributable landed costs. If you leave those out, you understate COGS and overstate gross profit.
Here's the standard worked example from inventory accounting: if you start with $50,000 in beginning inventory, add $120,000 in purchases, and end with $40,000 in ending inventory, your COGS is $130,000, using the standard framework explained by Craftybase.
Manufacturing
Manufacturers need more than the retailer shortcut. You need to break COGS into direct materials, direct labor, and manufacturing overhead.
That means your formula becomes:
| Component | What to include |
|---|---|
| Direct materials | Raw materials consumed in production, adjusted for beginning and ending inventory |
| Direct labor | Production labor tied to making the product |
| Manufacturing overhead | Utilities, equipment wear, maintenance, and other production-related overhead |
At this stage, many operators get sloppy. A practical manufacturing breakdown should include freight-in and trade discounts in materials calculations and exclude operating costs like general rent. If you run a product business with assembly or production steps, this guide to accounting for manufacturing is the right lens.
SaaS
SaaS founders make the same mistake over and over. They use a product inventory formula for a business with no physical inventory.
That's wrong on its face.
For SaaS, COGS should include only direct delivery costs that scale with customer usage. According to GSquared CFO, that includes hosting and infrastructure costs, direct labor costs for infrastructure and DevOps teams, and third-party software costs tied to delivery. The clean rule is simple: if the cost doesn't rise specifically because you're serving more customers, it doesn't belong in COGS.
New feature development, product improvements, innovation work, and product management are not COGS. They're operating expenses.
Professional services and agencies
Agencies and service firms usually don't carry inventory, but they still have COGS. In your model, COGS is the cost of delivering client work.
That usually means:
- Direct labor tied to billable delivery
- Project-specific contractor costs
- Direct software or tools required for a specific engagement
- Other job-specific expenses passed through or incurred to fulfill the work
What doesn't belong there? General admin salaries, leadership payroll not tied to delivery, business development spend, and broad overhead.
A useful litmus test is this: if you stopped serving clients this month, would the cost disappear? If yes, it likely belongs in COGS. If not, it likely belongs below gross profit.
One formula doesn't fit every business
The phrase how to calculate COGS sounds universal. It isn't. The right formula depends on what you sell and how you deliver it.
| Business model | Best COGS approach |
|---|---|
| Retail / e-commerce | Beginning inventory + purchases - ending inventory |
| Manufacturing | Direct materials + direct labor + manufacturing overhead |
| SaaS | Direct delivery costs that scale with usage |
| Agency / services | Direct delivery labor + project-specific expenses |
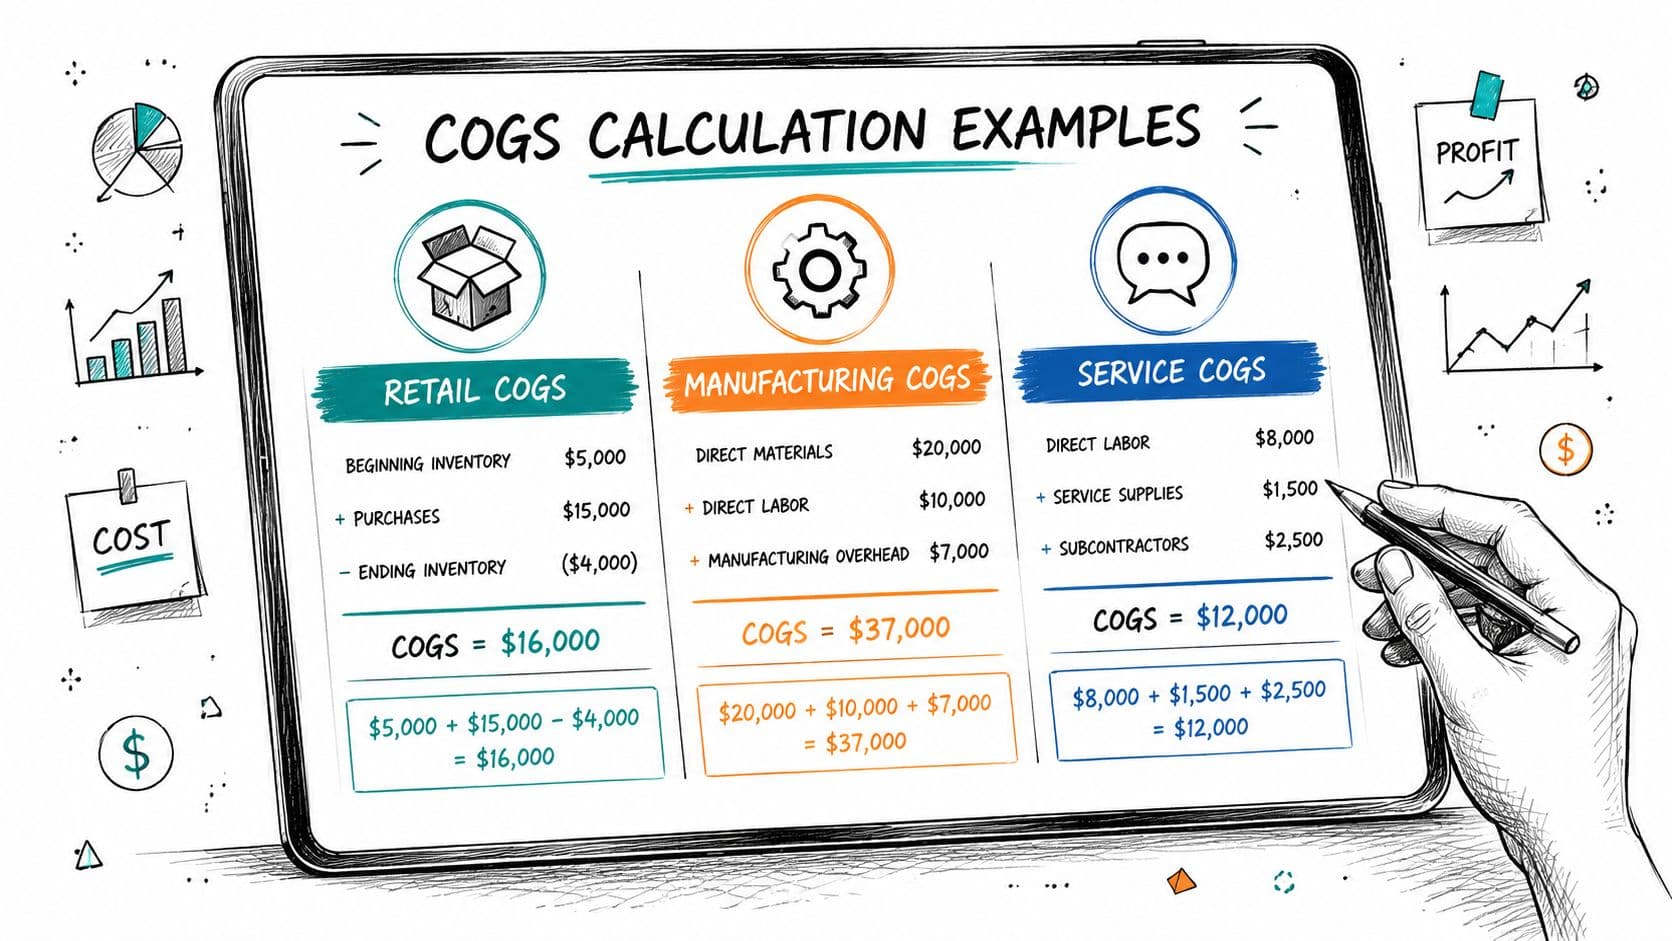
Calculating COGS in the Real World Worked Examples
A formula is only useful if it survives contact with your P&L. These examples show how COGS should work in practice for product, SaaS, and service businesses, and where founders usually get it wrong.
E-commerce example
Start with a straightforward product business.
You begin the month with $50,000 of inventory. During the period, you purchase $120,000 more inventory, including product cost and inbound freight. You finish with $40,000 still on hand. The calculation is simple:
| Step | Amount |
|---|---|
| Beginning inventory | $50,000 |
| Plus purchases | $120,000 |
| Less ending inventory | $40,000 |
| COGS | $130,000 |
That $130,000 is the cost of the inventory you sold. It is not the cash you spent that month.
Product companies distort gross margin. If your team expenses all purchases as they happen and skips the ending inventory adjustment, your gross profit is wrong. That error flows into pricing decisions, lender reporting, and any quality of earnings review a buyer will run later.
SaaS example
SaaS founders often overstate gross margin because they exclude delivery costs that investors expect to see above gross profit.
Assume your SaaS company reports $100,000 in revenue and incurs direct delivery costs of hosting $8,000 + DevOps labor $6,000 + third-party APIs $3,000 + support $2,000. Total COGS is $19,000. Gross margin is 81%.
| SaaS direct cost | Amount |
|---|---|
| Hosting | $8,000 |
| DevOps labor | $6,000 |
| Third-party APIs | $3,000 |
| Support | $2,000 |
| Total COGS | $19,000 |
| Revenue | $100,000 |
| Gross margin | 81% |
That margin is healthy for SaaS. If yours is materially lower, inspect infrastructure usage, vendor sprawl, and support efficiency before you cut price. If yours looks unusually high, check whether you buried support, cloud, or implementation labor in operating expense. Investors notice that immediately when you start a search for investors.
A short walkthrough can help if you want another angle on the mechanics:
Agency example
Service businesses do not get a free pass on COGS. They just measure it through labor and job delivery instead of inventory.
Assume a digital agency delivers a client project using strategists, designers, and media buyers. The correct COGS is the labor cost tied to that work, plus contractor spend and any client-specific tools required to fulfill the engagement. It is not total payroll for the month.
Run the calculation in this order:
- Pull time data from your project management or time-tracking system.
- Apply a labor cost rate to each billable employee.
- Assign contractor invoices to the client or project.
- Remove non-delivery time such as internal meetings, sales calls, recruiting, and executive planning.
If your agency doesn't track labor by client or service line, you don't know your true margins. You only know your bank balance.
That one discipline changes everything. You can see which clients are profitable, which service lines are underpriced, and which account managers are producing low-margin work.
Manufacturing and batch-costing example
Founders who make physical products run into a different problem. Their inputs are often measured in different units, so the math fails before the pricing discussion even starts.
In one batch-costing scenario, a recipe uses 45 units of ingredient A at $45 per gallon, 1 unit of ingredient B at $31.3 per ounce, and 40 units of ingredient C at $31.3 per ounce. The batch totals $119.08, and the per-unit cost is $4.96 only after dividing by 24 units, as shown in this batch-costing example.
Skip unit normalization and your standard cost is wrong. Once that happens, your pricing, margin targets, and reorder decisions are wrong too.
Advanced Adjustments for Investor-Ready Financials
Basic COGS gets you a management report. Refined COGS gets you through diligence.
Inventory valuation and accrual discipline
For product and manufacturing companies, inventory valuation method matters because ending inventory directly changes COGS. FIFO and weighted average aren't cosmetic choices. They affect reported gross profit and taxable income.
Your beginning inventory also needs to tie exactly to the prior period's ending inventory. When it doesn't, errors compound across periods and nobody trusts the P&L. If you're preparing for diligence or a transaction, this is exactly the kind of issue that shows up in a quality of earnings review.
Manufacturing businesses have an additional trap. They need to decompose COGS into direct materials, direct labor, and manufacturing overhead. According to Forecastr, misclassifying overhead as operating expense shows up in 25% of small business audits because “indirect” costs are often handled inconsistently.
| Adjustment area | What disciplined finance teams do |
|---|---|
| Inventory valuation | Apply one method consistently and reconcile it to ending inventory |
| Cutoff | Record purchases and inventory in the correct period |
| Manufacturing overhead | Allocate production-related overhead above gross profit when appropriate |
| Accruals | Match costs to the period when goods or services were delivered |
Capitalized development versus SaaS delivery costs
SaaS founders often mix delivery expense with product creation. That weakens every metric downstream.
Customer-facing hosting, direct infrastructure labor, and usage-based third-party tools belong in COGS when they scale with service delivery. Software development for new features does not. Product improvements do not. Product management does not. Those are operating costs, and in some cases development costs may be capitalized under the right accounting framework instead of flowing through COGS.
Investor-ready reporting isn't about making margins look better. It's about making them credible.
If fundraising is on your roadmap, clean classification matters before you ever search for investors. Discerning investors will test whether your margin profile is operationally real or just a bookkeeping artifact.
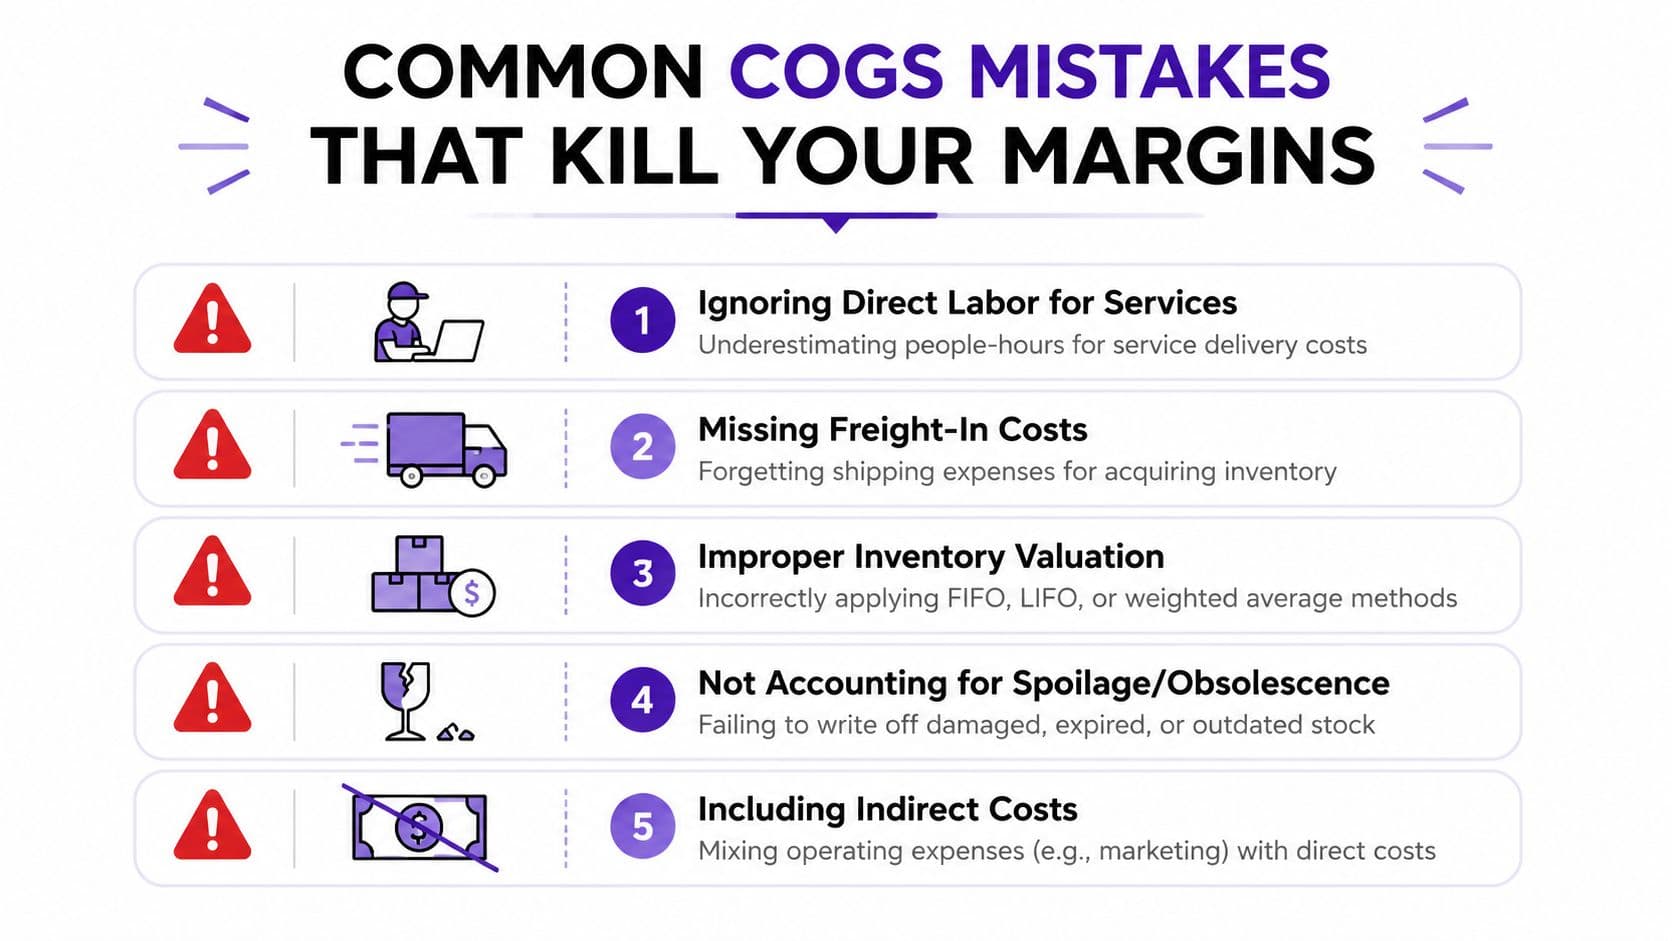
Common COGS Mistakes That Kill Your Margins
Most bad gross margins aren't caused by bad businesses. They're caused by bad classification.
What belongs in COGS and what doesn't
The cleanest rule in SaaS comes from RevTek Capital: “A general rule to follow for COGS in a SaaS company is that if you could deliver the service without the expense, do not include it in the total cost,” states a RevTek Capital analyst in this piece on COGS for SaaS companies.
That rule eliminates a lot of garbage classifications fast.
Here are the mistakes I see most often:
- Sales commissions in COGS. Those are selling costs, not delivery costs.
- Amortized software development in COGS. That distorts SaaS gross margin.
- Product management salaries above gross profit. Also wrong for SaaS.
- Freight-in omitted from inventory purchases. Product margins get overstated.
- Agency payroll dumped into operating expense. Client delivery margins look artificially strong.
- Inventory counts treated casually. Ending inventory errors flow directly into COGS.
For product businesses, inventory reconciliation is the control point. If your team needs to tighten that workflow, a disciplined reconciliation of inventory process is imperative.
Red flags to check this month
Use this as a quick diagnostic.
| Red flag | What it usually means |
|---|---|
| Gross margin swings without an operational reason | Costs are being classified inconsistently |
| Support, sales, and product salaries live in one payroll bucket | Your P&L can't support investor questions |
| Inventory never ties from one month to the next | COGS is unreliable |
| No project-level labor tracking in services | Client profitability is guesswork |
Your P&L should tell you how the business works. If it hides delivery economics, it's not doing its job.
Automating Your COGS for a 5-Day Close
You don't need more spreadsheets. You need a system that classifies direct costs correctly every month.
QuickBooks, Xero, and NetSuite can automate parts of the process. Shopify and Stripe can feed revenue data. Gusto and BambooHR can support payroll allocation. But software doesn't solve bad accounting logic. If your chart of accounts is sloppy, your classes are inconsistent, or your inventory workflow is broken, automation just produces bad numbers faster.
The right setup usually includes three things:
- A clean chart of accounts that separates direct costs from operating expenses
- A monthly close checklist with inventory, payroll, and accrual controls
- Management review that challenges margin movement before books are finalized
If you want a fast close, build the process first and automate second. That's how finance teams get dependable reporting instead of monthly surprises. A strong financial close process is what turns COGS from a year-end scramble into a repeatable operating discipline.
The payoff is simple. You get a P&L you can trust, gross margins that mean something, and decisions based on economics instead of intuition.
If your books still don't give you a clean answer on gross margin, it's time to fix the system. Jumpstart Partners helps SaaS companies, agencies, and growing businesses build investor-ready financials, tighten COGS classification, and close the books fast enough to make decisions while the numbers still matter.