Financial Operations
How to Calculate Working Capital Ratio in SaaS
Learn exactly how to calculate working capital ratio for SaaS and service businesses, with formulas, benchmarks, and SaaS-specific adjustments like deferred
ByJumpstart Partners, CPA, QuickBooks ProAdvisor
··15 min readThe working capital ratio is calculated as current assets ÷ current liabilities. A practical SaaS review often starts around 1.5x to 2.5x after examining deferred revenue quality, but no single target proves that you can pay near-term bills.
That's the counterintuitive part. A SaaS company can report a strong current ratio and still face a payroll squeeze if receivables are late, cash is restricted, or liabilities fall due before collections arrive. A lower ratio can also be manageable when customers pay quickly and the company receives cash before delivering services.
For founders and finance leaders, the ratio is a starting point, not a verdict. You need the headline calculation, a quality-adjusted view of current assets, and a short-term cash forecast that shows what will be available when obligations fall due.
Table of Contents
- Why Generic Working Capital Guidance Fails Your SaaS Business
- The Working Capital Ratio Formula and Where to Find Each Number
- Worked Examples for SaaS and Professional Services
- Industry Benchmarks and What Healthy Actually Looks Like
- Beyond the Ratio, Testing Liquidity Quality
- Red Flags and Warning Signs in Your Working Capital
- Action Steps to Improve Your Working Capital Ratio
Why Generic Working Capital Guidance Fails Your SaaS Business
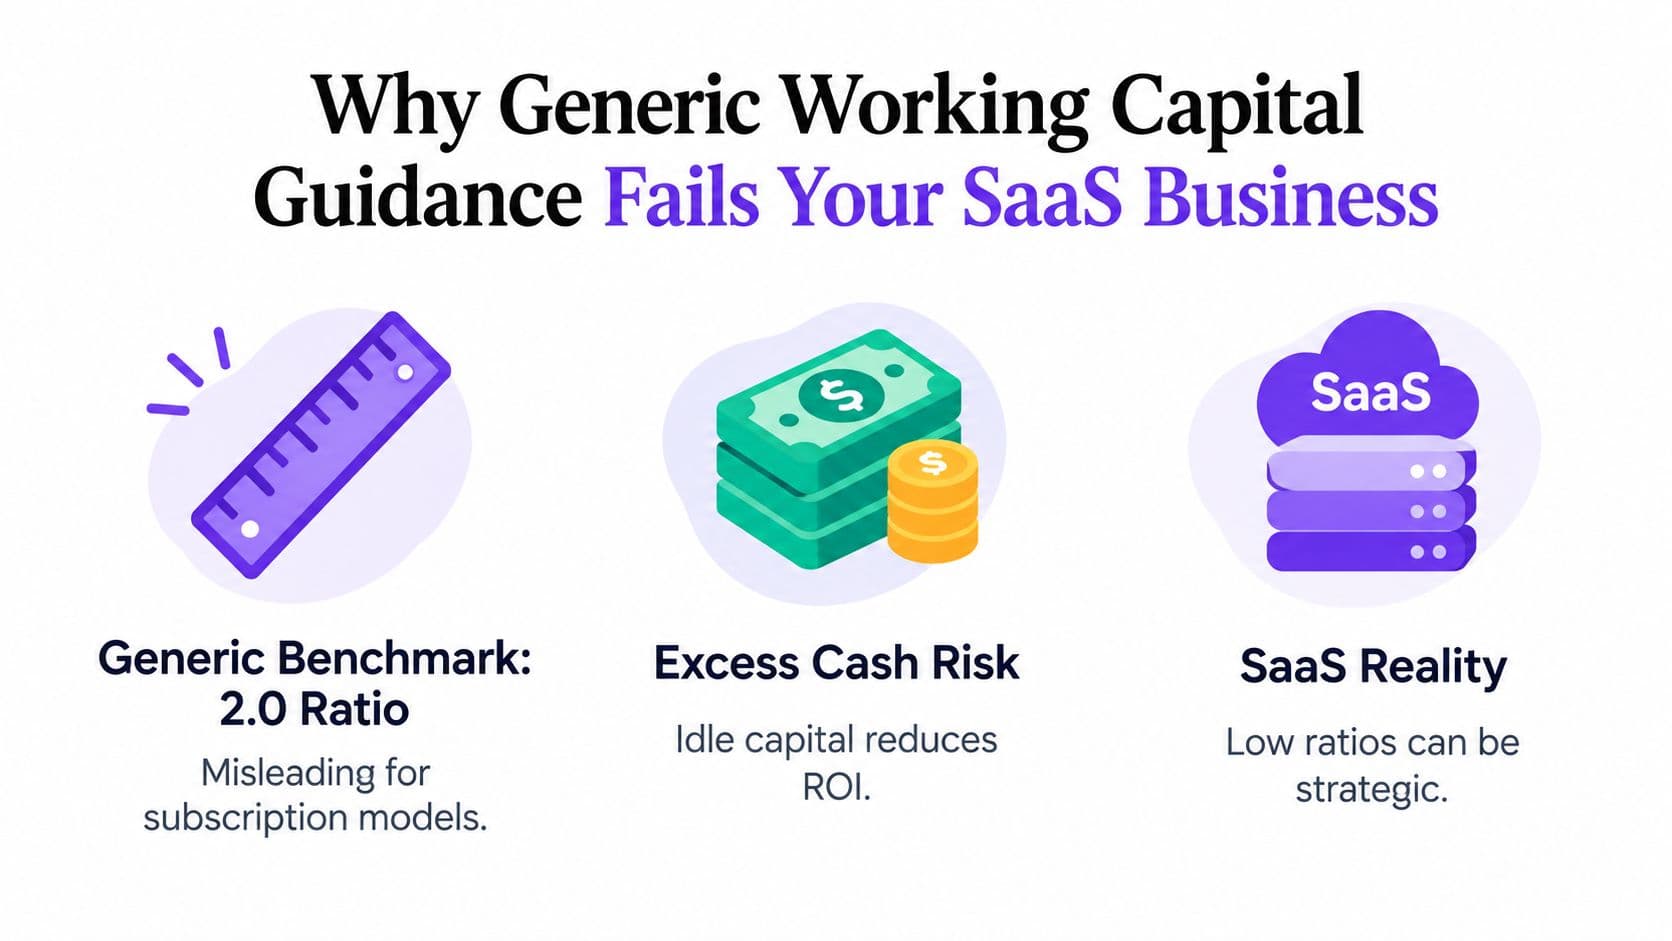
Most generic guidance treats a ratio around 2.0 as an obvious sign of financial strength. That advice ignores how SaaS and service businesses operate. A subscription company may hold cash collected in advance alongside deferred revenue, while an agency may show substantial accounts receivable that won't convert to cash on schedule.
The standard calculation remains simple:
Working capital ratio = Current Assets ÷ Current Liabilities
The difficult part is deciding whether those assets are genuinely available and whether those liabilities require immediate cash settlement. The Business Development Bank of Canada's working capital guidance emphasizes that asset convertibility, supplier terms, and customer payment terms affect interpretation.
The headline number hides asset quality
Suppose your balance sheet includes cash, receivables, prepaid software, and restricted cash. The accounting classification may place several of those items in current assets, but they don't have equal liquidity.
Cash can generally fund payroll or vendor payments immediately. A receivable may require collection work. A prepaid expense usually can't pay a supplier at all. Restricted cash may be unavailable for ordinary operations. Treating each dollar as equally liquid makes the ratio look more useful than it is.
The same problem appears on the liability side. Accounts payable, accrued payroll, current debt, and deferred revenue are all current obligations, but their payment behavior differs. Deferred revenue represents an obligation to provide future goods or services. It deserves careful analysis, but it doesn't behave exactly like an invoice due to a vendor.
Ask an operational question
Don't ask only, “Is our ratio above the benchmark?” Ask, “How much of our current assets can fund the next payroll, tax payment, debt installment, and committed vendor payment?”
A falling ratio isn't automatically bad if collections are accelerating and cash conversion is improving. A rising ratio isn't automatically good if it reflects idle cash, slow receivables, or assets that don't support current operations. That comparative approach is consistent with the limitations discussed in peer-reviewed research on current-ratio comparability.
The Working Capital Ratio Formula and Where to Find Each Number
Start with a classified, period-end balance sheet. You need the current asset and current liability sections, not a general ledger total assembled from memory.

Step one, total current assets
Include assets expected to be realized, sold, or consumed within the operating cycle or within 12 months. For a SaaS company or agency, review these lines:
- Cash and cash equivalents: Include operating bank accounts and confirm whether any cash is restricted.
- Accounts receivable: Use the balance net of the allowance for doubtful accounts, then review the aging report separately.
- Short-term investments: Include marketable investments that qualify as current under your accounting policy.
- Prepaid expenses: Include them in reported current assets, but don't assume they can fund upcoming bills.
- Inventory: Include inventory where applicable, although most SaaS companies have little or none.
Step two, total current liabilities
Current liabilities are obligations due within the same operating horizon. Typical lines include:
- Accounts payable: Unpaid supplier and contractor invoices.
- Accrued expenses: Payroll, taxes, bonuses, professional fees, and other incurred costs.
- Current debt: The portion of loans or other debt due in the short term.
- Deferred revenue: Subscription or contract obligations expected to be recognized within the current period.
- Other short-term obligations: Review payroll liabilities, tax balances, and customer-related obligations for classification errors.
OpenStax distinguishes the current ratio from the quick ratio, which excludes inventory, and the cash ratio, which uses cash and marketable securities only. Its working capital explanation also distinguishes the ratio from net working capital. The ratio is a relationship, while net working capital is a dollar amount calculated as current assets minus current liabilities.
Pull the classified balance sheet from QuickBooks, Xero, or NetSuite after reconciliations and closing entries are complete. If your team struggles to identify misclassified balances, a virtual bookkeeper can help maintain reconciliations and supporting schedules. For a broader review of line-item classification, use this guide on how to analyze a balance sheet.
A clean calculation follows this sequence:
| Step | Action | Output |
|---|---|---|
| 1 | Add qualifying current assets | Total current assets |
| 2 | Add obligations due in the same horizon | Total current liabilities |
| 3 | Divide assets by liabilities | Working capital ratio |
| 4 | Subtract liabilities from assets | Net working capital |
| 5 | Review aging, timing, and restrictions | Operational liquidity view |
The formula is straightforward. Your accounting policy, close process, and supporting schedules determine whether the result is reliable.
Worked Examples for SaaS and Professional Services
A ratio becomes useful when you connect it to actual line items. The first example uses the documented illustration of $120,000 in current assets and $70,000 in current liabilities.
SaaS-style balance sheet example
Assume the current asset total contains cash, receivables, and other current items. The calculation is:
$120,000 ÷ $70,000 = 1.71, usually rounded to 1.7.
The company reports approximately $1.70 of current assets for every $1.00 of current liabilities. Net working capital is calculated separately:
$120,000 − $70,000 = $50,000.
That distinction matters. A ratio doesn't tell you how many dollars remain after current liabilities. The $50,000 is the accounting cushion, while 1.7 describes the relationship between the two balance-sheet totals. The calculation and distinction are documented in OpenStax's working capital chapter.
For a SaaS company, don't stop at 1.7. Break the $120,000 into cash, receivables, short-term investments, and any less-liquid current items. Then compare the timing of those assets with deferred revenue, payroll, taxes, and debt obligations.
Digital agency example
Use the documented agency illustration of $180,000 in current assets and $100,000 in current liabilities:
$180,000 ÷ $100,000 = 1.8.
On paper, that looks comfortable. But assume $120,000 of the assets consists of invoices more than 90 days overdue. Only $60,000 remains readily available for immediate liquidity analysis:
$60,000 ÷ $100,000 = 0.6.
This doesn't replace the reported current ratio. It adds an operational warning layer. BDC's current ratio guidance warns that asset convertibility and customer and supplier terms must be assessed before drawing conclusions.
Month-end snapshots can also mislead when annual billing, project milestones, or scheduled vendor payments cluster around the reporting date. Trend the calculation across reporting periods and reconcile major movements instead of managing to a single closing date. For revenue recognition context, review these ASC 606 examples.
Industry Benchmarks and What Healthy Actually Looks Like
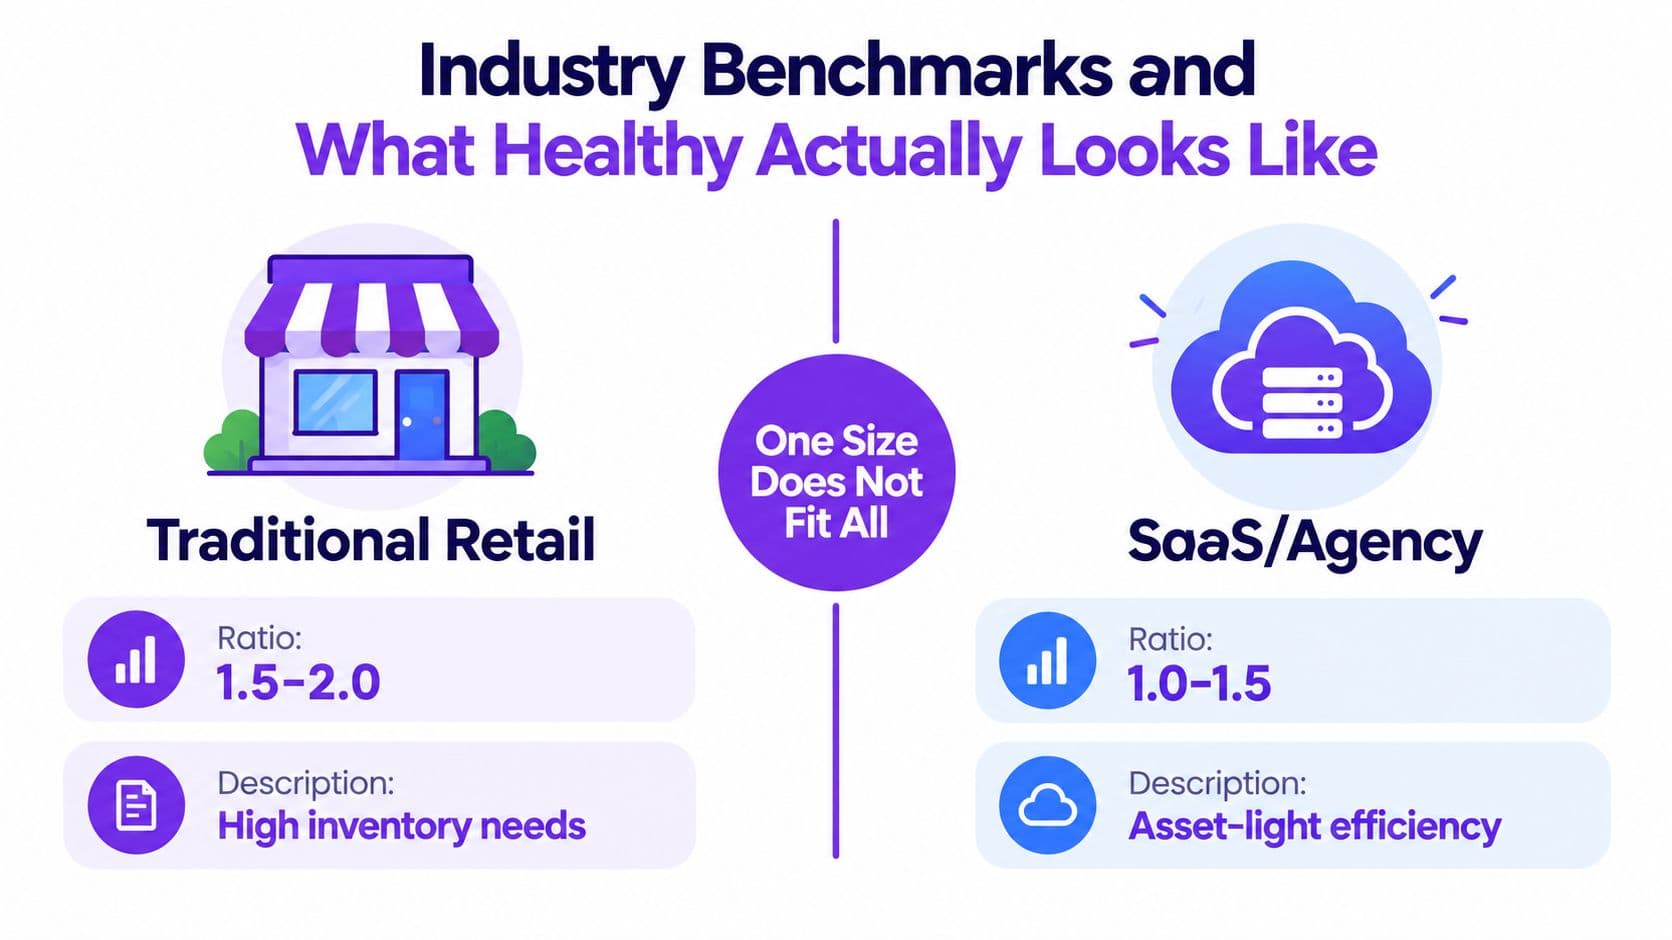
A commonly cited general range is approximately 1.5x to 3.0x, but Investopedia's current-ratio discussion treats the measure as a comparative liquidity indicator rather than a universal pass-or-fail score. Industry, collection speed, credit terms, seasonality, and the cash-conversion cycle all change the interpretation.
Academic research on companies listed on the Warsaw Stock Exchange found that universal benchmarks are problematic. A frequently suggested range of 1.2 to 2.0 served only as a rough guide, while the observed first quartile was 1.1 and the third quartile was 2.3. The point isn't to import those figures into your SaaS dashboard. The point is that distribution and comparability matter.
Compare business mechanics, not labels
| Business characteristic | Effect on interpretation |
|---|---|
| Rapid collections | A lower ratio may be manageable |
| Slow collections | A higher ratio may still conceal pressure |
| Customer cash collected in advance | Cash and deferred revenue require joint analysis |
| Significant inventory | The current ratio may overstate liquidity |
| Supplier-financed operations | Current liabilities may support an efficient model |
| Seasonal billing or payments | A period-end snapshot may distort the trend |
BDC characterizes a ratio above 2.0 as potentially indicating excessive current assets and underemployed capital. That doesn't mean you should force the ratio lower. It means you should ask whether the excess is productive cash, necessary operating liquidity, or capital sitting idle.
A SaaS company shouldn't automatically copy a retail benchmark because it doesn't carry the same inventory burden. An agency shouldn't assume strong receivables are equivalent to cash. Track your ratio consistently, compare it with highly similar companies, and investigate significant changes in receivables, deferred revenue, payables, and cash. The cash-conversion-cycle analysis adds the timing perspective that the ratio alone lacks.
Beyond the Ratio, Testing Liquidity Quality
A ratio above 1.0 indicates that reported current assets exceed current liabilities. It doesn't prove that you can pay every bill on time. The assets may convert to cash after the liabilities fall due.
Start with the quick ratio:
Quick ratio = (Current assets − Inventory) ÷ Current liabilities
For an asset-light SaaS company, inventory may be immaterial, so the more important adjustments often involve receivables, prepaid expenses, and restricted cash. For a service business, aged invoices deserve immediate scrutiny. An invoice listed as current isn't necessarily collectible on the date your payroll clears.
Build a practical liquidity bridge
Use a short schedule that moves from reported assets to cash you can reasonably use:
- Begin with reported current assets.
- Remove restricted cash and other unavailable balances.
- Separate receivables by age and expected collection timing.
- Exclude prepaid expenses from near-term cash resources.
- Map expected collections against payroll, taxes, debt, and committed vendor payments.
- Compare the result with a 13-week cash forecast.
The documented agency example makes the issue concrete. $180,000 of current assets divided by $100,000 of current liabilities produces a 1.8 ratio, but if $120,000 consists of invoices more than 90 days overdue, only $60,000 is readily available. That immediately liquid amount covers 0.6 times the current liabilities.
Practical rule: Treat the reported ratio as an accounting measure, then calculate a second view based on when assets will actually become cash.
SaaS requires a deferred-revenue review
Deferred revenue is normally a current liability when the related service is expected within the current horizon. It represents a real performance obligation, but it doesn't behave like a trade payable that demands immediate cash settlement.
That distinction doesn't justify excluding deferred revenue from the standard calculation. It means you should interpret the ratio alongside operating cash flow, renewal timing, receivables aging, and the cash-conversion cycle. Annual prepayments can improve cash today while creating future delivery obligations, so a temporary balance-sheet improvement doesn't prove durable monthly liquidity.
Use a structured liquidity analysis to answer the question that generic ratio guides skip: How much of the current ratio is available before the next operating obligations fall due?
Red Flags and Warning Signs in Your Working Capital
A low ratio deserves investigation, not panic. A high ratio deserves investigation, not congratulations. The warning sign is usually the movement behind the number.
Look for these diagnostic patterns
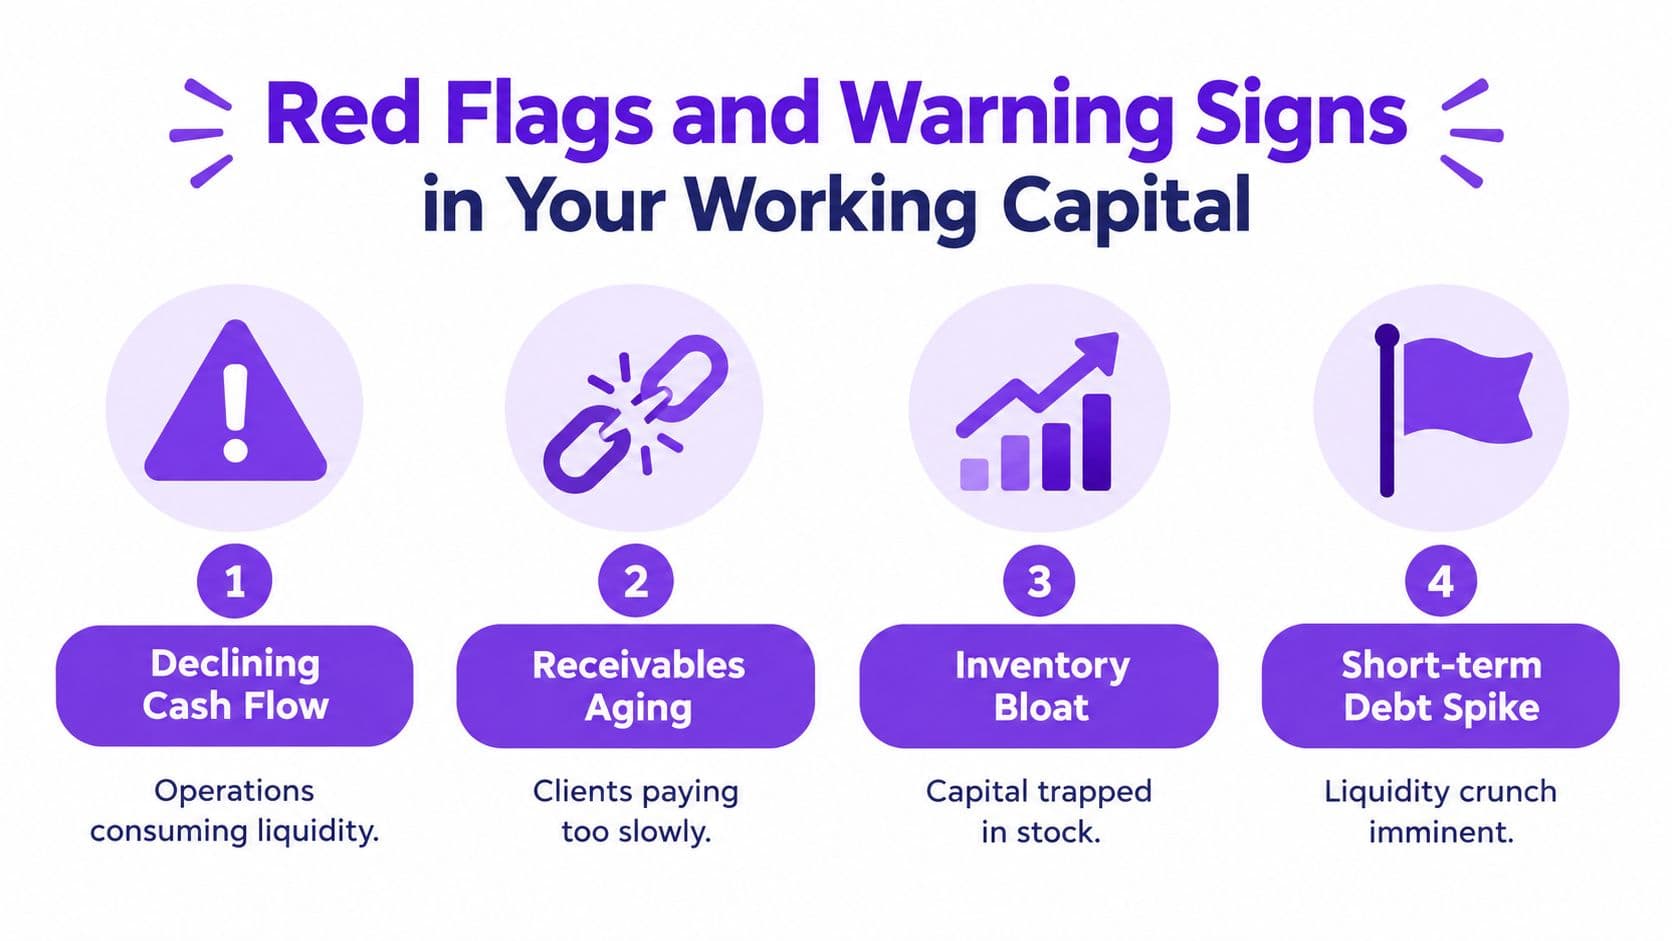
- Receivables aging: Customers pay later while reported current assets remain unchanged. Review the aging report and collection commitments.
- Payables growth: Accounts payable and accrued liabilities rise without a corresponding explanation in operating activity.
- Restricted cash: Cash appears in current assets but isn't available for ordinary payroll, tax, or vendor payments.
- Deferred-revenue concentration: A large share of current liabilities relates to future service delivery, so compare the balance with renewal timing and delivery capacity.
- Short-term debt pressure: Current debt maturities compete with normal operating payments.
- Inventory accumulation: Stock grows while sell-through slows, leaving capital trapped in assets that don't fund immediate obligations.
BDC also notes that a ratio above 2.0 can indicate excessive current assets. That may mean idle cash or excess inventory, not superior financial performance. Conversely, a ratio below 1.0 indicates negative net working capital, but rapid collections and supplier-financed operations can make a lower figure workable in some business models.
Don't use an arbitrary aging threshold as a substitute for analysis. Ask whether specific invoices are collectible, whether customers dispute them, and whether the cash forecast assumes collections that haven't been confirmed. For DTC operators and agencies, this DTC growth playbook for cash flow offers useful context for thinking about cash timing and operating commitments.
Action Steps to Improve Your Working Capital Ratio
Improvement starts with diagnosis. Raising the ratio by borrowing, delaying vendors, or collecting annual prepayments can make the balance sheet look better while increasing future obligations.
Improve collections without damaging revenue
Create an accounts-receivable dashboard that shows invoice age, customer owner, dispute status, promised payment date, and expected cash date. Give account managers responsibility for disputed invoices, while finance owns collection follow-up and cash forecasting.
For a project-based agency, tighten milestone billing and require approval before work continues on materially overdue accounts. For SaaS, review failed payments, renewal timing, annual versus monthly billing, and the relationship between recognized revenue and cash receipts. Faster collections improve liquidity quality because they convert an accounting asset into usable cash.
Negotiate timing on both sides
Ask key suppliers for payment terms that match your customer collection cycle. Don't extend payables beyond commercially reasonable terms just to increase the ratio. That approach can damage supplier relationships and create a later payment wall.
Review vendor subscriptions, contractor schedules, tax obligations, and debt maturities together. A controller should map these commitments against expected collections, not assess them as isolated ledger balances. You can then decide whether to accelerate invoices, stagger payments, or preserve cash for an unavoidable obligation.
Use a 13-week cash sprint
Refresh a rolling 13-week forecast each week. Record opening cash, expected customer receipts, payroll, taxes, debt service, vendor payments, and other committed outflows. Mark each collection as high, medium, or low confidence, then compare the forecast with the balance-sheet ratio.
Annual prepayments deserve special care. They can increase cash and improve the reported ratio, but they also increase deferred revenue and future delivery obligations. Collecting cash early is useful when the business can deliver profitably and retain customers. It isn't a substitute for recurring collection discipline.
Choose the right operating model
| Approach | Works well when | Main trade-off |
|---|---|---|
| DIY spreadsheet | Your accounts are reconciled and line items are simple | Manual updates create delay and classification risk |
| Bookkeeper support | Transaction volume is growing and reconciliations consume founder time | You still need controller-level review for interpretation |
| Outsourced controller | You need reliable closes, forecasts, and investor-ready reporting | Requires documented processes and access to financial systems |
| Fixed-fee cash sprint | You need a focused 13-week forecast or cleanup | It doesn't replace ongoing monthly control |
A five-day close is useful only when reconciliations, revenue recognition, payroll, and accruals are accurate. It shouldn't be treated as a cosmetic reporting target. If your books need cleanup, start with account reconciliation and classification before relying on trend data. Resources on how to improve working capital can help you turn the calculation into an operating routine.
If you need a practical explanation of ways to unlock trapped cash with Nexist, focus on collection speed, payment timing, and the cash-conversion cycle rather than chasing a benchmark in isolation. The best action is the one that improves usable liquidity without creating a larger obligation later.
Jumpstart Partners provides outsourced bookkeeping and controller support for SaaS, agencies, and other businesses generating $500K to $20M in revenue, including reconciliations, ASC 606 workflows, 13-week cash flow sprints, and month-end reporting. If your working capital ratio doesn't match your cash reality, visit Jumpstart Partners to discuss a balance-sheet cleanup, liquidity review, or ongoing controller engagement.