Financial Operations
Scenario Planning for Growing SaaS and Agencies
Master scenario planning for your SaaS or agency. Build base, upside, and downside models, track cash flow triggers, and make faster financial decisions.
ByJumpstart Partners, CPA, QuickBooks ProAdvisor
··16 min readA single annual forecast gives you precision where you need range and confidence where you need preparation. It tells you what the business should earn, spend, and collect if the assumptions hold. The first late payment, unexpected churn increase, margin squeeze, or hiring delay then turns the forecast into fiction.
That's why scenario planning shouldn't be treated as a strategy offsite exercise. For a growing SaaS company, agency, or professional services firm, its real value is operational. You need clear financial cases, measurable trigger points, assigned owners, and pre-approved actions that protect cash before a problem becomes a crisis.
Table of Contents
- Why Single-Point Forecasts Fail Growing Companies
- Building Your Base, Upside, and Downside Scenarios
- Modeling SaaS and Agency Cash Flow Scenarios
- Turning Scenarios Into Operating Triggers
- Red Flags That Invalidate Your Financial Scenarios
- Integrating Scenario Planning With Month-End Close
Why Single-Point Forecasts Fail Growing Companies
The annual budget fails at the exact moment you need it most. It usually reflects one set of assumptions about demand, conversion, hiring, collections, pricing, and costs. Once those assumptions change, the spreadsheet doesn't tell you what to do. It becomes outdated.
A single-point forecast also encourages false certainty. Leaders start treating the base case as a promise instead of a working view. Sales gets measured against optimistic bookings, finance watches accrual revenue while cash arrives late, and the leadership team discovers the liquidity problem only when payroll or tax obligations are close.
Forecasting and scenario planning serve different purposes. Forecasting estimates the most likely outcome from current information. Scenario planning tests several coherent outcomes so you can decide what actions belong to each one. It isn't an attempt to predict the exact future, and it shouldn't assign arbitrary probabilities to every possibility.
Royal Dutch Shell helped establish this discipline as a modern corporate-management practice. Its first scenario exercise took place in 1967, its first formal oil-price scenarios reached senior executives by 1971, and its planning team developed six scenarios in 1972. The Arab Oil Embargo in October 1973 then created an oil-price shock that broadly resembled risks explored in those scenarios, helping embed scenario analysis into Shell's planning process. The historical account is documented in the Business History Review analysis of Shell's scenario tool.
The budget versus the operating model
| Single-point budget | Scenario-based operating model |
|---|---|
| Presents one expected outcome | Compares several internally coherent outcomes |
| Updates slowly | Refreshes when material assumptions change |
| Measures variance after the fact | Defines actions before the variance becomes dangerous |
| Focuses on annual totals | Connects revenue, margin, collections, costs, and cash timing |
| Leaves decisions to management debate | Assigns owners and pre-authorized responses |
Contemporary adoption remains limited. The 2026 AFP FP&A Benchmarking Survey reported that only 38% of organizations use structured scenario planning, which means roughly 62% of surveyed organizations don't appear to use a formal, repeatable process. A separate 2025 FP&A Trends survey found that approximately 51% of respondents complete scenario-planning work in less than one week, showing that the process doesn't have to become a lengthy annual project. These findings are summarized in the 2025 FP&A Trends survey.
Practical rule: A scenario is useful only when it changes a decision, an owner, or a cash-protection action.
You don't need another elaborate budget meeting. You need a rolling view that answers practical questions. What happens if a major customer pays late? When does a higher CAC payback period make another sales hire irresponsible? What cash balance triggers a hiring pause? Which vendor commitments can be renegotiated before reserves become uncomfortable?
A structured quarterly review can help leadership revisit assumptions without waiting for year-end. Fluidwave's guide to structured quarterly reviews offers a useful cadence for that discipline, while a rolling forecast framework keeps the financial view connected to changing operating data.
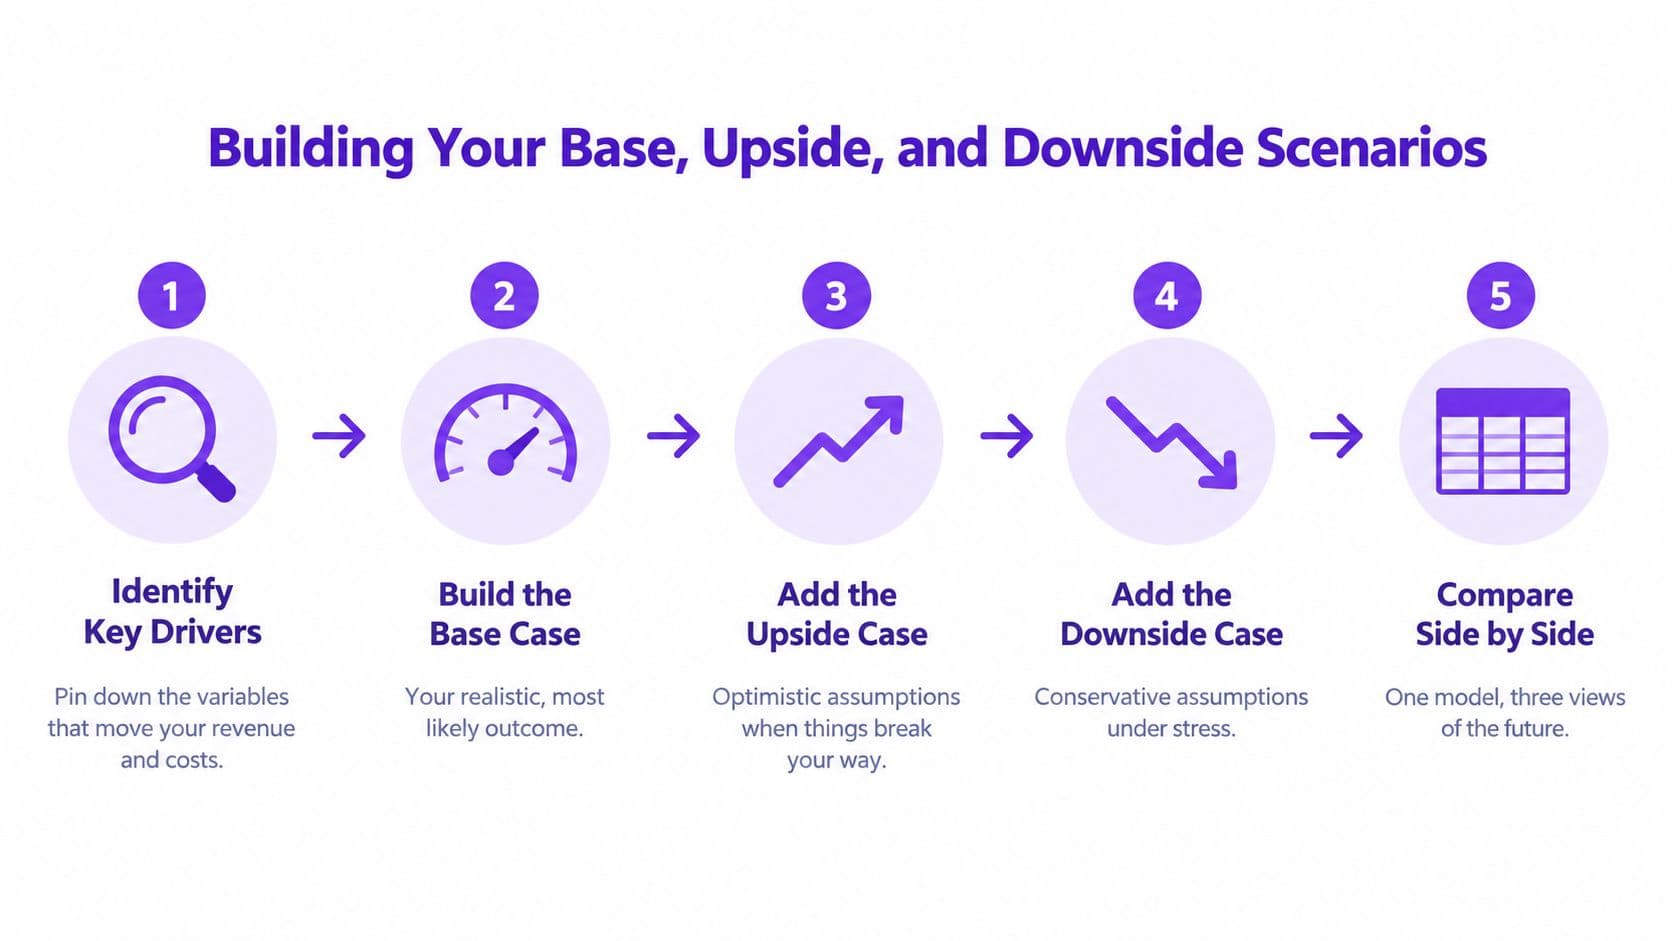
Building Your Base, Upside, and Downside Scenarios
You can build a useful three-case model with imperfect QuickBooks, billing, payroll, and CRM data. Waiting for a perfect data warehouse is an expensive excuse. The right model starts with a small set of material drivers and makes the assumptions visible.
Use this sequence.
Start with the drivers that move cash
Separate predetermined trends from genuine uncertainties. Predetermined trends include committed payroll, signed contracts, known debt payments, and recurring vendor obligations. Uncertain factors include new bookings, churn, sales conversion, collection speed, pricing changes, project utilization, and hiring timing.
Don't model every line item with equal detail. Select the drivers that can materially change revenue, gross profit, operating expenses, or cash timing. For a SaaS company, that usually means new customers, churn, average contract value, CAC, gross margin, and collections. For an agency, focus on signed backlog, utilization, project start dates, staffing, client concentration, and payment terms.
Build ranges, not decorative precision
Your base case should reflect the most defensible operating assumptions, not the outcome you want to present to the board. The upside case should show what happens when conversion, collections, pricing, or delivery performance beats the base assumptions. The downside case should stress the factors that threaten cash, including slower sales, higher churn, lower margin, delayed payments, or fixed costs that cannot be reduced quickly.
A practical model needs three layers:
- Operating drivers: customers, churn, bookings, utilization, pricing, headcount, vendor costs, and collections.
- Financial statements: revenue, gross profit, operating expenses, accounts receivable, liabilities, and cash.
- Decision outputs: ending cash, runway, hiring capacity, funding requirements, covenant pressure, and specific trigger points.
Test internal consistency. If the downside case assumes slower collections, accounts receivable and cash timing must reflect that. If the upside case adds sales hires, include the payroll and acquisition costs before counting the associated revenue. Scenario planning fails when teams change one attractive assumption while leaving every related cost untouched.
A clear capacity view matters for agencies and services firms. Use this guide to capacity planning methods to connect staffing availability, delivery commitments, and utilization assumptions instead of treating revenue growth as cost-free.
Use existing systems with confidence ratings
Your minimum viable data set can come from:
- QuickBooks or Xero: opening cash, payroll, vendor payments, debt, taxes, and historical expenses.
- Stripe, Shopify, or Square: actual receipts, refunds, payment timing, and recurring billing activity.
- CRM exports: pipeline stages, expected close dates, conversion, and customer concentration.
- Payroll software: committed compensation, planned hires, and contractor obligations.
- Signed contracts: backlog, renewal dates, billing terms, and delivery commitments.
Label each assumption as high, medium, or low confidence. A signed invoice with a known payment date deserves more confidence than an unqualified pipeline opportunity. A payroll obligation deserves more precision than an uncertain expansion deal. Your model becomes more useful when it makes uncertainty explicit instead of hiding it behind extra decimal places.
For a deeper view of how sales assumptions enter the model, compare your process with these sales forecasting methods. The objective isn't a more impressive spreadsheet. It's a model that tells you which assumption changed and what action follows.
Modeling SaaS and Agency Cash Flow Scenarios
Narratives don't fund payroll. Cash receipts and disbursements do.
Start with a direct-method 13-week cash-flow forecast. It tracks when cash enters and leaves the bank rather than when revenue or expenses appear under accrual accounting. Begin with opening cash, list weekly receipts, list weekly disbursements, and calculate net cash flow as receipts minus disbursements.
For example, if Monday opening cash is $180,000, weekly collections are $42,000, and payroll, vendors, taxes, and debt total $57,500, weekly net cash flow is $42,000 − $57,500 = −$15,500. Week-end cash is therefore $164,500. The model rolls forward each Monday by replacing estimates with actual results, investigating variances, dropping the oldest week, and adding a new thirteenth week. The direct-method mechanics are described in this 13-week cash-flow forecast guide.
Stress gross margin before approving growth
Gross margin determines how much recurring revenue is available to fund payroll, sales, marketing, and product investment. A benchmark summary citing OpenView's 2024 SaaS Benchmarks reports a 78% median gross margin for growth-stage B2B SaaS companies with $1 million to $10 million in annual recurring revenue, with the 25th percentile at 70% and the 75th percentile at 85%, as summarized by SaaS benchmark data from SaaSly.
At $100,000 of monthly recurring revenue, a 78% gross margin produces $78,000 of gross profit. At a 70% margin, the same revenue produces $70,000, an $8,000 monthly difference. Over a year, that gap is $96,000 before operating expenses. If annual recurring revenue is $1.2 million, the difference between those margin assumptions is still $96,000 of annual gross profit.
Your downside case should test whether hosting, support, payment processing, or implementation costs push margin toward the lower benchmark. Your upside case should show how much cash becomes available if margin reaches the higher benchmark. Revenue growth doesn't automatically improve liquidity.
Convert CAC payback into a hiring constraint
CAC payback gives you a direct test for whether additional acquisition spending is affordable. The calculation is CAC divided by monthly average revenue per account multiplied by gross-margin percentage.
Suppose customer acquisition cost is $12,000, monthly revenue per account is $2,000, and gross margin is 75%. Monthly gross profit is $2,000 × 75% = $1,500, so CAC payback is $12,000 ÷ $1,500 = 8 months. If CAC rises to $18,000, payback becomes 12 months. If gross margin falls to 60%, payback becomes $12,000 ÷ ($2,000 × 60%) = 10 months. The benchmark summary attributes a healthy LTV-to-CAC ratio above 3:1 and CAC payback under 12 months to OpenView's 2024 SaaS Benchmarks, with the calculation explained in this SaaS unit economics guide.
Bookings alone don't justify a sales hire. Test whether the resulting payback consumes cash faster than your collections replenish it.
Compare agency cash outcomes
The following example uses a $2 million agency, $160,000 opening cash, and committed outflows that change only in the upside case. The assumptions and arithmetic come from this strategic finance guide for small and midsize businesses.
| Scenario | Opening Cash | Collections | Outflows | Ending Cash |
|---|---|---|---|---|
| Base | $160,000 | $100,000 | $220,000 | $40,000 |
| Downside | $160,000 | $70,000 | $220,000 | $10,000 |
| Upside | $160,000 | $120,000 | $205,000 | $75,000 |
The downside case assumes a major client pays one month late. That single timing change reduces collections by $30,000 and leaves $10,000 of ending cash. The upside case combines stronger collections with delayed discretionary hiring, reducing outflows by $15,000.
The model should also show which week falls below your minimum operating cash threshold. Use a 13-week rolling cash-flow template to connect the three cases to weekly decisions rather than hiding the exposure in a quarterly total. For a broader modeling reference, a startup financial modeling guide can help structure the underlying assumptions.
Turning Scenarios Into Operating Triggers
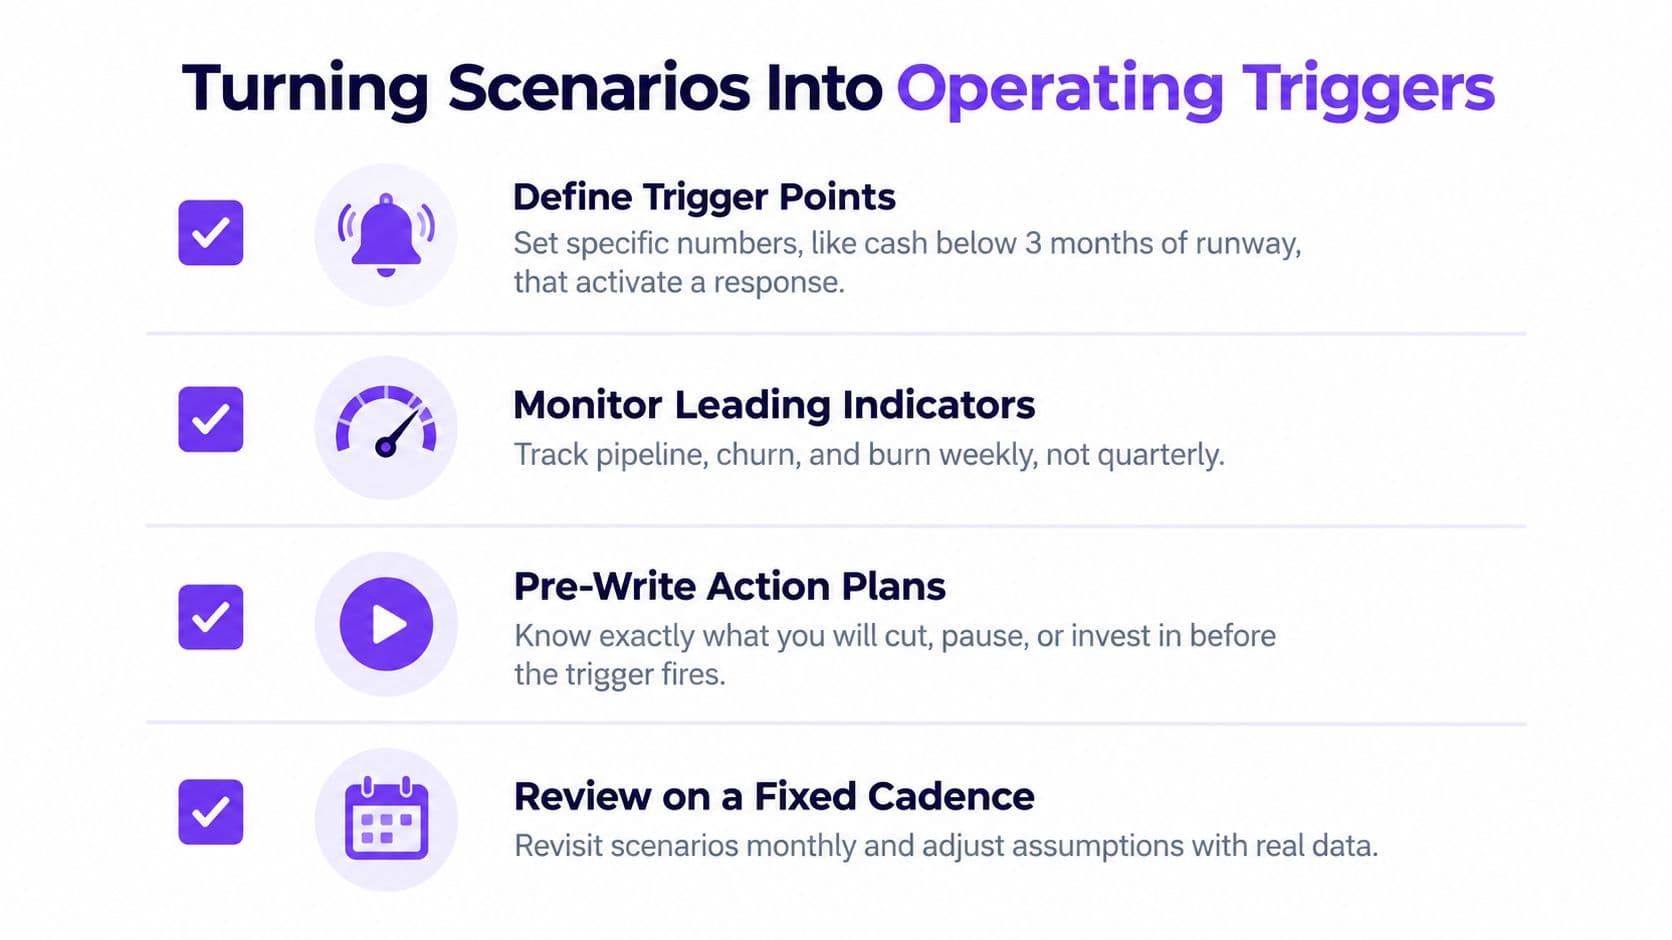
A scenario model that sits in a spreadsheet is not a management system. It becomes useful when a measurable change activates an agreed response without another round of emotional debate.
Start with the decision, then choose the metric. Don't begin with a dashboard full of vanity metrics. Begin with actions that protect cash or preserve profitable growth.
Create a trigger register
| Leading indicator | Trigger condition | Pre-authorized action | Decision owner |
|---|---|---|---|
| Pipeline conversion | Falls below the downside assumption | Pause incremental acquisition spending and review channel quality | Head of Sales |
| CAC payback | Moves beyond the approved payback limit | Stop adding acquisition capacity until unit economics recover | CEO and finance lead |
| Collections | Customer payments deteriorate against the weekly plan | Accelerate collections, contact late accounts, and renegotiate vendor timing | Controller |
| Cash balance | Weekly cash falls below the minimum operating threshold | Activate the 13-week cash plan and pause discretionary hiring | CEO and finance lead |
| Gross margin | Hosting, support, or delivery costs compress margin | Reprice, reduce variable costs, or change service scope | COO or product leader |
The table shouldn't contain thresholds your team can't calculate consistently. Use the data already available in your billing, CRM, payroll, and accounting systems. Where data quality is weak, assign a confidence rating and improve the measurement rather than pretending the number is exact.
Pre-authorize the response
A trigger needs an action, an owner, and a deadline. “Monitor cash closely” isn't an action. “If weekly cash drops below the minimum threshold, the finance lead activates the 13-week plan and the CEO pauses discretionary hiring” is operational.
For each trigger, document four decisions:
- What changes: Name the metric and define the measurement method.
- When it fires: Specify the threshold and the review period.
- Who acts: Assign one accountable owner, not a committee.
- What happens next: List the action, approval level, and date for reassessment.
Use the same discipline for upside cases. If collections improve and CAC payback remains within the approved range, you can release a previously paused hire or increase a channel budget. Pre-authorization prevents the team from cutting too sharply during a short-term dip and prevents premature expansion during a temporary spike.
Run a fixed operating rhythm
Review leading indicators weekly and refresh the full scenario model monthly. Tie the review to your cash roll-forward and month-end close so the leadership team works from actual receipts, payments, churn, pipeline movement, and margin data.
The 2025 FP&A Trends survey reports that 51% of respondents can run scenarios within a week, while 22% take longer than a week and 19% can't run them at all. The same evidence identifies lack of tools, cross-functional alignment, and data quality as major barriers. Those findings are summarized in the research on scenario planning implementation barriers.
Your advantage doesn't come from building a perfect model. It comes from making the response faster than the deterioration.
Red Flags That Invalidate Your Financial Scenarios
Most broken scenarios fail for behavioral reasons, not spreadsheet reasons. Leadership teams use the base case as a promise, treat booked revenue as collected cash, or create a model so complex that nobody trusts the output.
You call the base case the forecast
The base case is a planning view, not a guarantee. If your board materials show one number and your internal model contains three cases, the organization will still anchor on the most comfortable outcome. Label the cases plainly and show what would have to be true for each one to occur.
A base case also needs a review date. If churn, conversion, collections, or gross margin moves materially, update the assumptions and document why. Don't change the result without explanation while leaving the original drivers untouched.
You confuse accrual revenue with cash
A signed contract isn't the same as a bank receipt. Accrued revenue can look healthy while customer payments arrive late, deposits fall short, or an agency carries payroll for work that hasn't been collected. Your scenario model must include the timing of invoices, deposits, payment terms, collections, taxes, payroll, debt, and vendor obligations.
A useful liquidity analysis should answer when cash arrives, not only how much revenue the income statement recognizes. Use this liquidity analysis framework to keep the cash question separate from the profitability question.
You build false precision
A model with detailed monthly line items can still be wrong if its assumptions are stale. Resource-constrained teams face expensive data, incompatible systems, limited expertise, funding constraints, and the time burden of maintaining models, as documented in the Federal Highway Administration synthesis on scenario planning barriers.
Recent FP&A survey evidence reports that 18% cite data issues as a major barrier, 24% cite poor organizational alignment, and 39% cite lack of tools. It also reports that 8% see no value in scenario planning. Treat these as operating problems to solve, not reasons to abandon the process.
Use ranges where the data is uncertain. Use precise values where the obligation is fixed. A simple model based on a few material drivers will beat a detailed model nobody can explain.
You have no trigger owner
If the model identifies a downside but doesn't name the person responsible for acting, it hasn't protected the company. Assign the owner before the trigger fires. Otherwise, sales, operations, finance, and the CEO will each assume somebody else is handling the response.
A scenario without an owner is an observation, not a plan.
Integrating Scenario Planning With Month-End Close
Scenario planning belongs inside financial governance, not in a separate annual planning folder. Your month-end close gives you the natural point to replace assumptions with actual results, investigate variances, and refresh the drivers that influence cash.
Use this cadence:
- Close the books: Finalize revenue, expenses, receivables, payables, payroll, and cash activity.
- Replace estimates: Update the rolling forecast with actual results and remove stale assumptions.
- Explain variances: Identify whether the difference came from volume, price, churn, margin, timing, or a one-time item.
- Refresh the cases: Change only the assumptions supported by new information. Keep a record of what changed.
- Update the trigger register: Confirm which actions remain active, which thresholds need review, and who owns each response.
- Roll the cash view: Replace the completed week with actual cash activity, drop the oldest week, and add a new thirteenth week.
A fast close matters because stale financials produce stale scenarios. If management receives reliable statements late, the team makes hiring, spending, and fundraising decisions from old information. Month-end close automation guidance can help connect reconciliations, reporting, and scenario updates into one repeatable process.
For teams with limited internal finance capacity, an outsourced controller can maintain the close, cash forecast, variance analysis, and trigger reporting. The standard should be simple: every month, you know what changed, how it affects cash, and which decision is already authorized.
Jumpstart Partners provides outsourced controller and bookkeeping services for growing SaaS, agency, and professional services businesses, including scenario planning, 13-week rolling cash-flow forecasts, payroll runway calculations, and burn-rate analysis. Visit Jumpstart Partners to discuss a Cash Flow Clarity Sprint or ongoing controller support that turns your financial assumptions into operating decisions.