Financial Operations
What Is Asset Turnover: Boost SaaS Efficiency
What is asset turnover & why it matters for SaaS? Learn the formula, calculate it, & see benchmarks to improve your capital efficiency.
ByJumpstart Partners, CPA, QuickBooks ProAdvisor
··16 min readRevenue growth can hide a capital efficiency problem. That’s why smart operators look past the income statement and ask a harder question: how much revenue are you generating from the assets sitting on your balance sheet?
For private SaaS companies under $20M ARR, projected 2026 SaaS Capital Index data shows a median total asset turnover of 2.8 and a top quartile of 4.1, meaning top performers generate 46% more revenue from the same asset base. The same source notes that a declining ratio is often the first sign of unsustainable cash burn during growth phases, according to Tractian’s asset turnover overview.
If you run a SaaS company, digital agency, or professional services firm, this matters more than most founders realize. You don’t have factories. You usually don’t carry much inventory. So when asset turnover weakens, the culprit is often something more subtle and more fixable: bloated accounts receivable, excess cash sitting idle, messy revenue recognition, or balance sheet sprawl that nobody is managing with intent.
The Hidden Drag on Your Company's Growth
A lot of businesses hit a ceiling because they focus on revenue and gross margin while ignoring asset efficiency. That’s a mistake. If your company keeps adding assets faster than it adds revenue, you’re burning capital to stand still.
For asset-light businesses, this problem is easy to miss. A SaaS founder sees strong ARR growth and assumes the business is efficient. An agency owner sees a solid pipeline and assumes the engine is healthy. Meanwhile, receivables stretch, deferred revenue gets misread, cash piles up without a plan, and the balance sheet gets heavier than the revenue engine it’s supposed to support.
Why this ratio matters more than founders think
Asset turnover tells you how effectively you convert assets into revenue. It’s one of the cleanest measures of operating discipline because it cuts through the story you tell yourself and shows what your business is doing with the resources already on hand.
A company can look healthy on the surface and still be operationally sloppy underneath. That’s especially common when reporting focuses on bookings, MRR, utilization, or margin, but nobody is actively reviewing working capital and balance sheet efficiency.
Practical rule: If your growth requires steadily more cash, more receivables, and more balance sheet buildup without a clear lift in revenue efficiency, you don’t have a scale problem. You have a capital efficiency problem.
Founders who want a clear read on this should start by getting sharper on the balance sheet itself, not just the P&L. If that’s an area your team glosses over, review how to analyze a balance sheet and tie every major asset line to revenue output.
Why SaaS and agencies need a different lens
Standard definitions of what is asset turnover often assume inventory, machinery, and heavy fixed assets. That’s not your world. In SaaS and services, the story usually lives in:
- Accounts receivable from slow collections or enterprise payment terms
- Cash balances that aren’t being deployed intentionally
- Contract assets or unbilled work in service businesses
- Deferred revenue dynamics that distort how founders interpret the balance sheet
That’s why generic advice on this metric is often useless for your business model. You need to interpret the ratio through the lens of billing, collections, revenue recognition, and service delivery discipline.
What Asset Turnover Really Measures
Asset turnover is simple on paper and easy to misread in practice.
The formula is Net Sales ÷ Average Total Assets. It measures how many dollars of revenue your company generates for every dollar invested in assets. According to The Forage’s explanation of asset turnover, this ratio has been part of the DuPont analysis framework since the 1920s and directly captures revenue generated per dollar of assets. The same source notes that firms in the top quartile for asset turnover in their industry experience 10% higher revenue growth than peers.
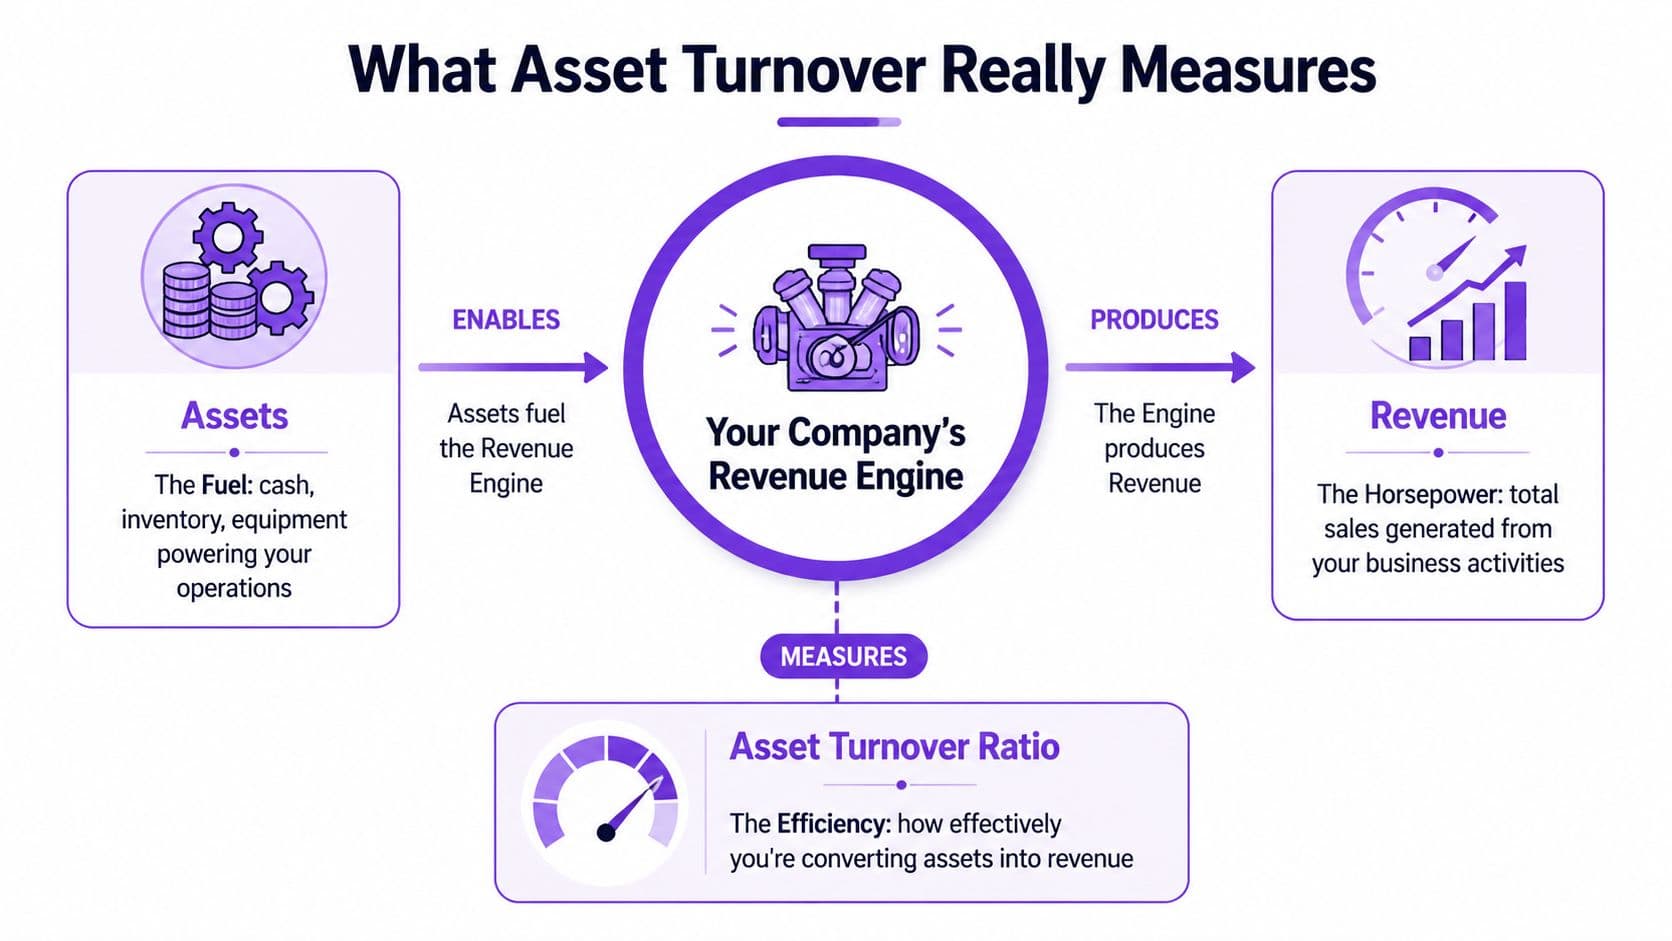
Your balance sheet is the fuel tank
Think of your company as a revenue engine.
Your net sales are the output. Your average total assets are the fuel committed to producing that output. Asset turnover tells you whether the engine is using that fuel efficiently or wasting it.
For a SaaS or service business, “assets” usually includes more than founders expect:
- Cash
- Accounts receivable
- Prepaids
- Software or equipment
- Contract assets or unbilled revenue
- Other current assets
If those balances rise but revenue doesn’t keep pace, your ratio drops. That drop is a signal, not a rounding error.
What goes into the formula
Here’s the plain-English version.
Net sales come from your income statement. For SaaS, that’s recognized subscription and service revenue, not cash collected. For agencies, it’s earned project or retainer revenue after returns or allowances if those apply.
Average total assets come from your balance sheet. You add beginning total assets and ending total assets, then divide by two.
Asset turnover isn’t a vanity KPI. It’s a test of whether your balance sheet is supporting growth or slowing it down.
The ratio works because it forces one question: are your assets productive?
A standard teaching example makes this intuitive. A company with $1,000,000 in net sales and $500,000 in average total assets has an asset turnover ratio of 2.0, meaning it generates $2 in sales for every $1 in assets. That’s a useful mental model, even if your own business has more complexity.
What founders often get wrong
The biggest misconception is that asset-light businesses should always post sky-high ratios.
Not necessarily.
SaaS companies can show lower ratios during periods of cash accumulation, rising receivables, ASC 606 timing issues, or sloppy billing operations. Agencies can post mediocre ratios because work gets delivered before invoices go out, or because clients take too long to pay. The ratio is only useful if you connect it to operational behavior.
How to Calculate Asset Turnover for Your Business
You can calculate this in under ten minutes if your books are clean.
Start with your income statement and balance sheet. Pull net sales from the P&L. Pull total assets from the balance sheet for the beginning and end of the period. Then calculate average assets and divide sales by that number.
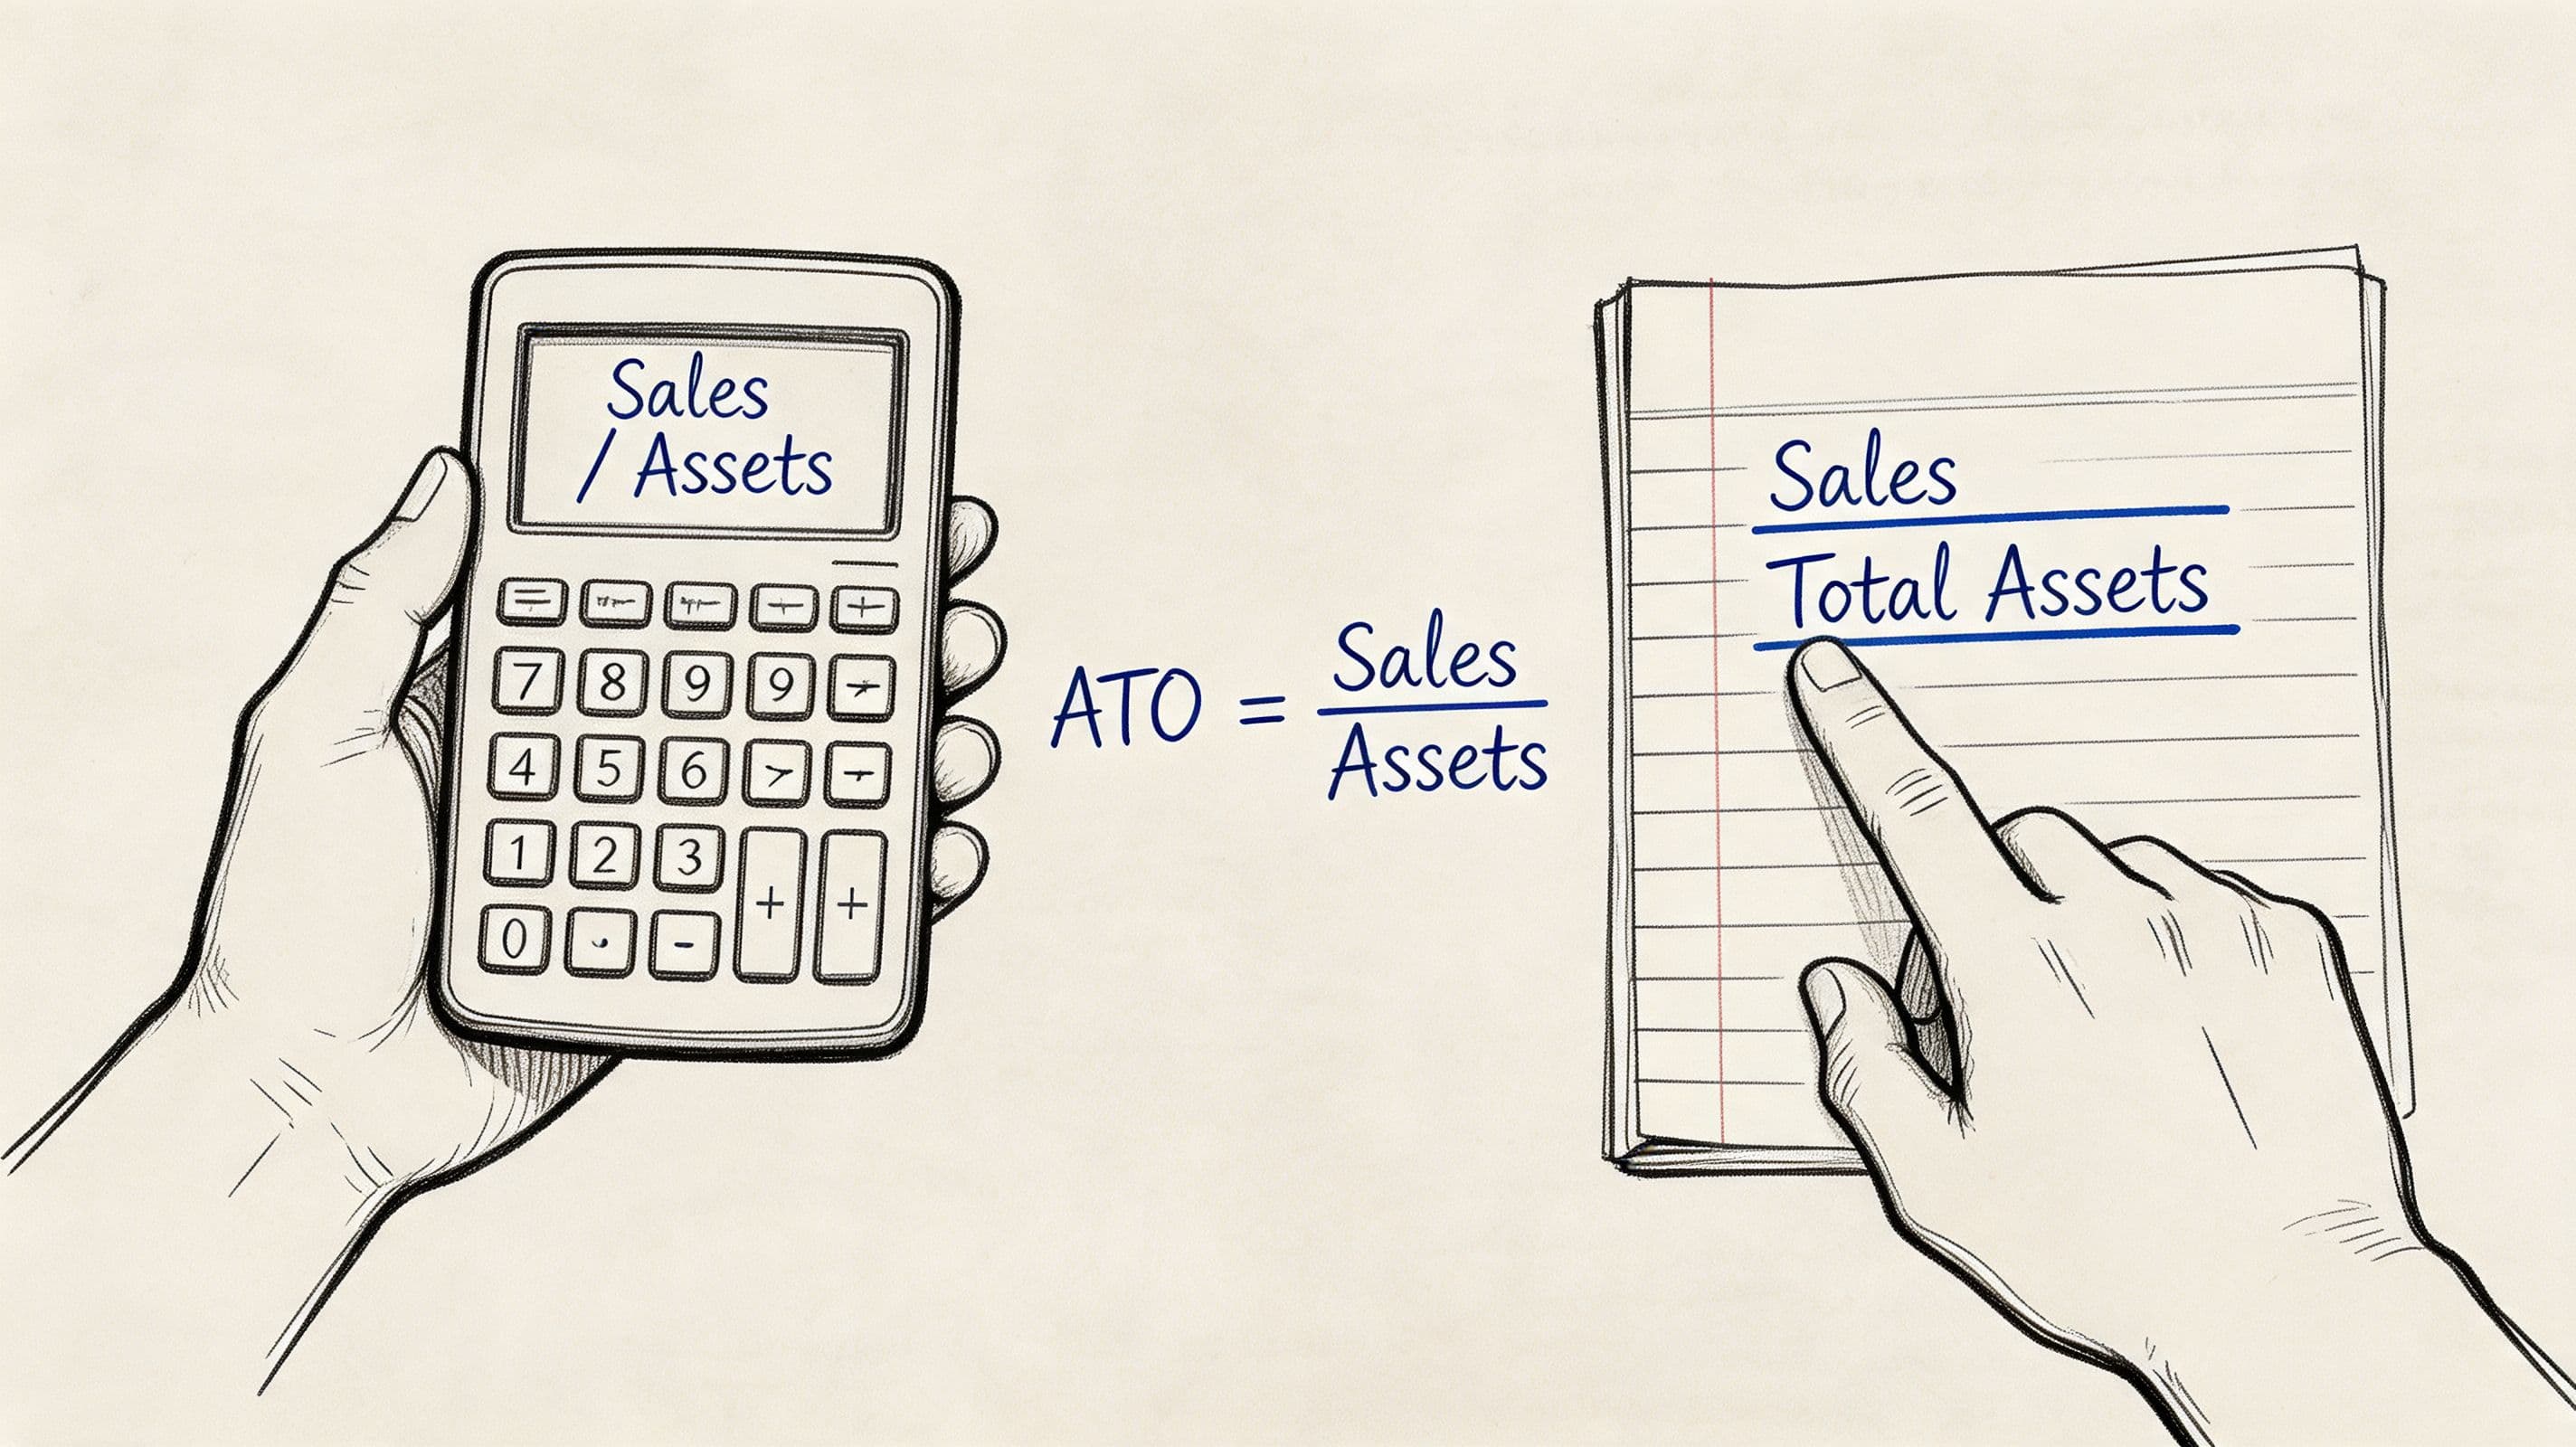
The formula
Asset Turnover = Net Sales ÷ Average Total Assets
Average Total Assets = (Beginning Assets + Ending Assets) ÷ 2
If your team needs a refresher on how financial statements connect before you run the calculation, review basic formulas of accounting.
Worked example for a SaaS company
Assume a SaaS business has recognized annual net sales of $1,000,000. Beginning total assets are $450,000 and ending total assets are $550,000.
Average total assets = ($450,000 + $550,000) ÷ 2 = $500,000
Asset turnover = $1,000,000 ÷ $500,000 = 2.0
That means the business generates $2 of revenue for every $1 of assets.
SaaS Co. Asset Turnover Calculation Example (2026)
| Line Item | Amount |
|---|---|
| Net Sales | $1,000,000 |
| Beginning Total Assets | $450,000 |
| Ending Total Assets | $550,000 |
| Average Total Assets | $500,000 |
| Asset Turnover Ratio | 2.0 |
For a SaaS company, the operational question isn’t just whether 2.0 is “good.” It’s why the asset base sits where it does. If receivables are high, billing is lagging, or cash is accumulating without a plan, the ratio may be weaker than it should be.
Worked example for a digital agency
Now take a digital agency with annual net sales of $1,000,000. Beginning total assets are $500,000 and ending total assets are $500,000.
Average total assets = ($500,000 + $500,000) ÷ 2 = $500,000
Asset turnover = $1,000,000 ÷ $500,000 = 2.0
Same ratio. Different business. Different diagnosis.
An agency usually gets into trouble when accounts receivable and unbilled work swell because invoicing trails delivery. If your team is unclear on revenue cleanup before calculating this ratio, especially for DTC or ecommerce lines, this guide on how to calculate net sales for your Shopify brand is a practical reference.
Here’s a quick walkthrough if you want to see the formula in action before running your own numbers:
Where to pull the numbers in QuickBooks or NetSuite
Use this checklist:
- Open the P&L and pull your period net sales or revenue.
- Open the balance sheet and note total assets at the start of the period.
- Note ending total assets for the same period.
- Average the two asset values.
- Divide net sales by average total assets.
- Compare the result to your own prior periods first, then to industry benchmarks.
Don’t overcomplicate this. If your close is clean, the math is easy. If the math feels hard, the books are usually the real problem.
Interpreting Your Ratio Industry Benchmarks and Red Flags
A ratio by itself doesn’t tell you much. Context does.
According to Quartr’s asset turnover analysis, Costco posted 3.2x in the US S&P 500 in 2023, while capital-heavy utilities sat at 0.4x. The same source reports that SaaS top performers from 2022 to 2025 were at 1.8x, compared with traditional software at 0.7x. That spread is exactly why you should never compare your SaaS business to a manufacturer or utility and call it analysis.
Asset Turnover Ratio Benchmarks by Industry (2026)
| Industry | Median Ratio | Implication |
|---|---|---|
| Private SaaS under $20M ARR | 2.8 | Strong asset-light efficiency is possible, but you need tight working capital control |
| Private SaaS top quartile | 4.1 | Elite capital efficiency from the same asset base |
| SaaS top performers benchmark | 1.8x | Scalable cloud economics support stronger turnover than traditional software |
| Traditional software | 0.7x | Heavier asset base or lower efficiency drags output |
| Retail leaders | 3.2x | Fast sales velocity and lean operating model drive high turnover |
| Utilities | 0.4x | Capital intensity suppresses the ratio by design |
| Manufacturing average in capital-intensive sectors | 0.5–1.0x | Lower turnover is normal, trend matters more than the headline number |
The expert view founders should adopt
“Industry-specific context is non-negotiable.”
That’s the right way to think about what is asset turnover. A low ratio in one business can be normal. The same number in another can be a warning sign that capital is getting trapped in the wrong places.
If you want faster diagnosis at scale, modern finance teams increasingly combine ratio review with workflow tooling and automated statement reviews. This practical guide on how AI analyzes financial statements is useful if you’re building a more systematic reporting process.
Red flags by business model
For SaaS
Watch for these patterns:
- Falling turnover with rising receivables. Sales are growing on paper, but cash conversion is slipping.
- Large cash balances with no deployment plan. Capital sits idle and drags efficiency.
- Confusion around deferred revenue and ASC 606. Reporting errors distort both assets and revenue interpretation.
For agencies and professional services
The common red flags are operational, not theoretical:
- Invoices go out late
- Clients pay on stretched terms
- Unbilled work accumulates
- Project delivery runs ahead of billing discipline
A ratio that trends down quarter after quarter usually means the business is funding client operations with its own balance sheet.
For ecommerce and DTC
Inventory and reconciliation discipline matter more. You also need to connect asset turnover with broader operating economics. If you’re evaluating capital efficiency alongside CAC, gross margin, and payback, make sure your team also understands what unit economics means in the full picture.
How Asset Turnover Drives Overall Profitability
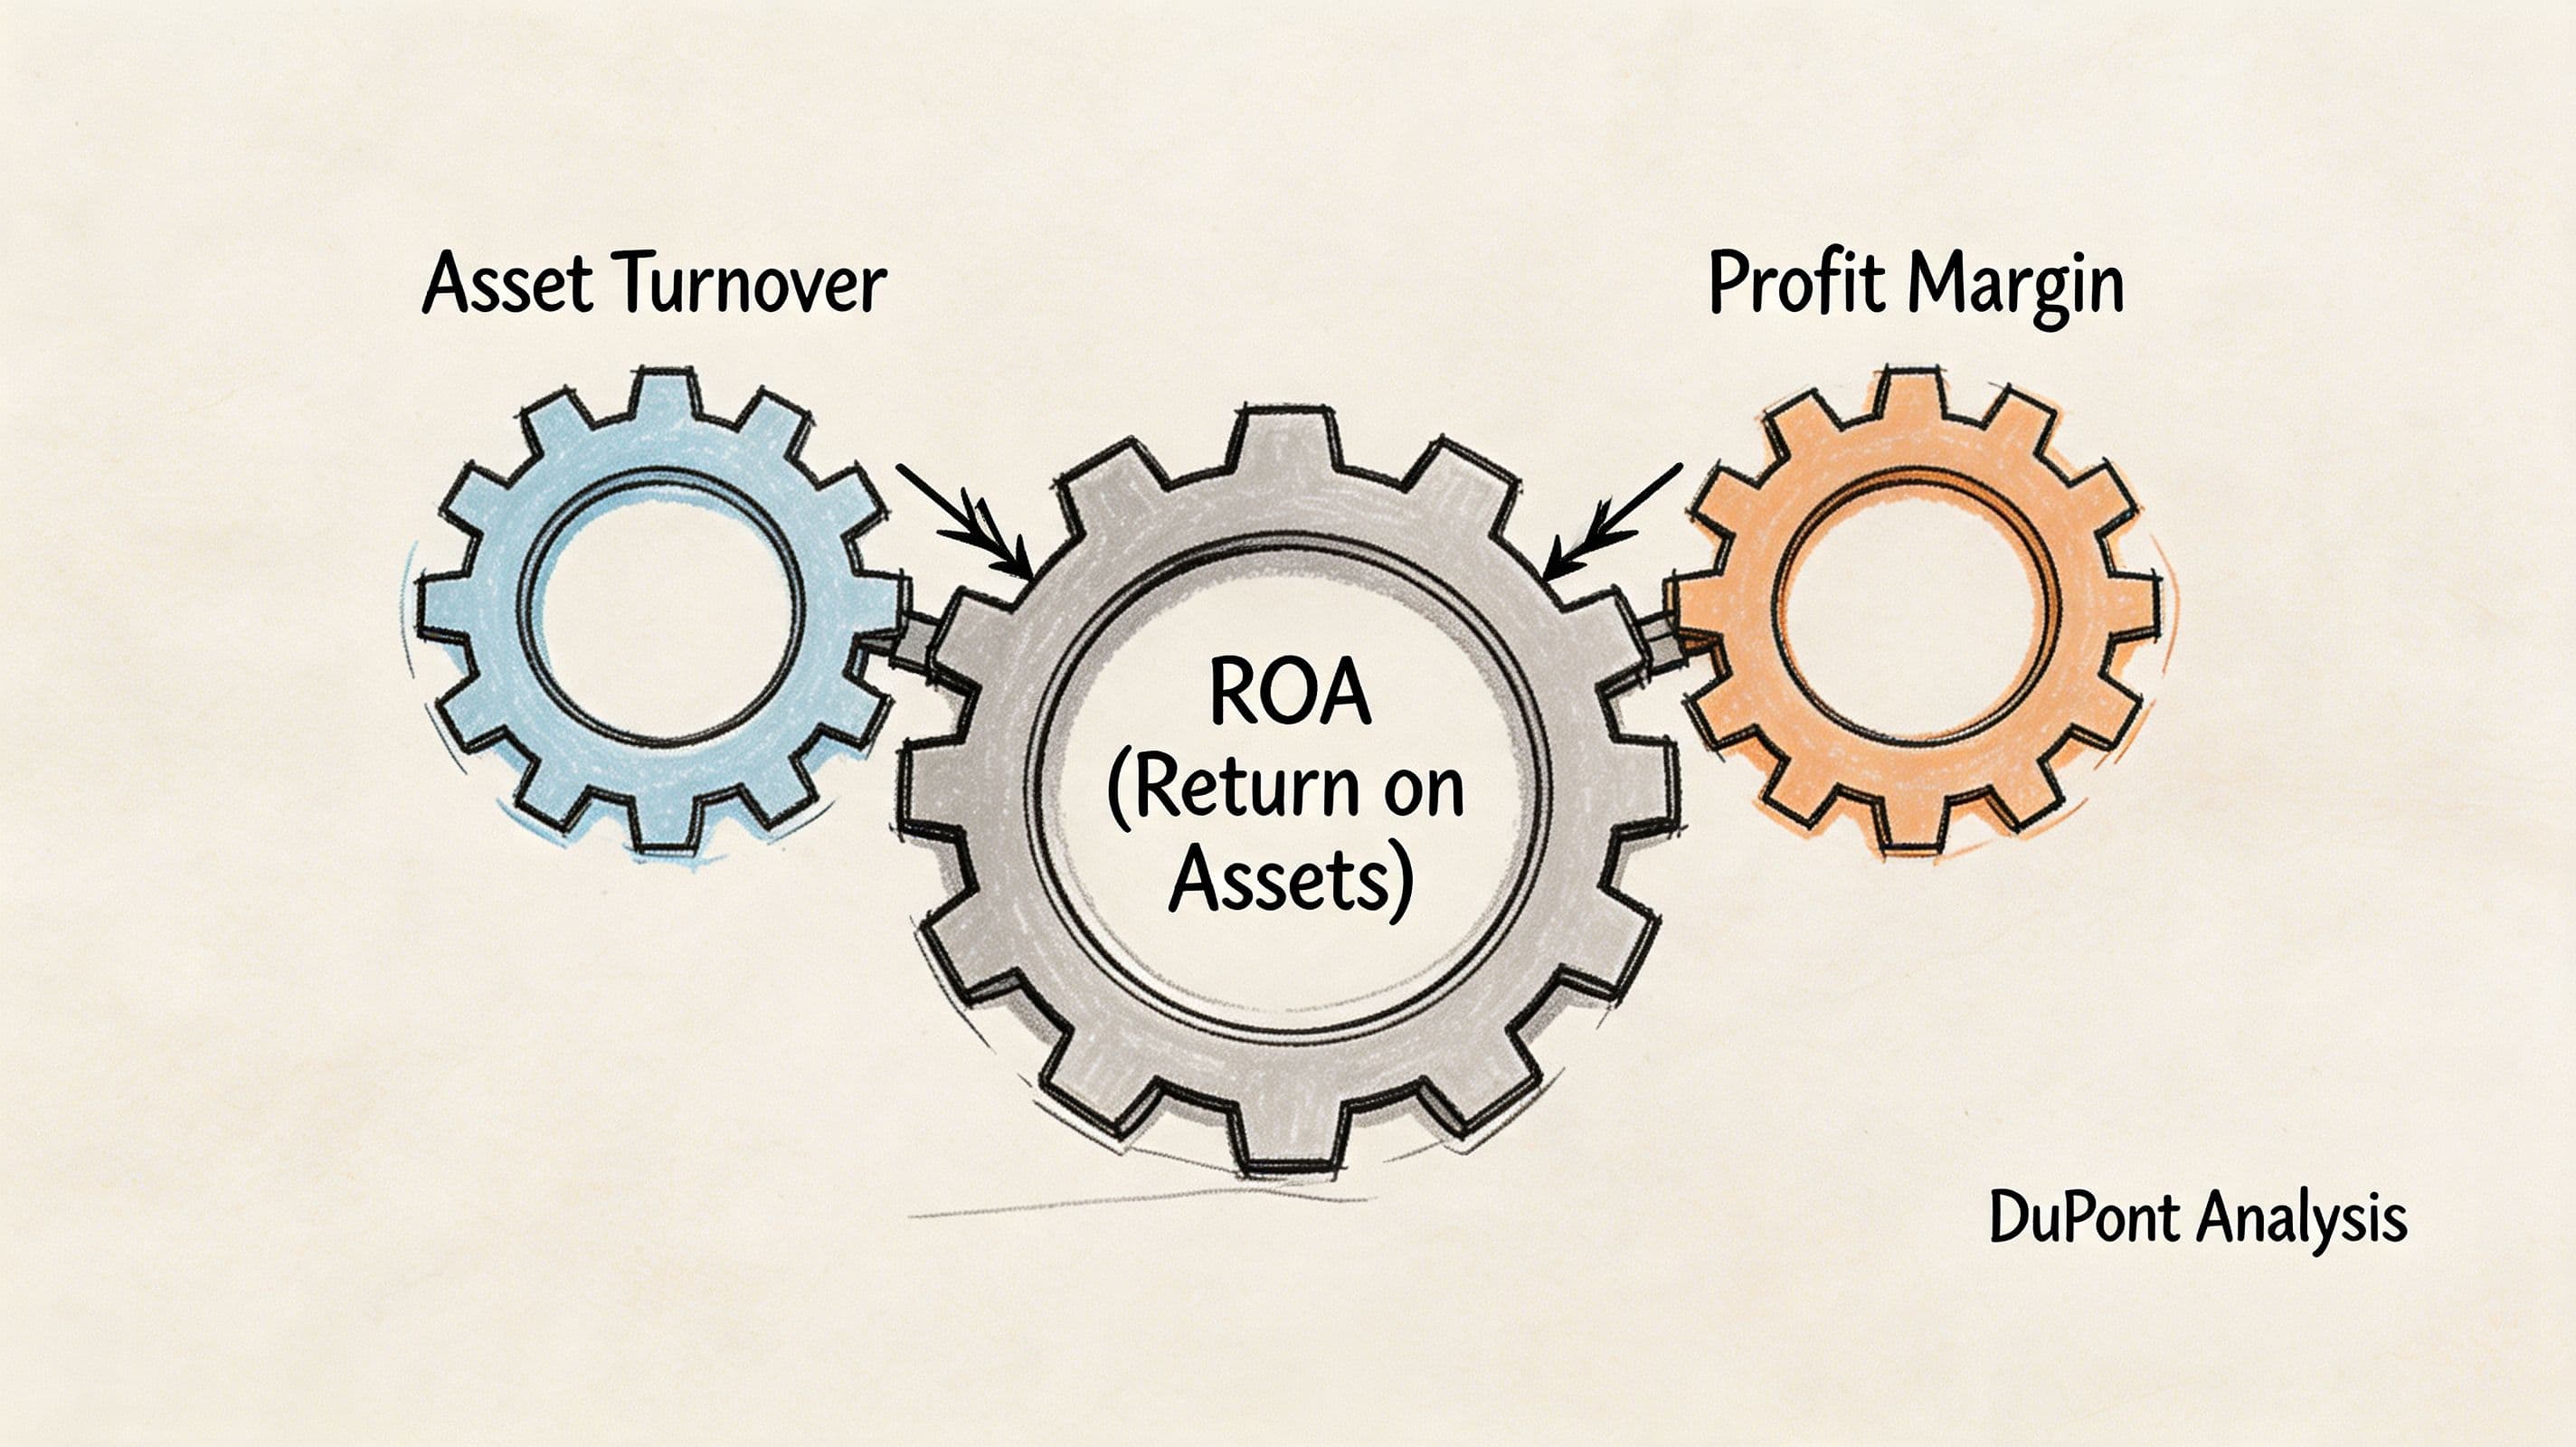
A lot of founders treat asset turnover as a side metric. It isn’t. It’s one of the gears that drives overall returns.
In the DuPont framework, return metrics improve when you either keep more profit from each dollar of sales or generate more sales from each dollar of assets. That’s why a business with average margins can still outperform if it runs with better asset efficiency.
Efficiency multiplies outcomes
Here’s the practical takeaway. If your margin is solid but assets are bloated, returns weaken. If your margin is thinner but your balance sheet is lean and productive, returns can still be strong.
That’s why finance leaders shouldn’t isolate profitability from balance sheet efficiency. They work together.
According to Corporate Finance Institute’s asset turnover resource, in capital-intensive sectors, a decline in asset turnover of over 10% year over year links to a 15% to 20% erosion in ROE via DuPont analysis. The same source notes that for DTC brands, optimizing inventory turns through Shopify and NetSuite reconciliations has lifted ATR by 18%.
What this means for SaaS and services
You probably don’t need to buy more equipment to grow. Your profitability problem is more likely tied to underused working capital than to fixed assets.
That shifts the operating question from “How do we cut costs?” to “Why does this much capital need to sit on the balance sheet to support current revenue?”
A high-margin company can still be financially lazy. Asset turnover exposes that laziness fast.
The management lens that actually helps
Review these two levers together every month:
| Lever | Question to ask |
|---|---|
| Profit Margin | Are you keeping enough from each dollar of revenue? |
| Asset Turnover | Are your assets producing enough revenue for their size? |
When one weakens, don’t assume the other will compensate. It often won’t.
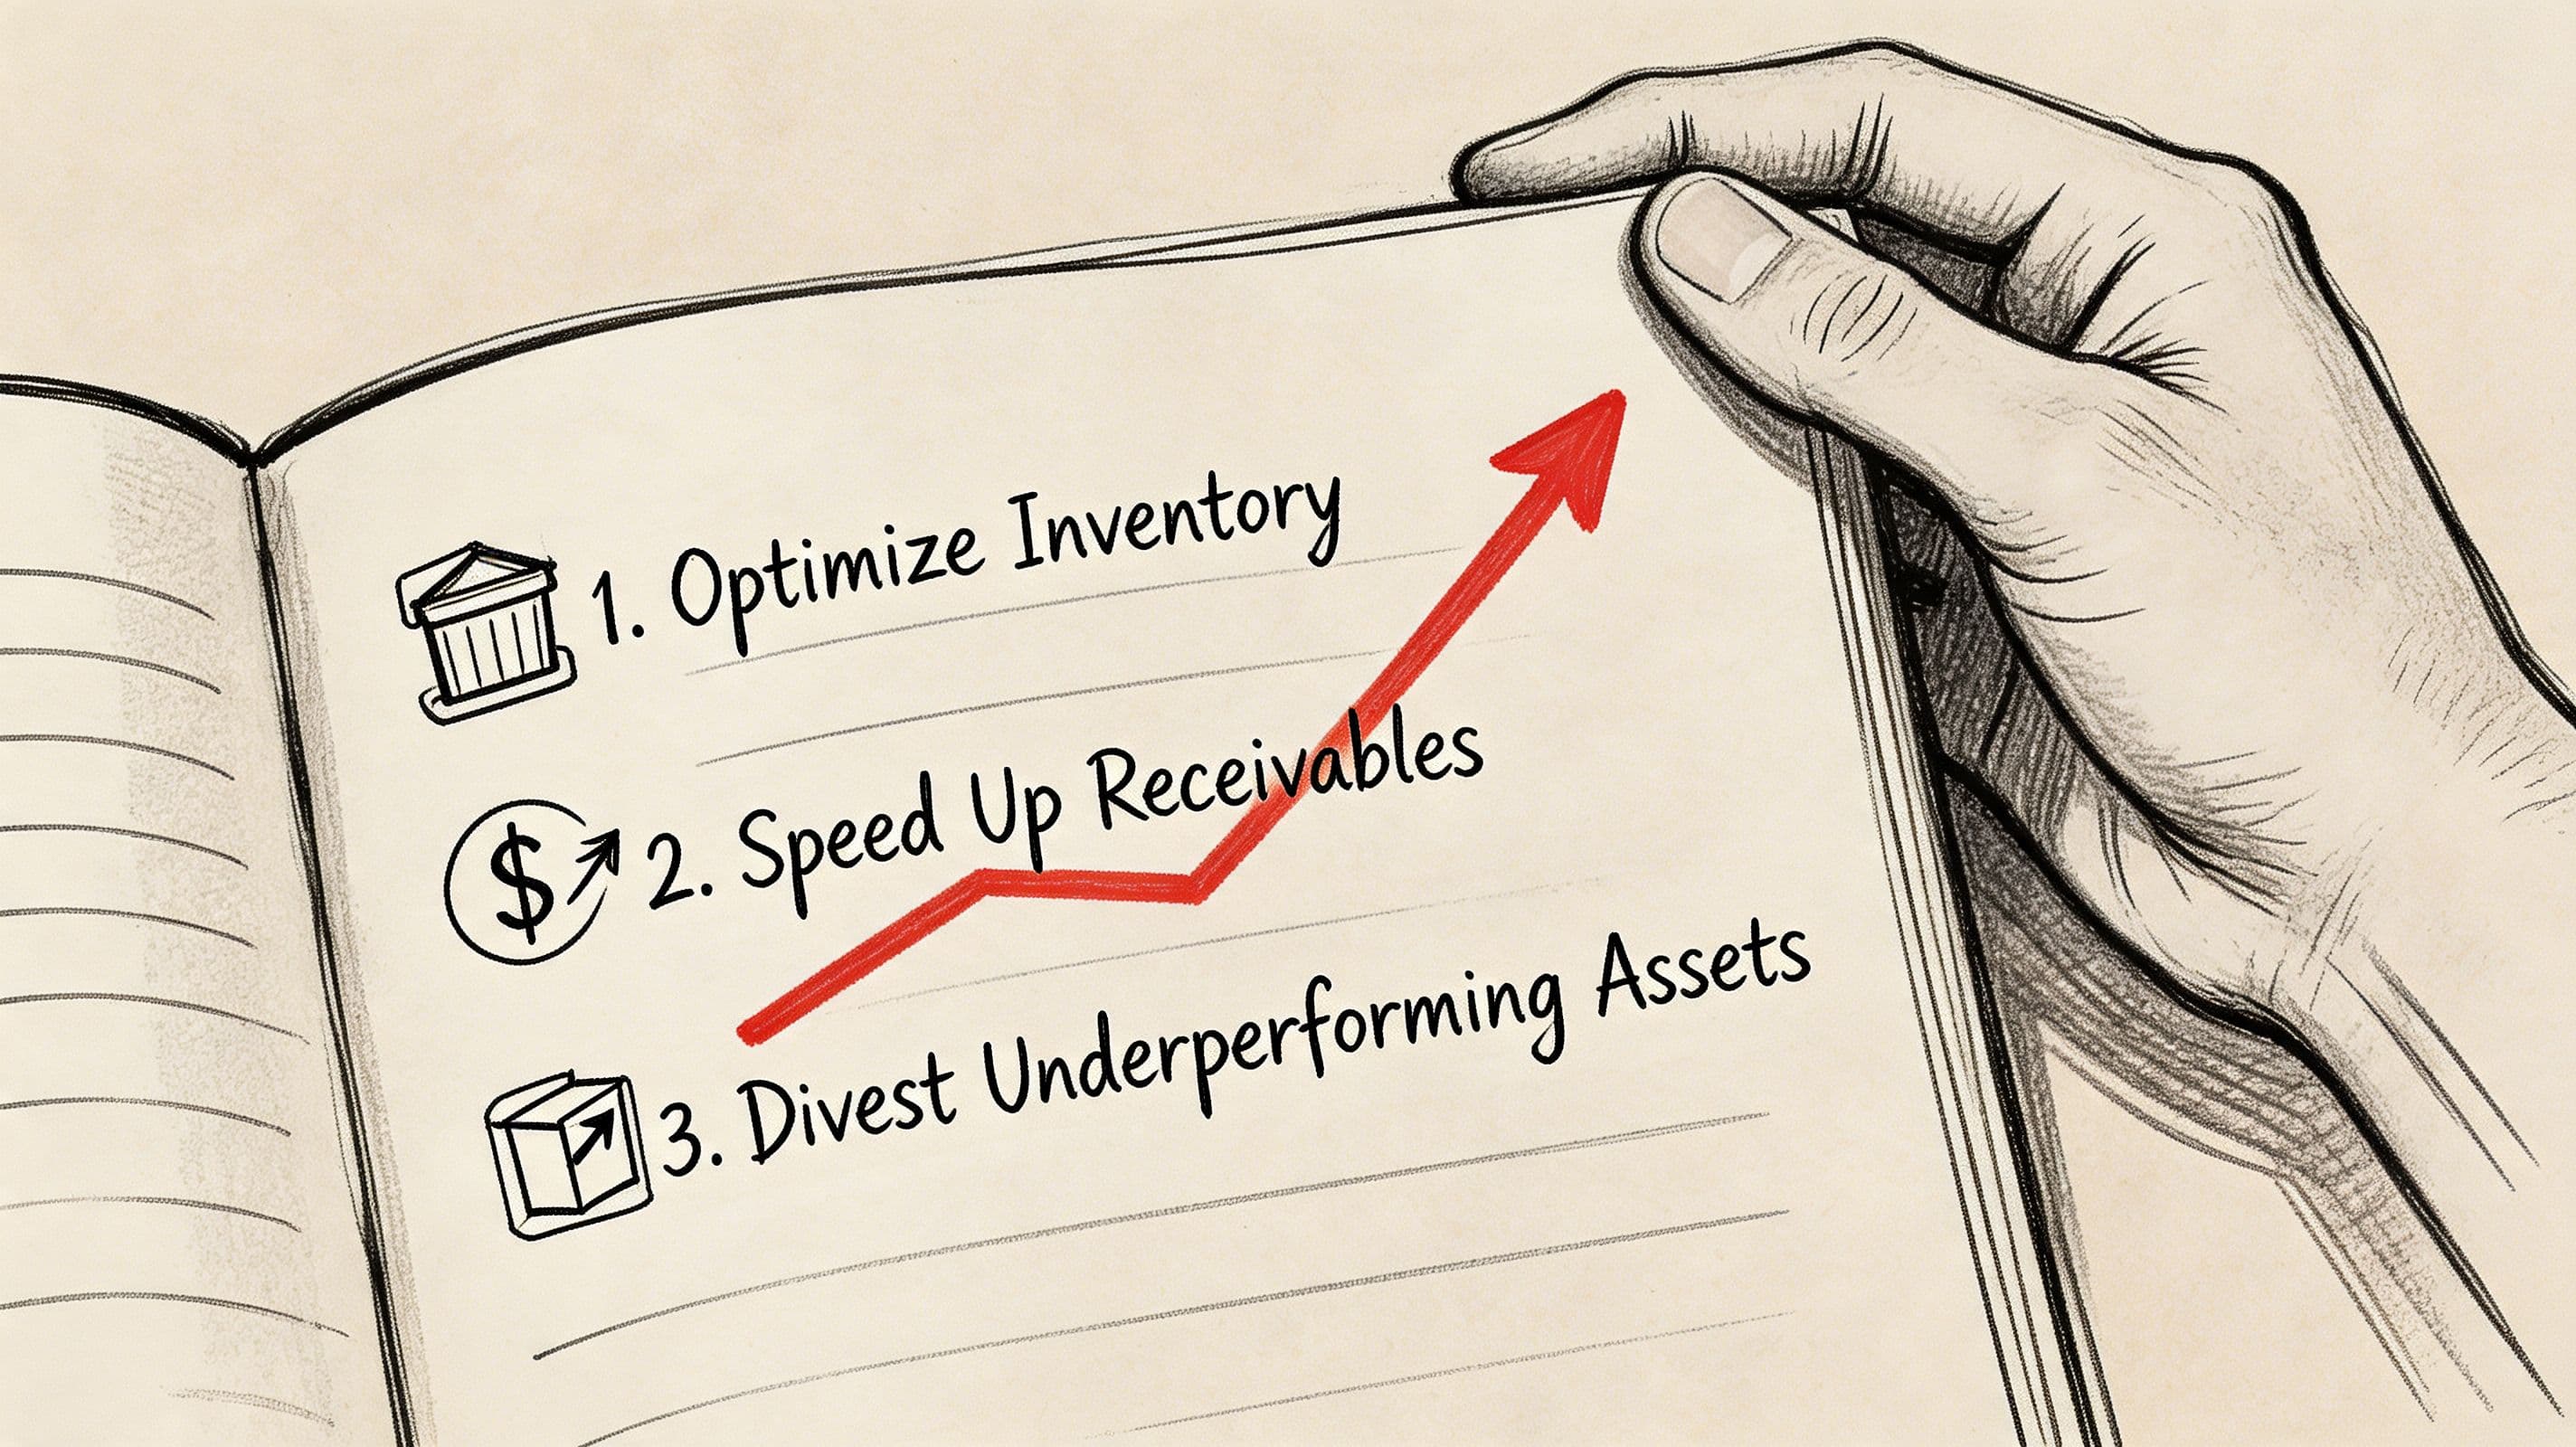
Actionable Ways to Improve Your Asset Turnover
You improve asset turnover by attacking the denominator, improving the numerator, or both. In SaaS and service businesses, the fastest gains usually come from billing discipline, receivables cleanup, and tighter working capital management.
Tighten accounts receivable first
For SaaS companies, low asset turnover often comes from accounts receivable cycles of 60 to 90 days. According to Allianz Trade’s asset turnover insight, implementing AR automation can reduce DSO from 45 to 30 days and directly boost asset turnover by 15% to 25%.
That’s not a finance vanity project. It’s direct operational advantage.
Use Stripe for subscription billing, automate reminders, clean up customer payment terms, and make invoice ownership explicit inside the team. If no one owns collections, AR always expands.
Review balance sheet assets that stopped earning their keep
Some assets deserve to sit on the books. Some don’t.
Look hard at:
- Idle cash that has no short-term use
- Prepaids that have grown without review
- Software subscriptions nobody uses
- Equipment or office costs tied to an old operating model
- Contract assets or unbilled balances that linger too long
If you run an ecommerce arm or hybrid business, inventory discipline also matters. This breakdown of ecommerce inventory health metrics is a useful complement because poor inventory turns suppress overall capital efficiency fast.
Increase revenue without adding proportional assets
This is the cleanest path.
Raise sales from your current delivery engine before you add more overhead, headcount, or systems complexity. For service firms, that means better utilization, cleaner scoping, and faster invoicing. For SaaS, it means stronger expansion revenue, tighter collections, and fewer implementation delays that postpone recognized revenue.
Here’s the practical playbook:
- Automate billing and collections. Stripe, QuickBooks, and NetSuite should reduce manual lag.
- Run a weekly AR review. Don’t wait for month-end.
- Set a policy for stale balance sheet items. Every asset account needs an owner.
- Track the ratio monthly, not annually. Trends matter more than year-end snapshots.
- Use outside support if the books are too messy to trust. Options include your internal controller, a fractional CFO, or firms like Jumpstart Partners that handle controller support, close processes, and KPI reporting for growing businesses.
If working capital is where your ratio is getting stuck, this guide on how to improve working capital is the right next read.
Operational advice: A low asset turnover ratio is usually a symptom. Fix billing cadence, collections, and balance sheet sprawl before you blame growth.
Reporting Asset Turnover to Investors and Your Board
Don’t dump the ratio into a board deck without interpretation. That’s lazy reporting.
Show the number, the trend, the benchmark, and the reason behind the change. Investors want to know whether your business is getting more efficient as it grows, not just whether revenue increased.
A board-ready narrative
Use language like this:
“Our asset turnover ratio for the period was [your ratio]. Relative to our business model, the key drivers were accounts receivable levels, cash deployment, and changes in average total assets. The trend indicates [improving/stable/declining] capital efficiency. Management is addressing this through tighter billing operations, AR follow-up, and balance sheet cleanup.”
Then pair that statement with a simple slide:
| Board Slide Element | What to include |
|---|---|
| Current ratio | Your latest period asset turnover |
| Trend | Last few reporting periods |
| Benchmark | Relevant peer context, not a random industry average |
| Driver analysis | AR, cash, deferred revenue, unbilled work, asset additions |
| Action plan | Specific operational fixes with ownership |
If you need help building sharper investor reporting, use a framework like this guide to startup investor reporting and board deck financials.
If your team can’t calculate asset turnover cleanly, explain why it’s moving, or turn it into an action plan, that’s a finance infrastructure issue. Jumpstart Partners helps SaaS, agency, and service businesses build investor-ready financials, tighten reporting, and turn balance sheet metrics into operating decisions.