Financial Operations
ACV vs ARR Explained for SaaS Growth and Valuation
Confused by acv vs arr? Learn definitions, formulas, worked examples and when to use each metric for forecasting, valuation and investor reporting.
ByJumpstart Partners, CPA, QuickBooks ProAdvisor
··15 min readYou're in a board meeting with two numbers on the screen. Sales is celebrating a large multi-year contract and quoting its ACV. Finance is presenting company growth through ARR. An investor asks why the new deal doesn't appear to increase ARR by the full contract amount, and the discussion stalls.
That confusion creates real operating problems. You can approve the wrong pricing strategy, set sales targets against the wrong baseline, or present valuation expectations that your recurring revenue base can't support. For a founder running a SaaS company, digital agency, or professional services firm at $500K to $20M in revenue, ACV and ARR need separate definitions, owners, and decisions.
Table of Contents
- Why Mixing Up ACV and ARR Costs You Clarity
- What ACV and ARR Actually Measure
- ACV vs ARR Side by Side Comparison
- Worked Examples With Real Numbers
- When to Use ACV and When to Use ARR
- Red Flags and Costly Misconceptions to Avoid
- Your Next Steps to Report Both Metrics With Confidence
Why Mixing Up ACV and ARR Costs You Clarity
A founder closes a three-year enterprise contract and sees a large total contract value. The sales team calls the deal a major ACV win. The board sees a smaller immediate change in recurring revenue because ARR measures the company-wide run rate, not the full value of a future contract.
Both views can be correct. The mistake is treating them as interchangeable.
ACV is a deal-level operating lever. It helps you understand whether your team is winning larger contracts, whether enterprise pricing is working, and which customer segments deserve more sales attention. ARR is a company-level performance lever. It shows the recurring revenue base supporting your forecast, hiring plan, valuation narrative, and investor reporting.
If you put ACV in an investor valuation discussion, you can overstate the scale of the business. If you put ARR in a sales compensation review, you can hide which deals are improving. The resulting dashboard may look polished while answering the wrong question.
Operating rule: Use ACV to manage the quality and size of individual deals. Use ARR to manage the value and durability of the recurring business.
You also need to separate bookings from recurring revenue. A signed contract represents commercial commitment, while ARR represents normalized recurring revenue across active subscriptions. That distinction belongs in the same finance operating system as your other SaaS financial metrics, not in a separate spreadsheet maintained by sales.
The rest of this guide gives you a decision-ready framework. You'll calculate each metric correctly, see where one-time fees belong, compare the metrics across forecasting and valuation use cases, and identify the reporting failures that create trouble in board decks.
What ACV and ARR Actually Measure
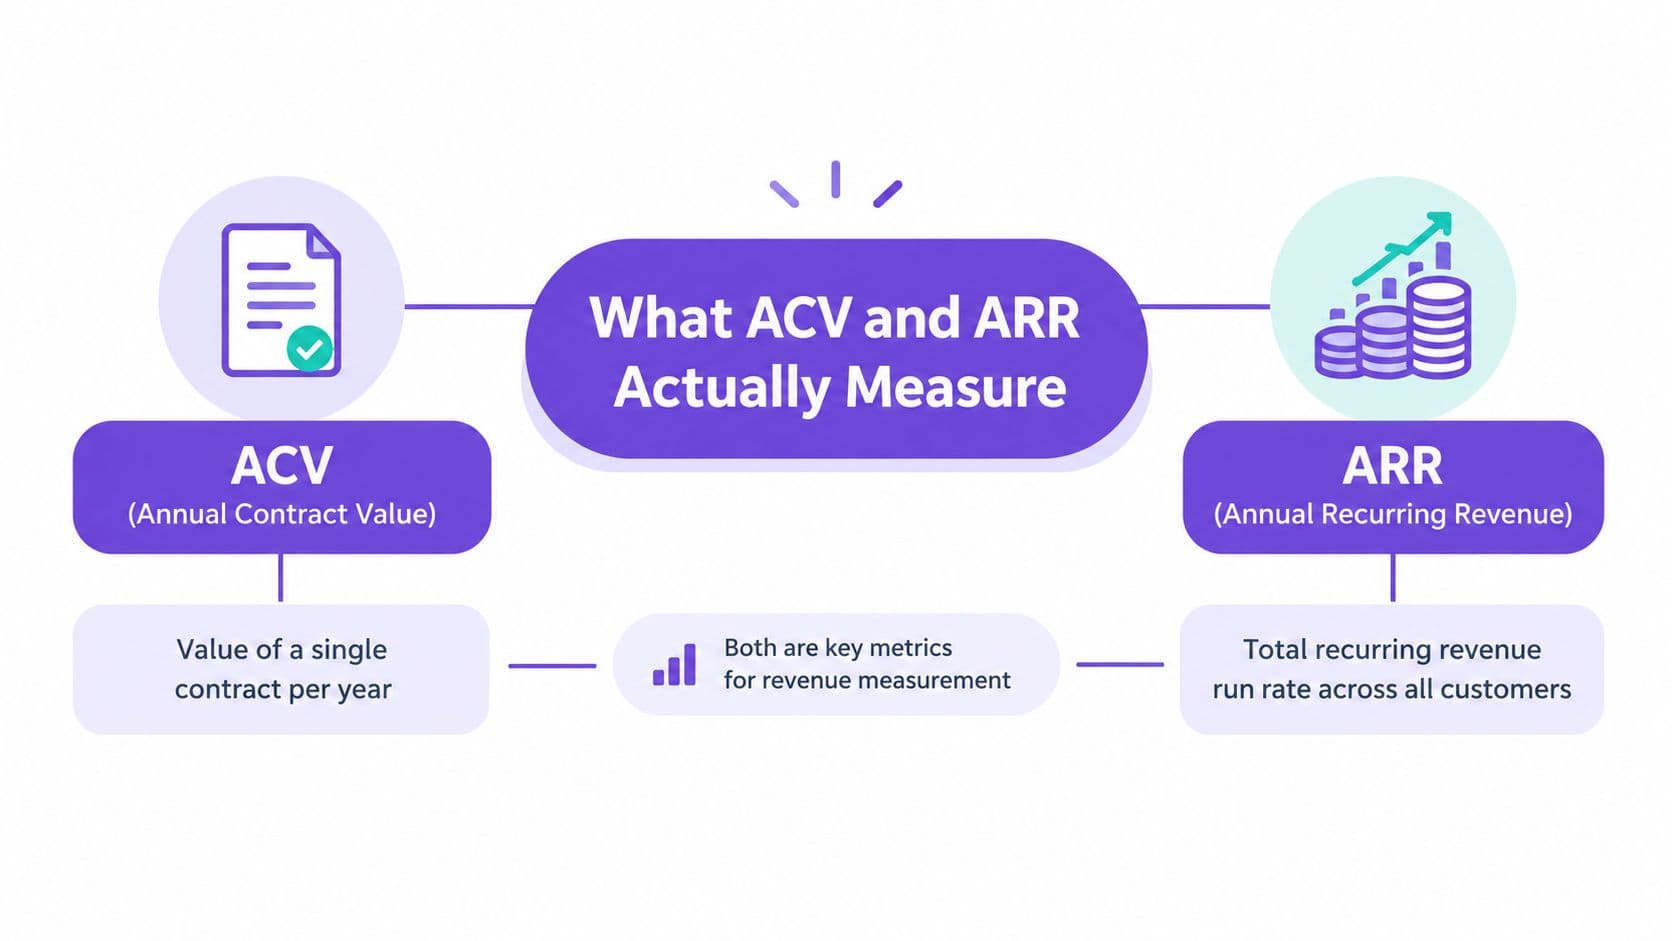
Annual Contract Value, or ACV, measures the average annual value of one customer contract. The standard calculation is:
ACV = recurring contract value ÷ contract length in years
Use the recurring portion of the contract and exclude one-time charges such as implementation, onboarding, or training. ACV answers a specific question: How much recurring contract value does this individual customer represent per year?
A three-year agreement is normalized into an annual figure so you can compare it with contracts of different lengths. That makes ACV useful for deal sizing, sales efficiency, customer segmentation, and compensation design.
Annual Recurring Revenue, or ARR, measures the total recurring revenue across all active customers, normalized to a 12-month period. A common shortcut is:
ARR = MRR × 12
ARR answers a different question: What recurring revenue run rate does the current customer portfolio support over the next 12 months? It aggregates active subscriptions rather than focusing on one contract, which makes it useful for company-wide forecasting, valuation, and growth tracking. The distinction between the two metrics is also outlined in this guide to annual recurring revenue.
What belongs in each calculation
| Metric | Include | Exclude | Primary question |
|---|---|---|---|
| ACV | Recurring subscription value normalized annually | One-time implementation, onboarding, or training fees | What is this contract worth per year? |
| ARR | Recurring revenue from active subscriptions | One-time fees and non-recurring services | What is our current recurring revenue run rate? |
Methodology matters most with ACV. Some companies include one-time fees in total contract value, while others exclude them. You need a written policy, applied consistently, so sales, finance, and leadership aren't presenting different versions of the same deal.
ARR is generally more standardized because it aggregates the active recurring base. That consistency is why it provides a stronger input for company-level forecasting and valuation, while ACV remains more useful for analyzing the sales motion.
Finance perspective: ACV explains the economics of a contract. ARR explains the scale of the recurring business.
ACV vs ARR Side by Side Comparison
The fastest way to choose the right metric is to match it to the decision in front of you. ACV belongs in deal reviews and sales analysis. ARR belongs in company forecasts, valuation materials, and recurring-revenue health reporting.
ACV vs ARR Decision Matrix
| Criteria | ACV | ARR |
|---|---|---|
| Scope | One customer contract | All active recurring customer contracts |
| Calculation | Recurring contract value divided by contract years | MRR multiplied by 12, or opening ARR plus changes in recurring revenue |
| Level of analysis | Deal level | Portfolio level |
| Best operating use | Deal sizing, pricing, segmentation, sales efficiency | Forecasting, valuation, growth tracking, investor reporting |
| Sensitivity to methodology | Higher, especially around one-time fees and contract definitions | Lower when recurring revenue rules are standardized |
| View of multi-year deals | Annualized value of the contract | Contribution to the active recurring base |
| Use in compensation | Useful for measuring deal quality and size | Too broad for most individual deal reviews |
| Use in valuation | Supporting context, not the primary company metric | Primary recurring-revenue input |
| Effect of churn | Doesn't describe the whole customer base | Directly reduces company-wide recurring revenue |
| Effect of expansion | Shows the value of the expanded contract | Shows the portfolio-level increase after expansion is active |
A high ACV can coexist with a modest ARR. That happens when you close a few large enterprise contracts but haven't built a broad recurring customer base. The reverse also happens. You can have substantial ARR made up of many smaller contracts while your ACV remains modest.
Decision rule: Put ACV beside pipeline, win rate, sales cycle, and segment performance. Put ARR beside churn, expansion, cash planning, and valuation.
Don't substitute bookings for either metric. Bookings help you understand signed commercial commitments and forward sales activity. If you want to separate that measure from recurring revenue, keep it in its own reporting layer and use a precise definition of bookings.
For a board deck, show ARR as the headline recurring-revenue measure. Add ACV as supporting detail when you need to explain changes in customer mix, enterprise penetration, or sales productivity. This format prevents a large contract from making the company appear larger than its active recurring base supports.
Worked Examples With Real Numbers
The formulas become useful only when your team applies them consistently. These examples show what to include, what to exclude, and how to reconcile the result with the way your dashboard reports recurring revenue.
Example one, calculating ACV
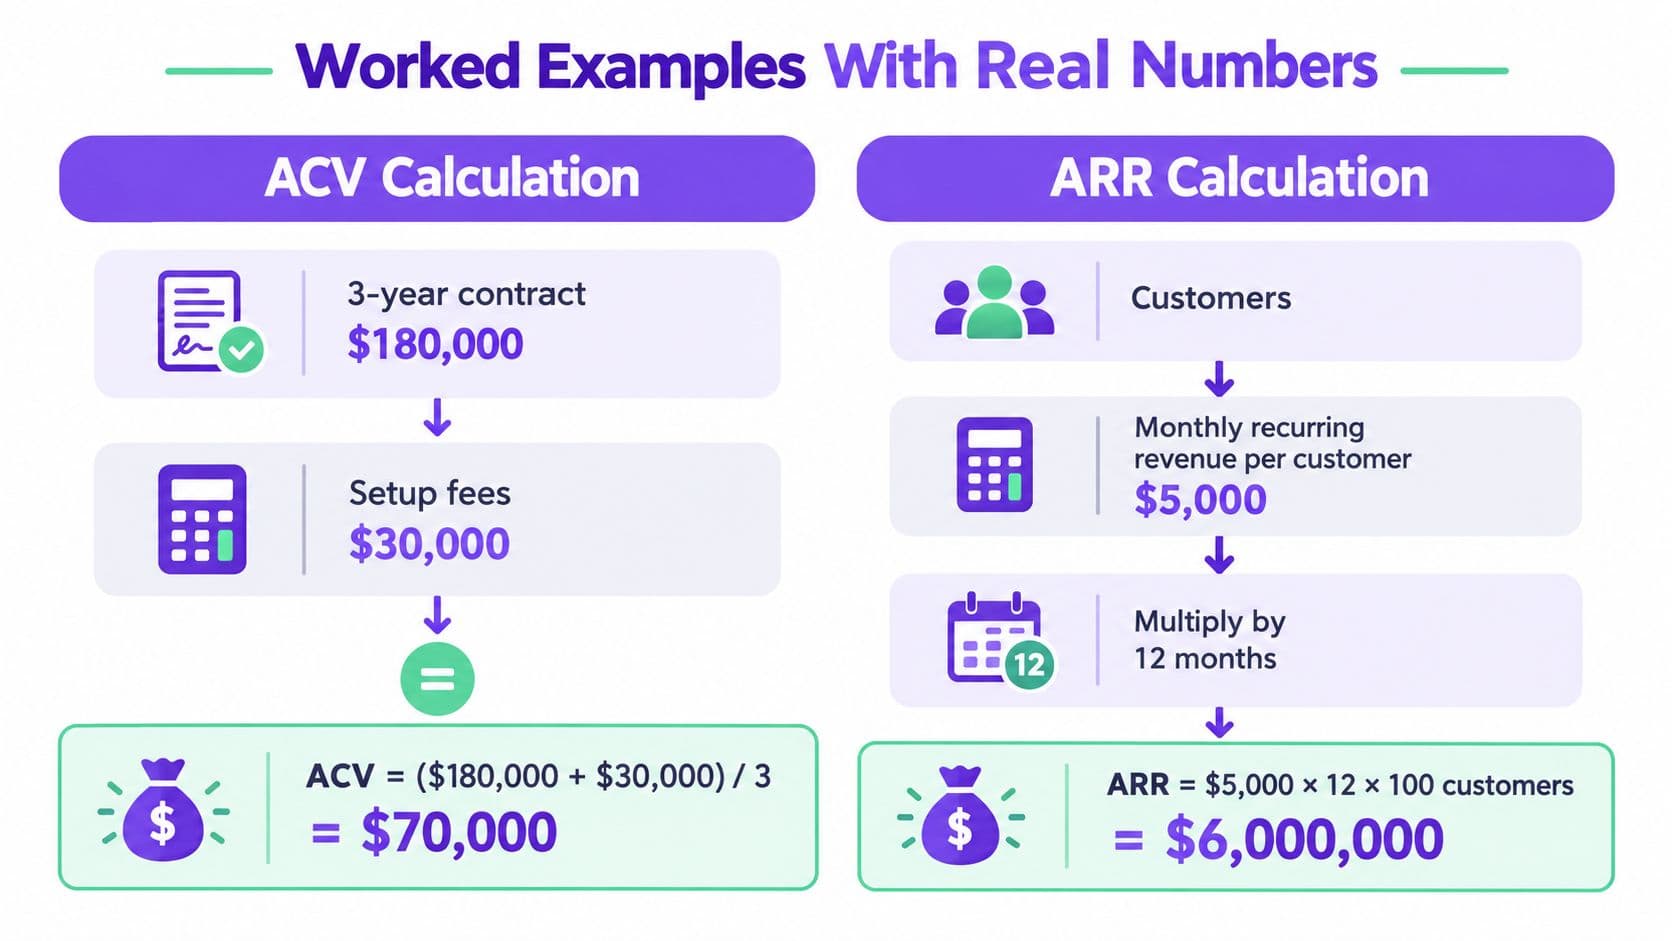
Assume a customer signs a three-year contract worth $180,000 and pays $30,000 in setup fees. The recurring portion is:
$180,000 total contract value − $30,000 setup fees = $150,000 recurring contract value
Now normalize that recurring value over the contract term:
$150,000 ÷ 3 years = $50,000 ACV
The ACV is therefore $50,000 per year, not $70,000. The setup fee doesn't represent recurring subscription value and shouldn't inflate the deal-level annual metric. This treatment follows the calculation guidance described in the ACV calculation example.
The infographic below illustrates the normalization process. Its visual formula includes setup fees in the displayed arithmetic, but for finance reporting, you should follow the stated rule and exclude one-time fees from ACV.
Example two, calculating ARR
Assume your business has $80,000 in monthly recurring revenue. The run-rate calculation is:
$80,000 MRR × 12 = $960,000 ARR
Now assume the company adds $120,000 in new ARR and loses $60,000 through churn. The ending ARR calculation is:
$960,000 starting ARR + $120,000 new ARR − $60,000 churn = $1,020,000 ending ARR
The result reflects the current recurring base after new business and losses. This approach is documented in the ARR calculation guidance.
For a practical example of how a business can think about scaling recurring revenue, you can also review how an ecommerce brand scaled. The lesson for your own reporting is simple: separate recurring run rate from one-time implementation revenue, services, and signed but not yet active commitments.
When to Use ACV and When to Use ARR
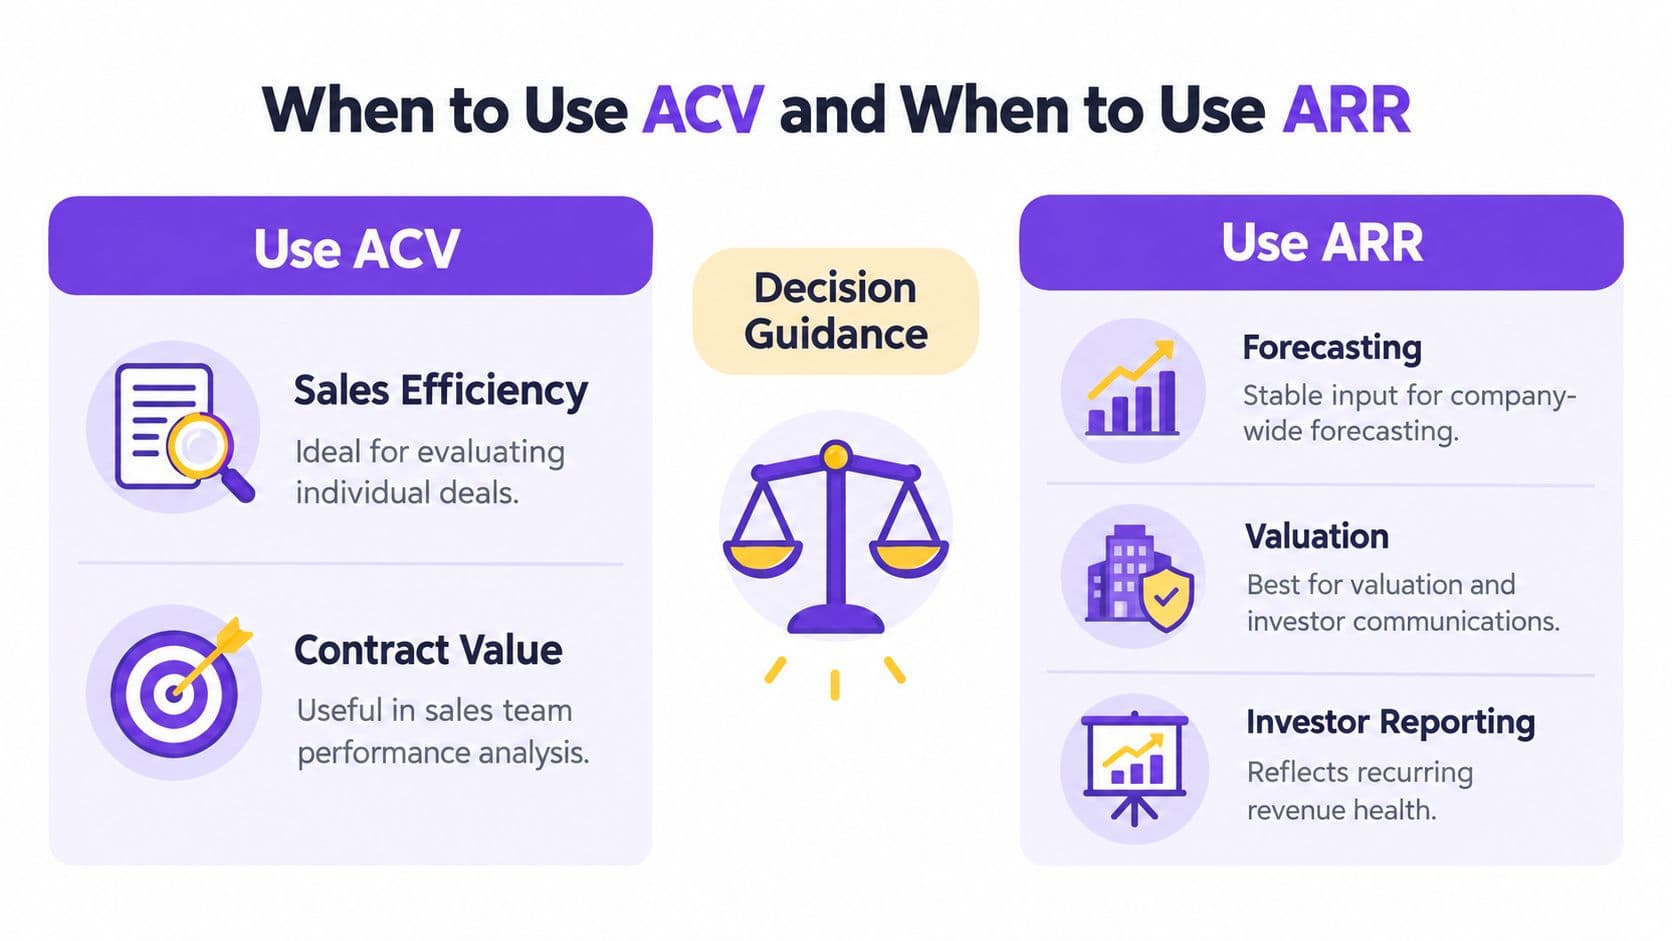
Use ARR for company-wide decisions and ACV for contract-level decisions. That division keeps your operating reviews focused and prevents one metric from carrying a job it wasn't designed to do.
Use ARR for forecasting and valuation
ARR is the better forecasting input because it normalizes recurring revenue across the entire active customer portfolio. It gives you a common base for planning payroll, product investment, cash requirements, and hiring. It also creates a clearer narrative for investors because valuation discussions depend on the scale and durability of the company-wide recurring base, not the annualized value of one contract.
ARR also helps you analyze the effect of new business, cancellations, downgrades, and expansions. A large enterprise win matters, but it matters to ARR when its recurring service is active and included in the current recurring base.
Use ACV for sales and pricing decisions
ACV is the operating metric for your go-to-market team. Use it to compare deal sizes, analyze customer tiers, identify the segments producing valuable contracts, and evaluate whether your pricing architecture supports the sales motion.
Independent benchmark data shows why a universal ACV target is a poor management tool. One benchmark covering 939 companies reports median ACV ranges of $8K to $15K for horizontal SaaS, $25K to $50K for vertical SaaS, $50K to $150K for infrastructure and DevOps, and $100K to $300K for enterprise security. The same source places early-stage companies under $5M ARR around $12K median ACV, and growth-stage companies at $10M to $50M ARR around $35K. These figures come from independent B2B SaaS ACV benchmarks.
A separate benchmark places general SaaS ACV at $1K to $20K, SMB-focused SaaS at $1K to $5K, mid-market SaaS at $5K to $25K, and enterprise SaaS at $25K to $100K or more. Those ranges reinforce the same operating point: customer size and implementation complexity generally push ACV higher.
| Decision | Primary metric | Supporting metric |
|---|---|---|
| Board forecast | ARR | ACV by segment |
| Company valuation | ARR | ACV mix and contract concentration |
| Sales compensation | ACV | New ARR |
| Pricing tiers | ACV | ARR contribution |
| Customer expansion | ARR movement | Expanded ACV |
| Pipeline quality | ACV | Bookings and conversion |
| Investor reporting | ARR | Contract duration and ACV distribution |
Hybrid pricing requires a separate bridge
Hybrid contracts create the reporting gap most guides ignore. You may sell a recurring subscription alongside usage-based consumption, onboarding, implementation, or professional services. Don't force every charge into ACV or ARR.
Create a revenue bridge with separate lines:
- Base recurring subscription, included in ARR and ACV.
- Contracted recurring minimum, included when it meets your documented recurring-revenue policy.
- Variable usage revenue, reported separately until your policy determines how it enters recurring metrics.
- One-time implementation and onboarding, excluded from ACV and ARR.
- Professional services, tracked outside recurring revenue.
Document that treatment before you prepare an investor deck. The practical challenge of normalizing hybrid fees for board and investor reporting is covered in guidance on ACV and ARR.
Multi-year enterprise deals create another trap. A high ACV can show excellent deal size while ARR growth slows if existing logos churn or expansion takes longer than expected. Track the new contract's ACV separately from its contribution to ending ARR, then report retention and expansion movement alongside both metrics. That view prevents sales success from masking portfolio weakness.
Keep the accounting layer distinct from the operating layer. Your ARR dashboard can show recurring run rate, while your accounting records follow the required revenue recognition treatment. For subscription billing and close processes, align the metric definitions with your subscription accounting workflow.
Red Flags and Costly Misconceptions to Avoid
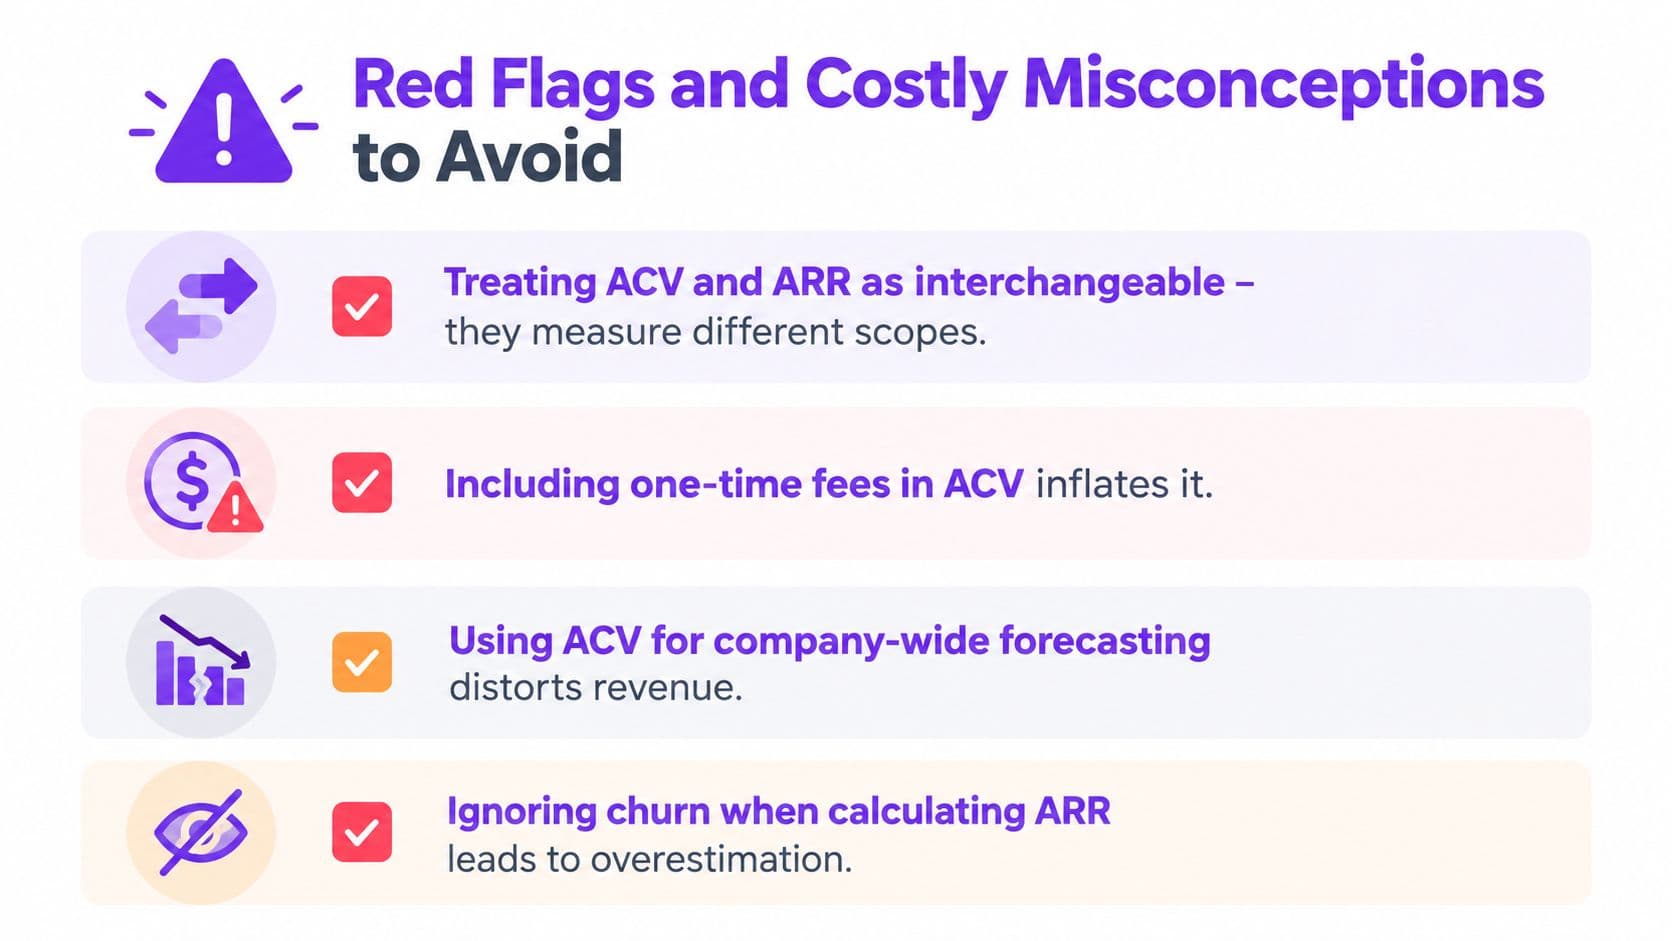
Your dashboard needs an audit, not another chart. These warning signs show that ACV and ARR are being used outside their proper scope.
Red flag one, interchangeable labels
If your sales report calls a contract's annualized value ARR, while your finance report uses ARR for total active recurring revenue, leadership is comparing unlike numbers. Fix it by naming the metric with its scope, such as customer ACV, new ARR, expansion ARR, or ending ARR.
Red flag two, one-time fees inside ACV
A dashboard that includes implementation, training, or onboarding fees in ACV inflates deal quality. The fix is straightforward: remove non-recurring charges from the annualized contract value and report them in a separate services or one-time revenue category.
Red flag three, ACV used for company forecasting
A large ACV from a few enterprise deals doesn't prove that the overall recurring base is growing. If cancellations or downgrades offset new contracts, your forecast needs to show that movement through ARR, not through the largest contract on the bookings report.
Red flag four, ARR ignores churn
An ARR calculation that starts with MRR and adds new business without subtracting cancellations and downgrades overstates the run rate. Reconcile starting ARR to ending ARR through new, expansion, contraction, and churn movements.
Hybrid pricing deserves its own warning. If usage-based revenue, minimum commitments, and one-time implementation charges all sit in one metric, investors can't tell what revenue is predictable. Build a reconciliation that shows each component and apply the same policy every reporting period.
Your Next Steps to Report Both Metrics With Confidence
Start Monday with a metric policy, not a new dashboard. Write down your definitions, exclusions, source systems, and reporting owner before you change the formulas.
- Define ACV: Calculate recurring contract value divided by contract years, excluding one-time fees.
- Define ARR: Calculate the active recurring base through MRR multiplied by 12, then reconcile new business, expansion, cancellations, and downgrades.
- Separate revenue types: Keep subscriptions, usage, implementation, and professional services visible as distinct categories.
- Assign system ownership: Use your CRM for contract terms, Stripe or another billing platform for subscription activity, and QuickBooks or NetSuite for the accounting record.
- Reconcile monthly: Tie the ARR bridge to billing data and investigate every unexplained movement before the board meeting.
- Align with ASC 606: Keep operating metrics separate from recognized revenue, but make sure contract data supports the revenue recognition process.
- Improve the dashboard: Add ACV by segment, ending ARR, new ARR, expansion ARR, churned ARR, and contract concentration. A resource covering top sales KPIs for dashboards can help you choose supporting sales measures without replacing the core revenue metrics.
For examples of how to organize investor-ready reporting, review these financial reporting package examples. Your final package should let a director answer three questions quickly: how large is the recurring base, what is changing it, and which deals are driving the change?
Jumpstart Partners can help you standardize ACV and ARR definitions, connect QuickBooks, Stripe, and related systems, implement ASC 606 workflows, and build recurring-revenue reporting for your close and investor package.
Jumpstart Partners provides outsourced controller and bookkeeping support for SaaS, agencies, and professional services businesses between $500K and $20M in revenue. Visit Jumpstart Partners to set up a clean ACV and ARR reporting process, improve close visibility, and prepare financials your board and investors can trust.